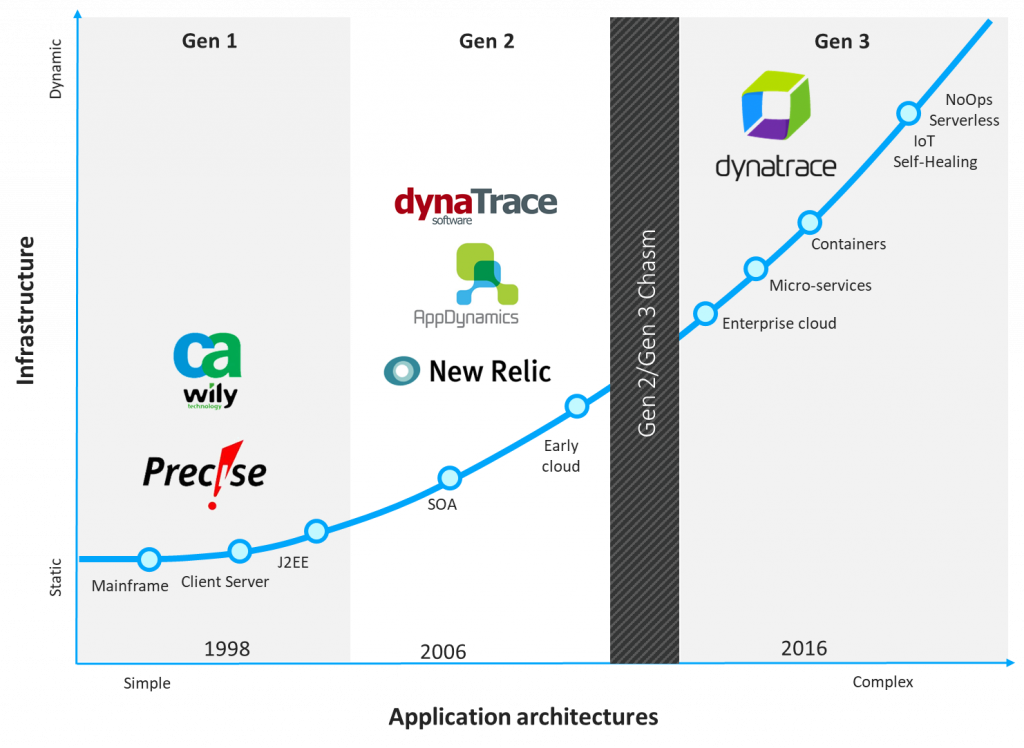
When we refer to Dynatrace as a gen 3 monitoring solution, compared to traditional gen 2 APM solutions like AppDynamics and New Relic, it may sound like marketing hyperbole. But the distinction is real, and it makes a big difference to customers as they transform their own businesses. Let’s take a brief stroll through history to see why.

The early days of APM
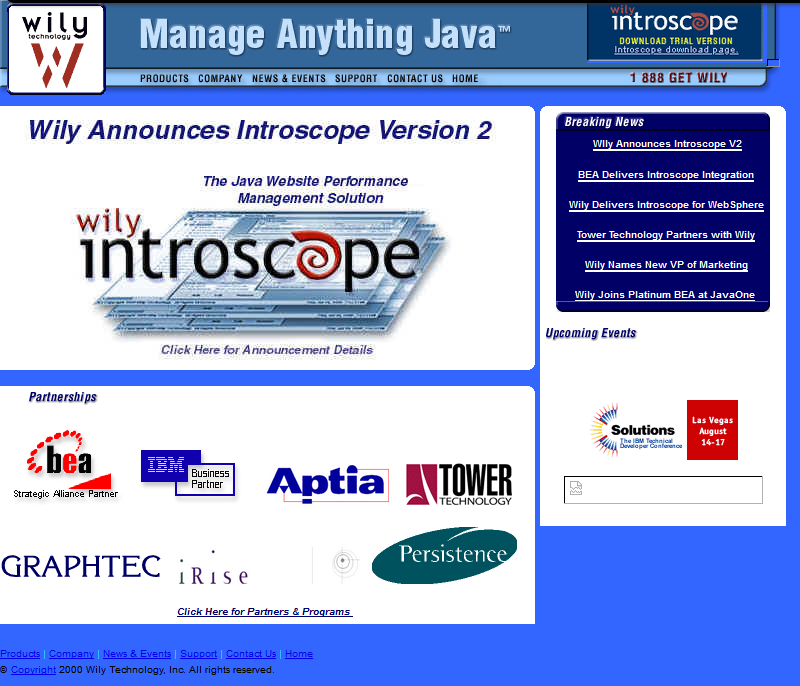
The application performance monitoring market dates to the late 1990s, with Wily Technology (later acquired by CA) and Precise Software leading the way. This first generation of APM solutions came about following the rapid rise of Java and the need to manage performance. Infrastructure was largely static, and the applications built with Java were relatively simple.

The rise of SOA and gen 2 monitoring
The 2000s saw the rise of service-oriented architectures (SOA), which brought the promise of increased flexibility and agility. Along with those benefits however, came increased application complexity, which required a new generation of monitoring.
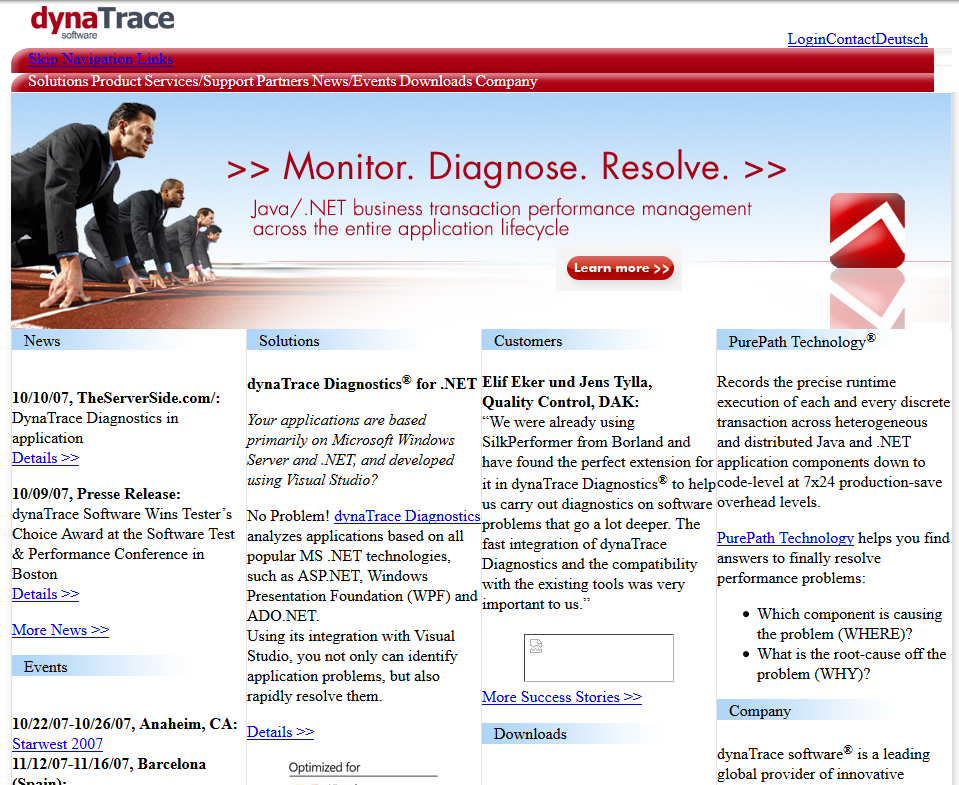
This new generation was led by the original “Dynatrace product” (back when we had a small ‘d’ and big ‘T’), also known as AppMon, along with a couple offshoots of CA Wily, namely AppDynamics and New Relic. The “Dynatrace product” introduced the concept of PurePath – dynamic tracing of a single transaction – to deal with this new complexity. AppDynamics and New Relic addressed other shortcomings of Wily, improving on ease of implementation and ease of use.

The need for a new approach
These gen 2 APM solutions served customer needs well for several years, but of course change was inevitable. Now, cloud is the new enterprise compute platform and microservices are the building blocks for new hyper-scale applications, bringing along a whole new set of technologies, processes and concepts like multi-cloud, serverless computing, container orchestration, DevOps, IoT and edge computing.
Business and IT now have a new set of technologies to disrupt their industries, drive competitive advantage, and digitally transform their organizations. This increases application complexity even more by breaking monolithic apps into small, frequently changing components. Importantly, the underlying infrastructure has also changed dramatically, from mostly static to highly dynamic.
The old approach to monitoring, the Gen 2 approach, no longer works in this new cloud world.
Building a new gen 3 platform
For Dynatrace, this shift to cloud created an opportunity. We recognized the seismic shift that was coming and had done the homework to conclude the best way to take advantage of this seismic shift was to reinvent monitoring from the ground up. Evolution would not work. Reinvention was the only approach.
We took an Innovator’s Dilemma approach, and purpose built for where the market was going. We came to market in 2014 with an MVP (minimum viable product) we called Ruxit. We architected for the enterprise, but knew we had to mature the new platform for more use-cases and robustness required by our mainstream audience. We kept improving it with new releases every two weeks until it was battle-tested and enterprise-proven, at which point in 2016 it became the new Dynatrace platform. (A platform which, by the way, monitored almost 63 TRILLION transactions last year for our customers. So yes, you could say it’s enterprise proven!)
In short, we took advantage of a disruptive market moment and leapt ahead. No other monitoring vendor has yet done the same. They’re still peddling the same old Gen 2 architectures promising they’ll work in this new cloud world.
What does it take to be gen 3?
- Fully automated, start to finish. With a highly dynamic infrastructure and incredibly complex applications, your monitoring approach must be fully automated from deployment to discovery, problem identification and root cause.
- AI-powered at its core. Everyone is talking about AI, but it can’t be just a bolt-on afterthought. AI must be at the heart of monitoring. It starts with the best data, and causation-based AI that goes way beyond just correlating time series metrics.
- All-in-one. Monitoring tool sprawl is a real problem, and having multiple, siloed tools won’t help with a complex, dynamic environment. You need a simple, single-agent, full stack, all-in-one approach.
- Purpose-built for cloud native. If your monitoring tool was built before containers existed, it treats a container as just a tiny server. Dynatrace is purpose-built for cloud native environments. It scales to 100,000+ instances and auto-detects containers and the processes running inside of them.
Why does it matter?
Don’t let the gen 2 vendors tell you this is just marketing hype, or that they are really a “next gen” solution. I speak with customers regularly and the difference matters.
A few recent examples:
- When one of AppDynamics’ biggest customers in France saw Dynatrace, the reaction was amazing. “It’s like we had been using Windows 95 and you showed us Windows 10.” They replaced AppD with Dynatrace because of our container and microservice approach, our innovation, and our every-two-week releases.
- A large US-based eCommerce company experienced major outages and performance slowdowns for over a year, and Cisco AppDynamics wasn’t helping in their complex, cloud environment. Not only did Dynatrace help them solve their problem, we also helped them rethink their entire monitoring approach, moving from reactive/dashboard watching to proactive and strategic.
- A large eLearning company started refactoring their apps using Pivotal Cloud Foundry. They realized New Relic would no longer work for them – it couldn’t scale, couldn’t help them find the root cause of problems, and was too painful to deploy in their complex, dynamic environment. Dynatrace was a perfect fit, and the customer was able to replace not only New Relic, but also AppNeta and LogicMonitor, thanks to our all-in-one approach.
When gen 2 monitoring solution users see Dynatrace, it’s like a light bulb turns on. It’s the difference between watching a movie with Blockbuster versus watching a movie with Netflix.

It’s easy to see the difference
So, what are you waiting for? Take Dynatrace for a spin, and see the gen 3 monitoring difference today.


Looking for answers?
Start a new discussion or ask for help in our Q&A forum.
Go to forum