
Application Performance Monitoring has been around for twenty years, and the technology has undergone some big changes in that time. We are now in the third generation of monitoring, but many organizations are still using gen 2 solutions.
Be on the lookout for these warning signs that you may be using a gen 2 monitoring tool designed in the 2000’s!
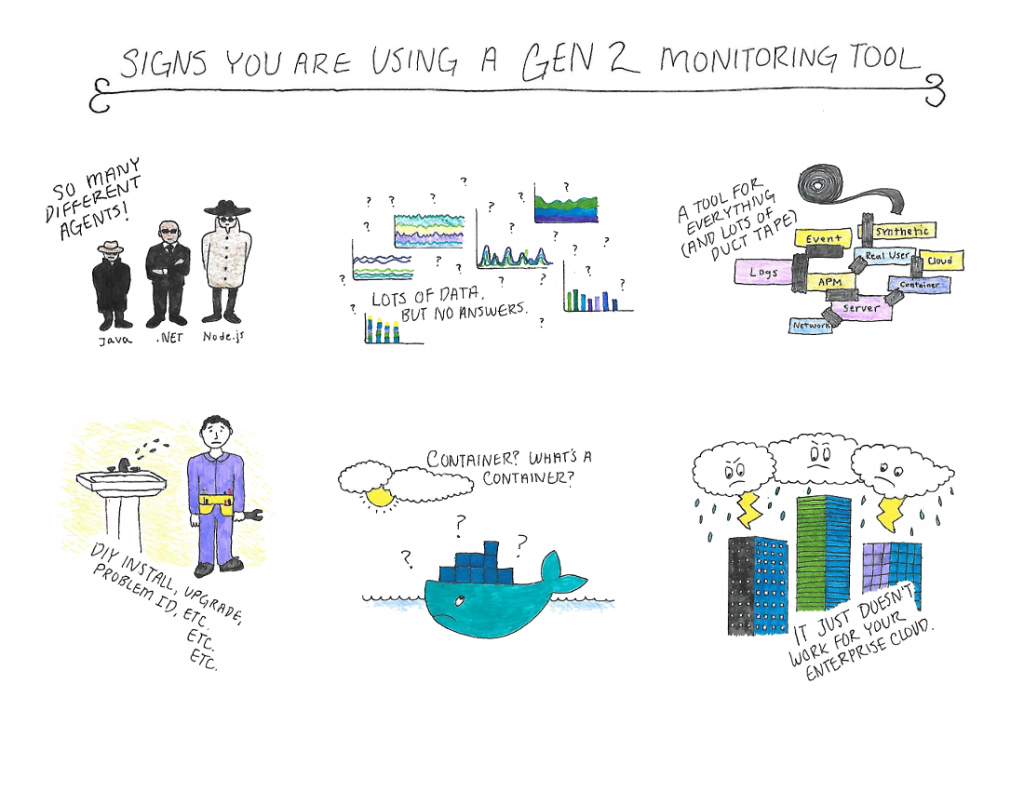
So many agents!
Running separate agents for Java, .NET, PHP, Node.js, servers, real user experience, and more? What a nightmare. There’s no way to manage that in today’s complex, hybrid multi-cloud environments. If you need to spend weeks mapping out your application just to figure out how to monitor it, then there’s a good chance you are using a gen 2 monitoring solution.
Lots of data, but no answers
All monitoring tools generate a lot of data. It’s what they do with the data that makes all the difference. A gen 2 solution presents you with a bunch of nice looking charts and metrics, but it leaves the analysis to you. That was fine when environments were simpler and possible for a human to comprehend. That’s no longer the case in a gen 3 world. You need insights and answers — fast.
A tool for everything (and lots of duct tape)
Gen 2 APM tools are all about the application, and that’s a great place to start. The problem is, your application performance depends on much more than just code. So, over time you’ve probably added a bunch of other monitoring tools to see your servers, network, log files, user experience, and more. While gen 2 monitoring vendors have scrambled to add new pieces that cover these other components, the approach is piecemeal, not holistic. The result? Extra software costs, maintenance costs, people costs, and training costs, but still no answers.
DIY install, upgrades, problem ID, etc. etc. etc.
With gen 2 monitoring, everything is manual. Implementation and upgrades, discovery, problem identification, business impact and root cause; it’s all do-it-yourself. You could handle that when application environments were simpler, but there is a reason most companies are only monitoring only their 5-10% most critical applications – it’s too hard!
Container? What’s a container?
Gen 2 monitoring solutions were developed before anyone knew what a container was. So, what do you do if you’re a gen 2 solution provider? You pretend a container is just a miniature server. That means manually instrumenting each container with the right agent, modifying images, installing, and configuring plugins. Not to mention pricing models that no longer work. But containers aren’t tiny servers. The whole idea behind containers is to simplify and move faster, but you can’t do that with outdated monitoring tools.
It just doesn’t work for your new cloud
The new cloud is all about agility, innovation, and time-to-market. That means DevOps teams deploying containers and microservices running in a hybrid, multi-cloud environment that must be production-grade and scalable. Gen 2 monitoring is simply not designed for this world, and it won’t work.
If these warning signs sound familiar to you, it might be time to look into an automated, AI-powered, all-in-one, gen 3 monitoring solution. Dynatrace is the only monitoring solution that was designed and built specifically for the new cloud. That’s why so many customers are switching to Dynatrace from gen 2 tools like AppD or New Relic.
Take Dynatrace for a test drive!
Start your free trial within five minutes.
Your gen 2 monitoring troubles will soon be forgotten.


Looking for answers?
Start a new discussion or ask for help in our Q&A forum.
Go to forum