Overview
The Event Streaming configuration allows you to monitor the usage of your Salesforce CRM account.
Enable use cases like:
- What are the slowest Lightning or Classic pages response times
- Track Session Hijack, Credential Stuffing and Anomaly Events
- Track important permission sets changes
- What files are being uploaded and download? By which users?
- What are the most used reports, who is running them, what queries are being used?
- How many users are using the platform currently, what is the user experience?
- What are the top API Queries being made?
- Where is Salesforce being accessed from?
- What browsers are users using?
Requirements
- A Salesforce account with real time event streaming enabled
- For Username + Password authentication, the username, password and security token
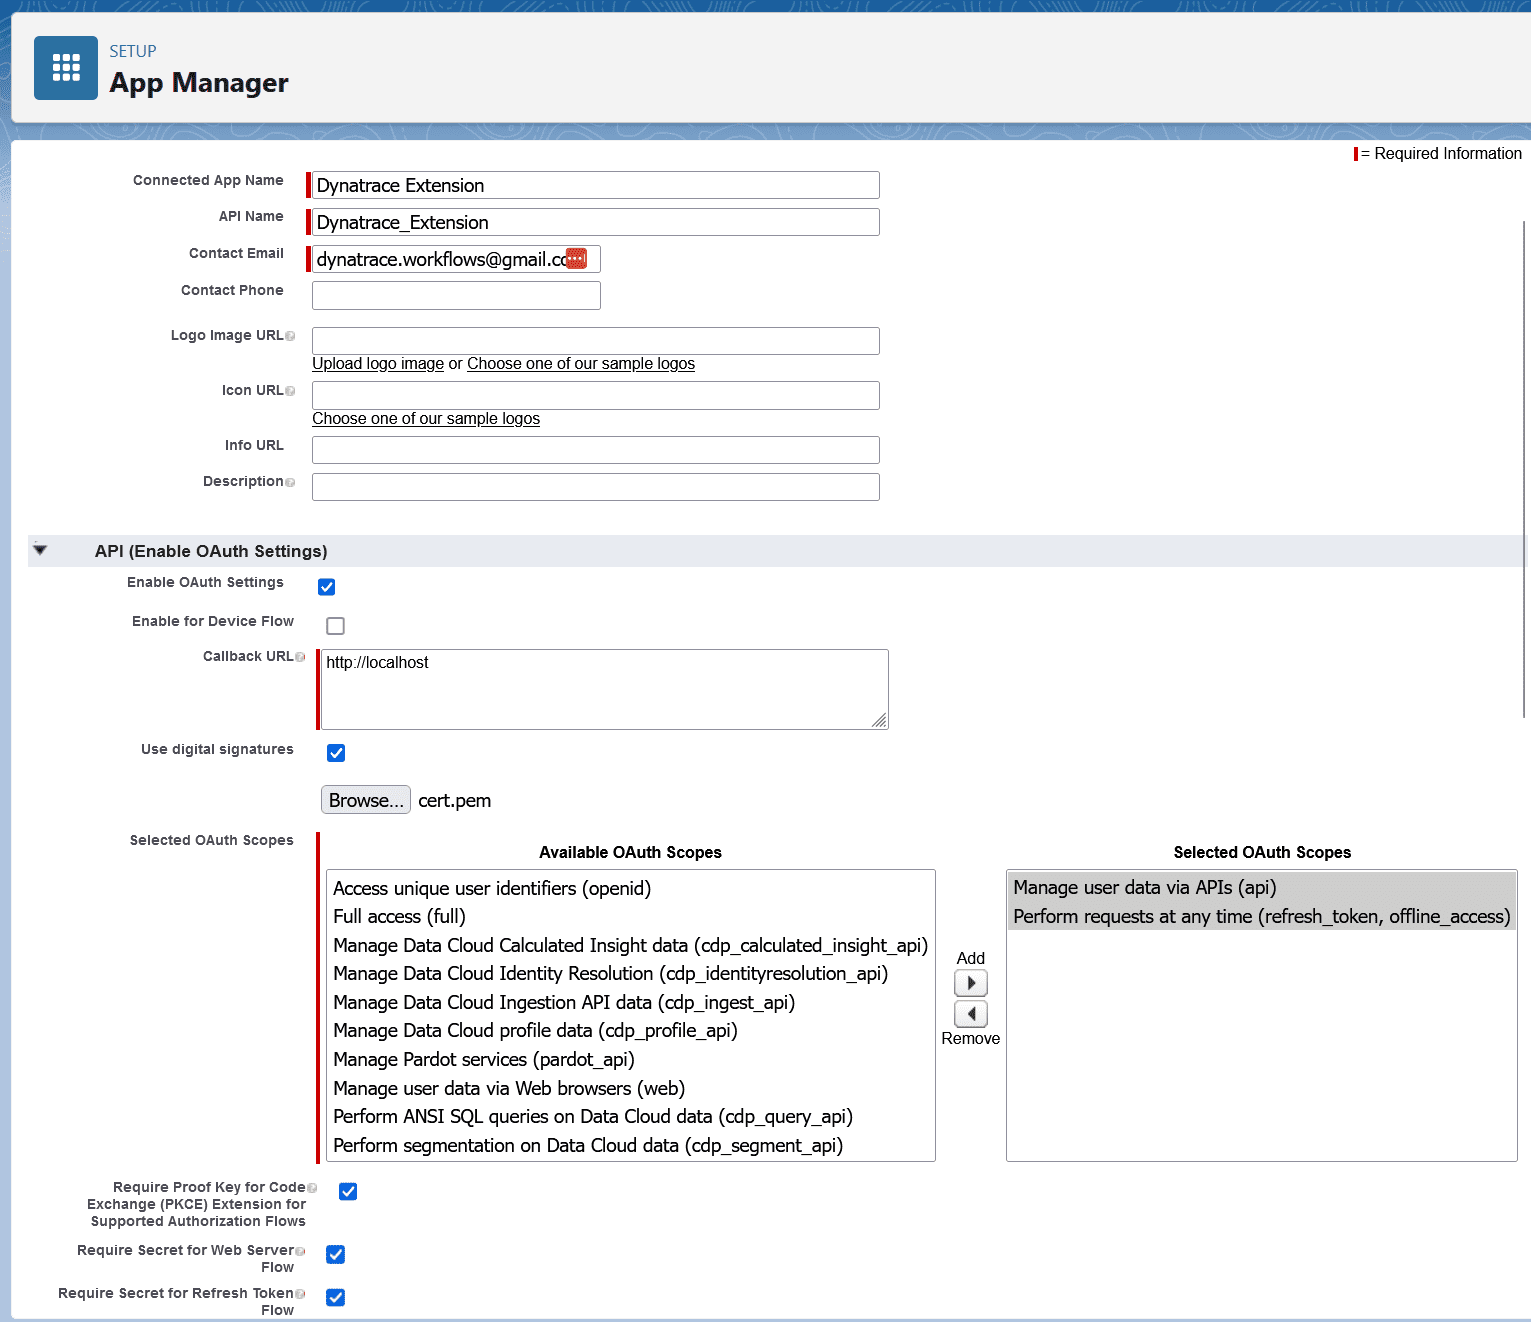
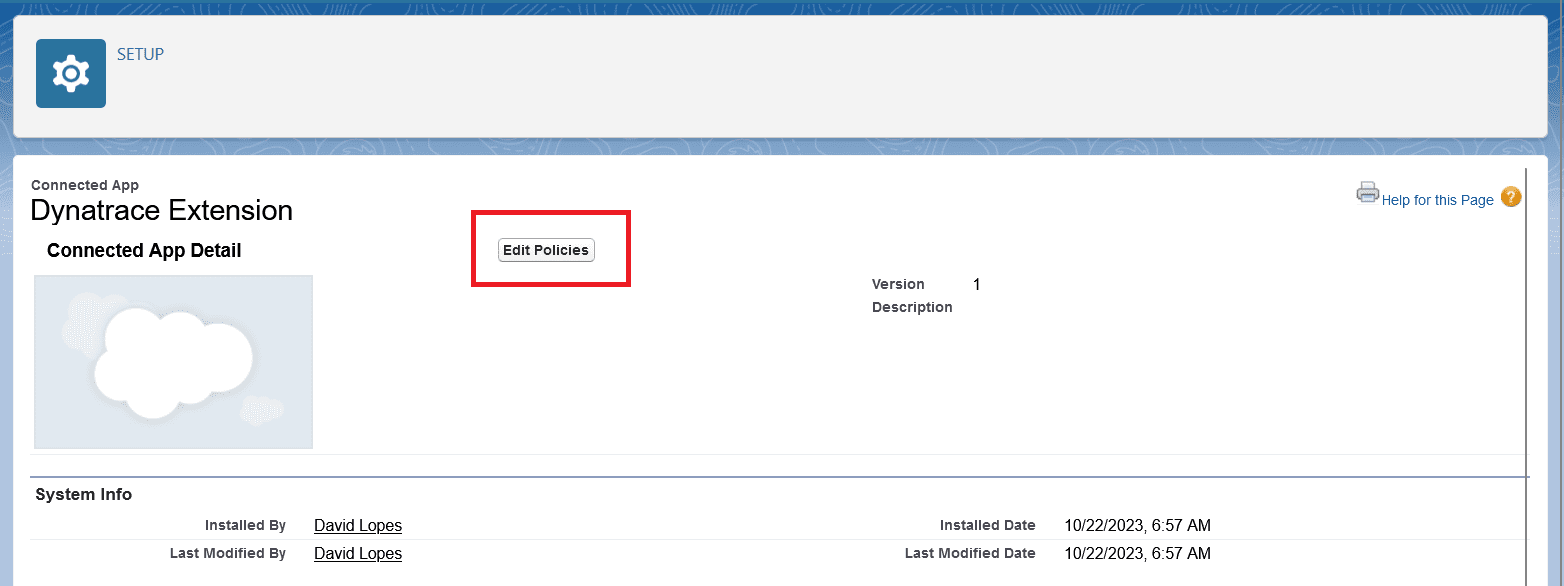
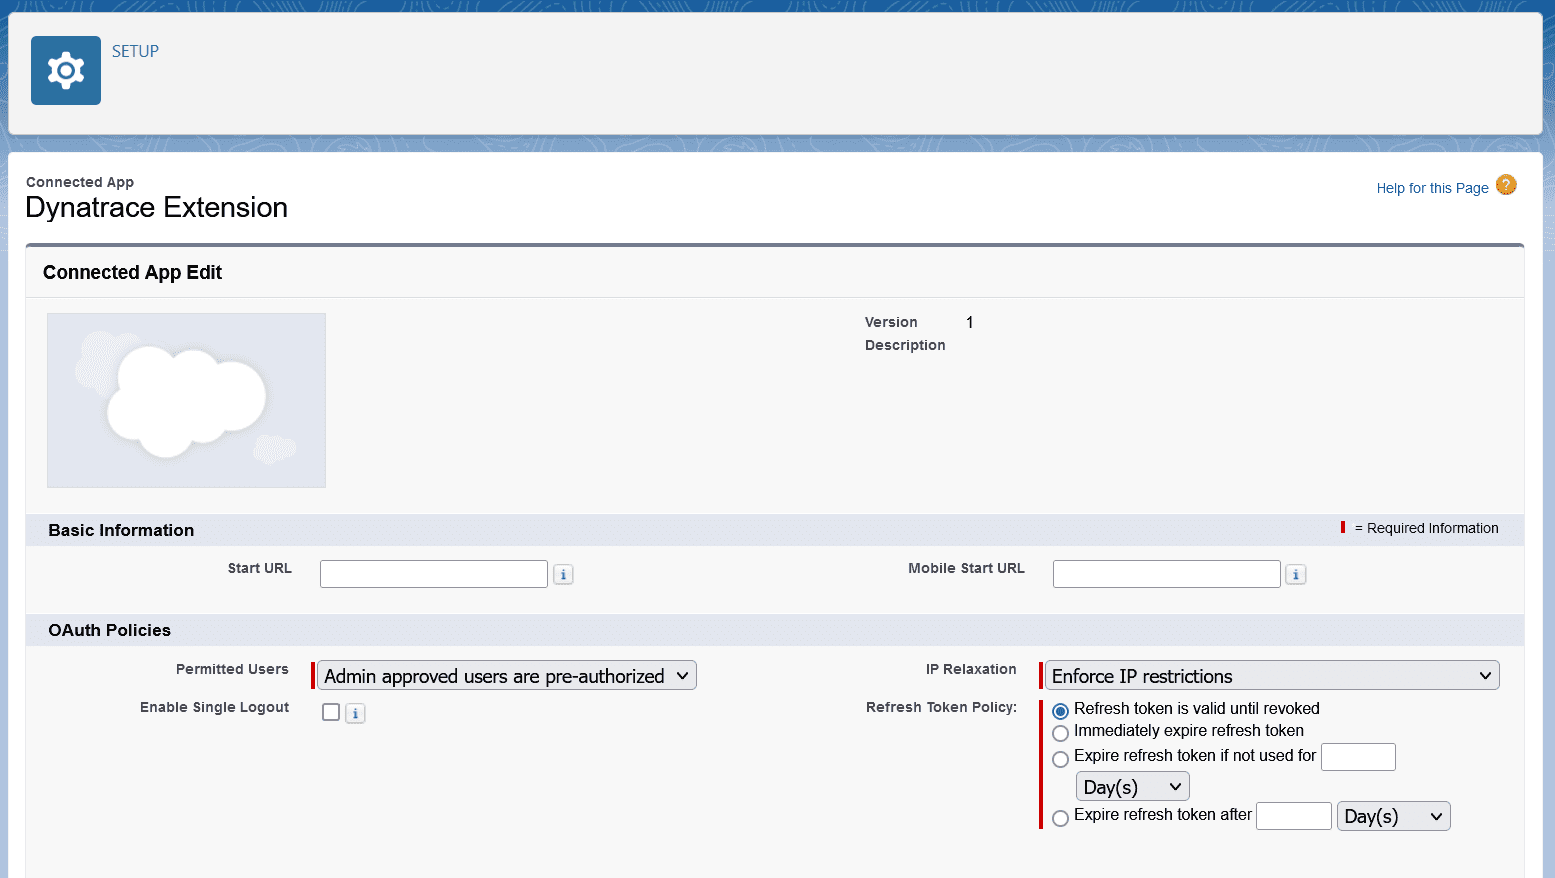
- For Connected App authentication, a Connected App with a pem certificate
- An Environment Activegate
Details
The extension uses the Salesforce Pub/Sub API to listen for Event Streaming Events.
These events are captured and sent as User Actions with all their respective properties sent as Action Properties. The event properties can be seen by
clicking on an User Action > Perform waterfall analysis
A detailed description of every event and their properties can be found on
the Salesforce documentation.
The current events being captured are:
Important
The extension is limited to events that Salesforce produces as Real Time Events.
Salesforce Account
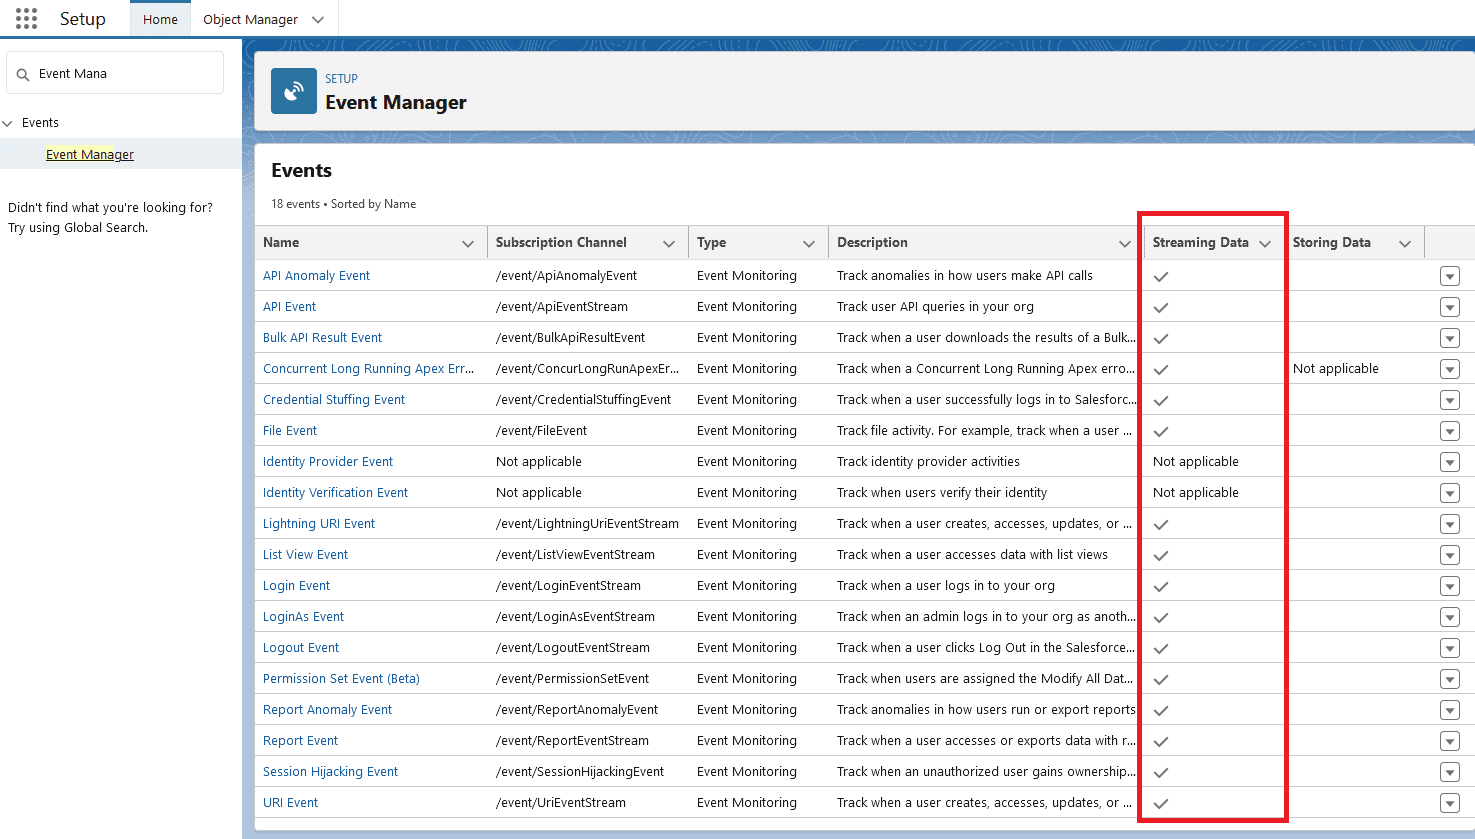
- Under
Setup -> Event Manager enable Streaming Data for the events you want to capture.
- Obtain the credentials needed for the extension to connect to Salesforce.
- For Username + Password authentication, check the User and Password Authentication section of this documentation
- For Connected App authentication, check the Connected App Authentication section of this documentation
Dynatrace
OpenKit Reporting
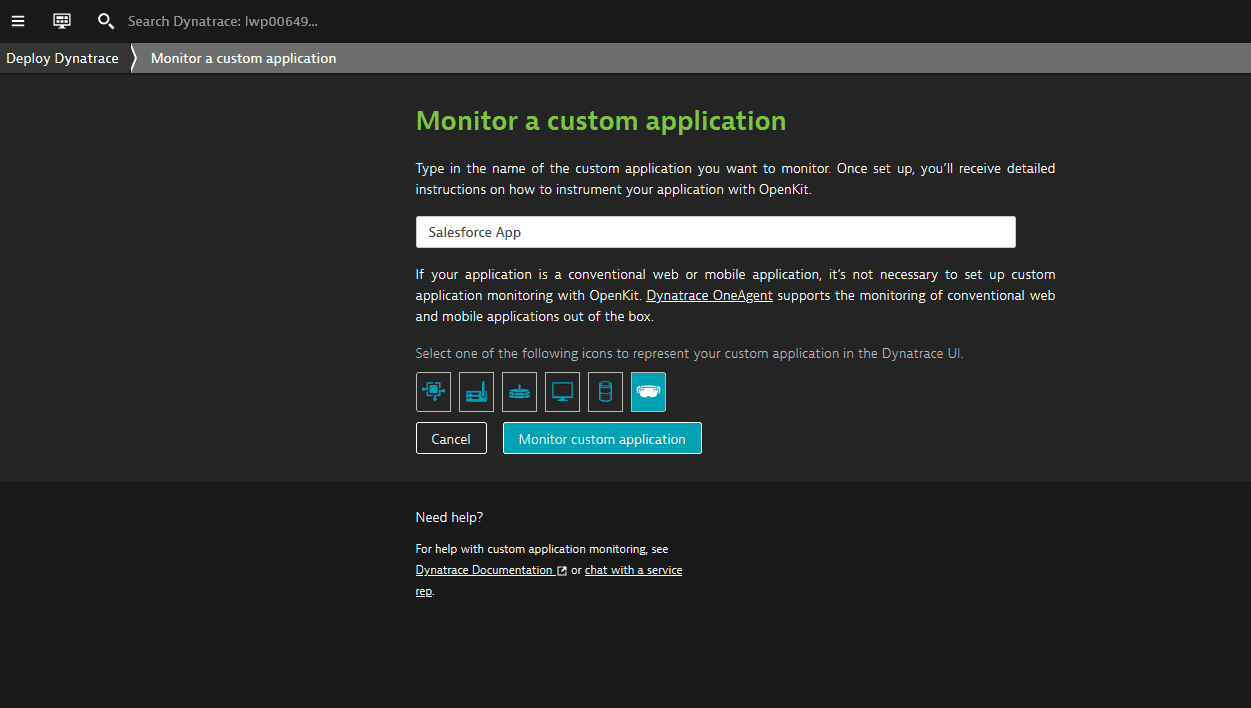
Create a Custom Application to receive the data:
- Navigate to
Digital Experiences -> Custom Applications -> Create custom application.
- Give it a name and an icon
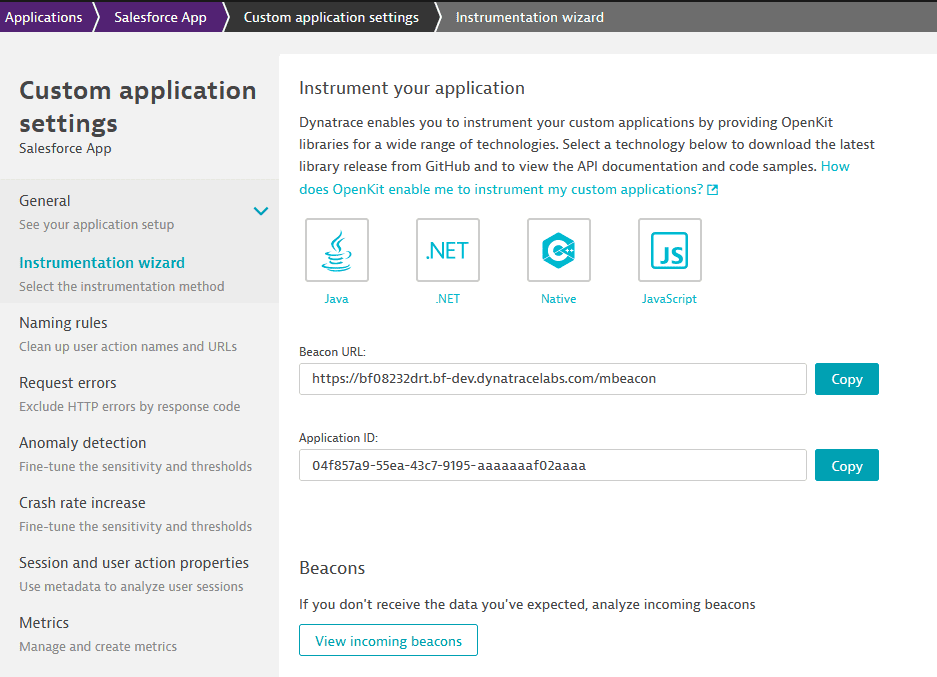
- Under the application settings, navigate to
Instrumentation Wizard and save the Application ID for later
Activate the extension:
- Navigate to the Dynatrace Hub and activate the extension.
- Create a monitoring configuration on the extension page.
- Select an Activegate group.
- One of these servers will need to access the salesforce API, which is on the internet.
- The login URLs are:
https://login.salesforce.com or https://test.salesforce.com
- The Pub Sub endpoints are:
api.pubsub.salesforce.com:7443 or api.deu.pubsub.salesforce.com:7443
- A proxy can be configured later if necessary.
The parameters for the monitoring configuration are:
| Parameter | Description |
|---|
| Endpoint name | A friendly name to identify the endpoint |
| Login URL | Chose from Production or Sandbox |
| Pub/Sub URL | Chose from Global Endpoint or Europe (Frankfurt) Endpoint |
| Reporting Mode | OpenKit or Business Events |
| Custom Application ID | The Dynatrace Custom Application ID for the app you created before |
| Authentication type | Choose from Username and Password or Connected App, see specific documentation below |
| Events filtering | Choose which real time events you'd like to send to Dynatrace, by default all are enabled |
| Usernames Blocklist | Optional list of Usernames to ignore, use this to block automation/api users from reporting |
| Proxy | Optional proxy, in case the Activegate cannot connect to the Salesforce URLs |
The data is sent to the Frontend Application that you created:
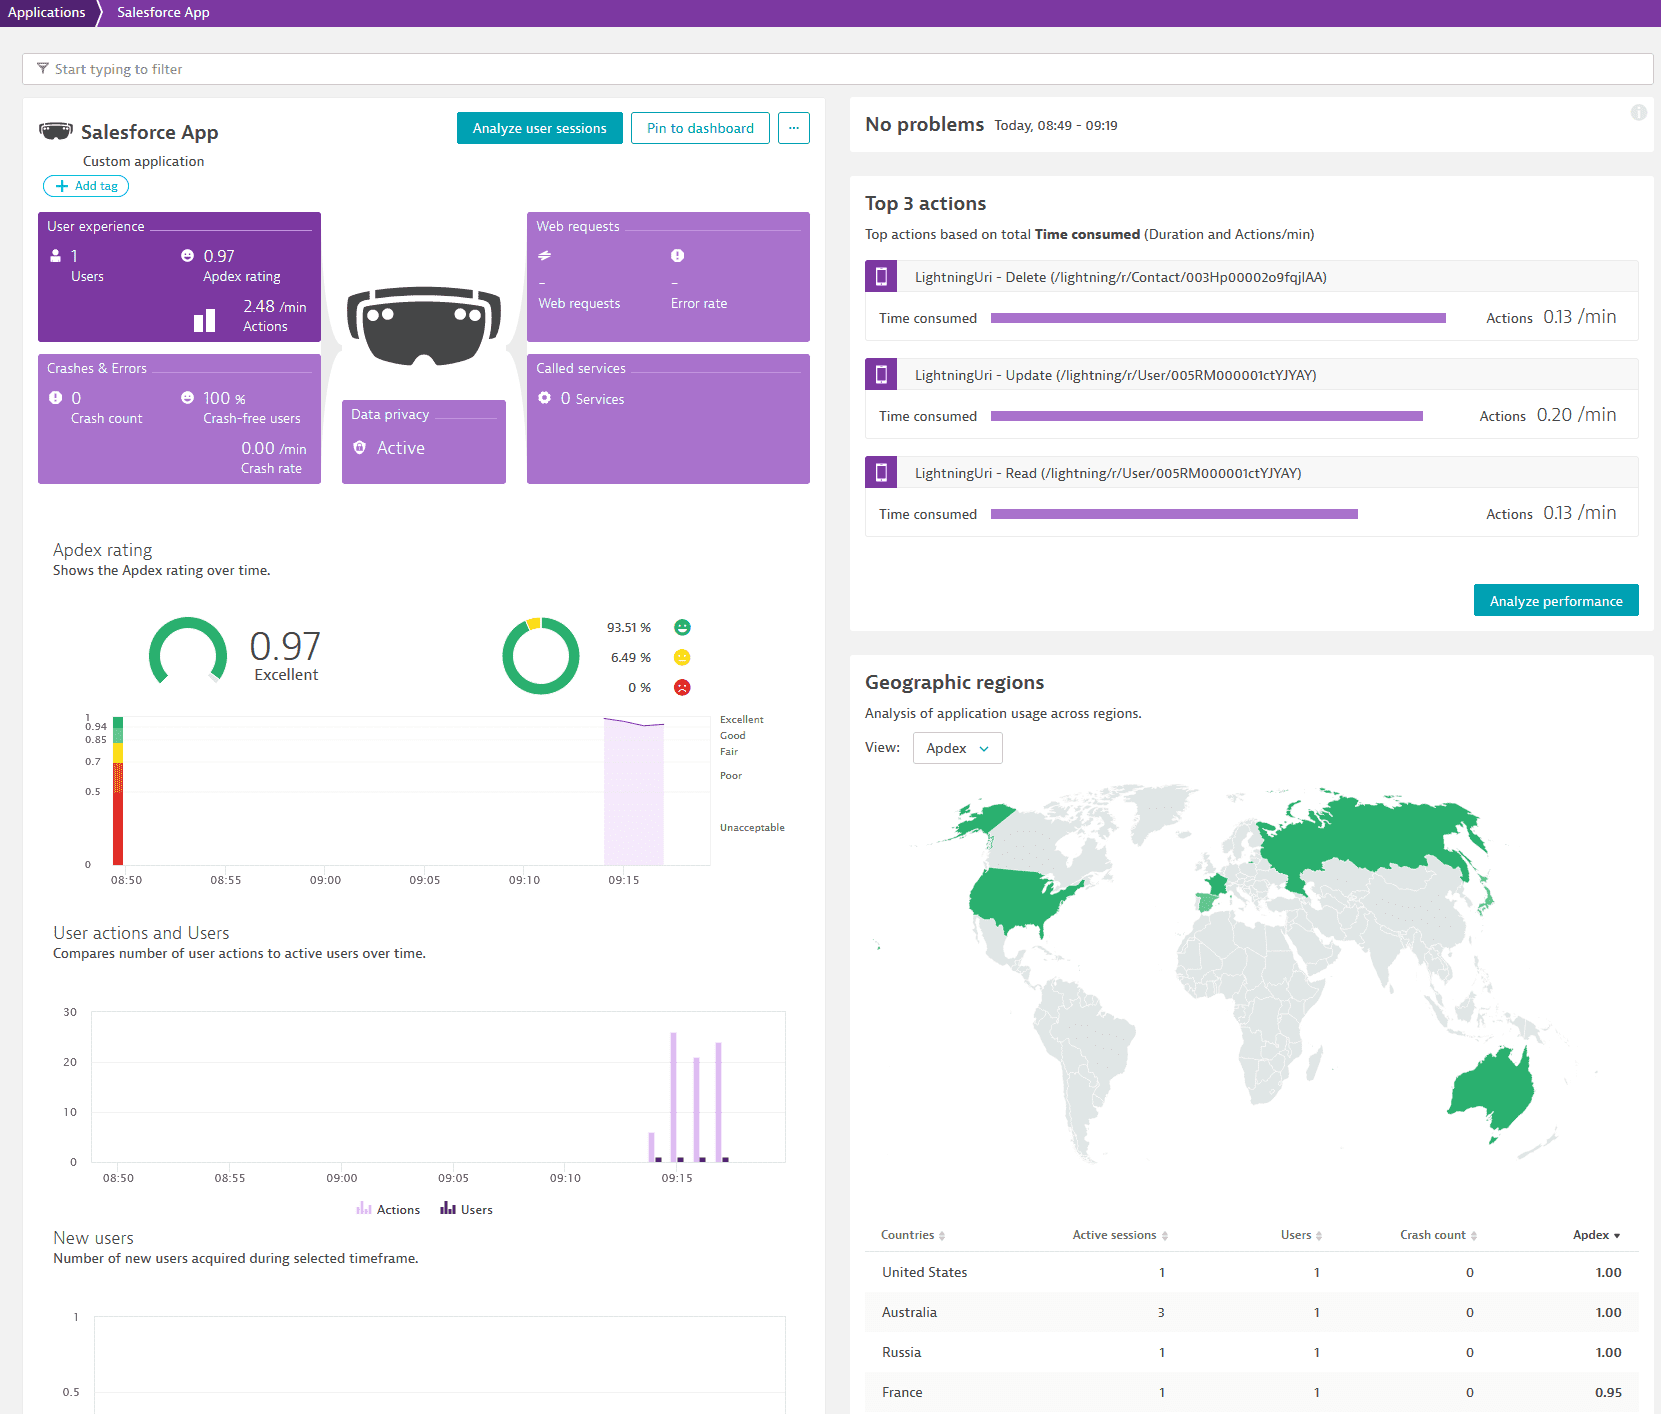
You can drill down to the Sessions:
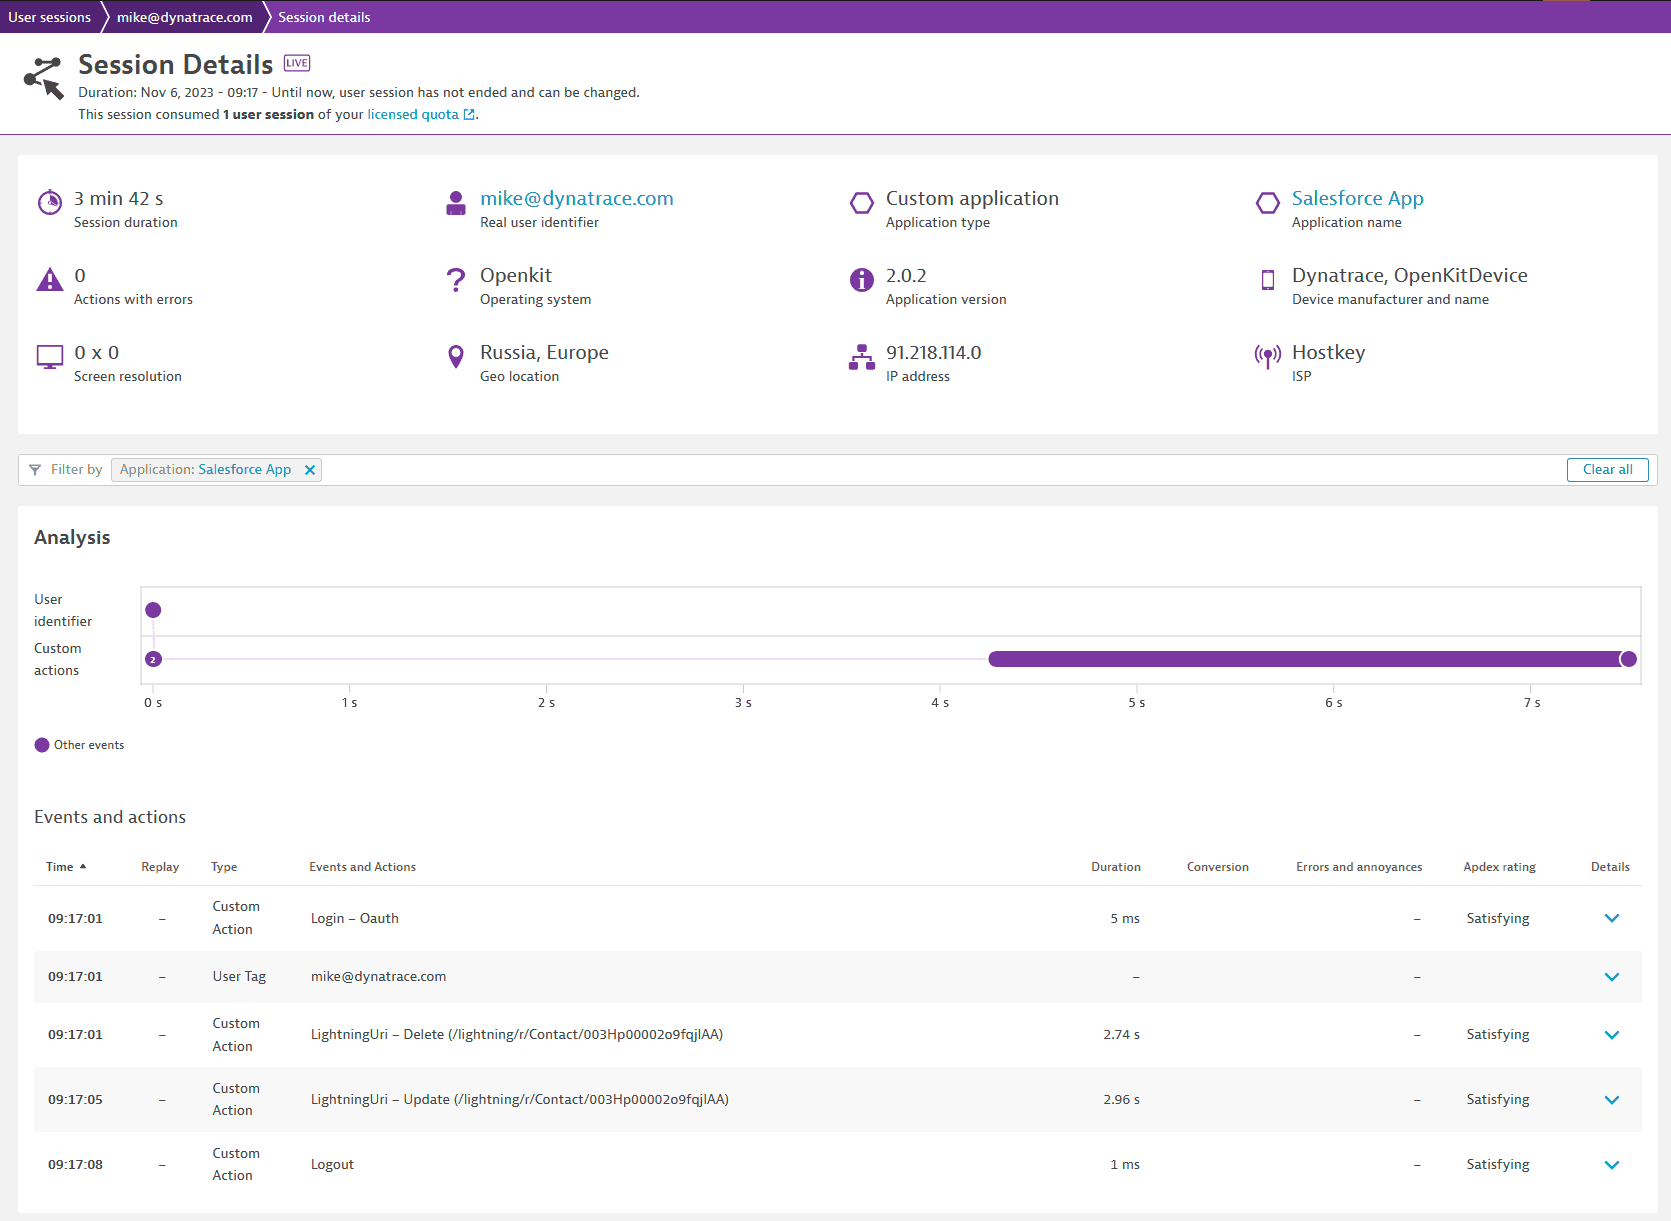
And to the individual properties, by clicking on the User Action > Perform waterfall analysis:
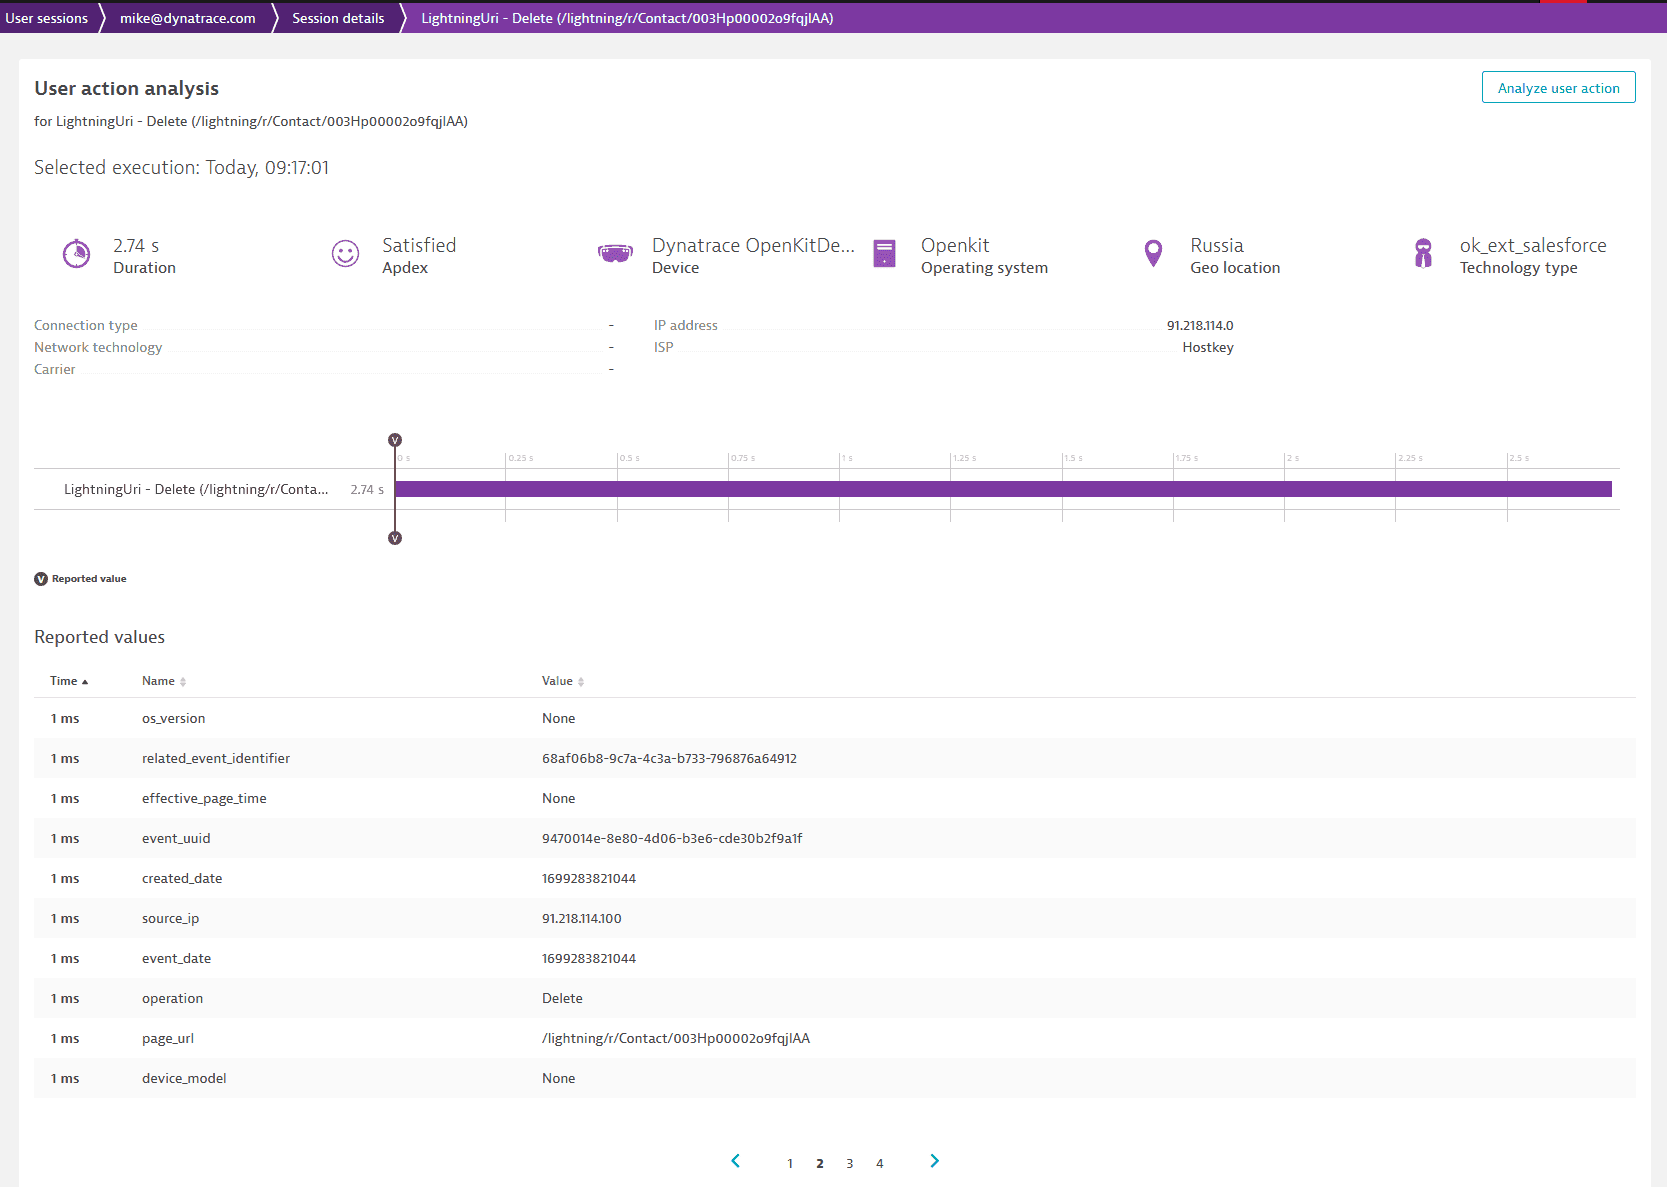 To use these properties in User Sessions Query Language:
- Under the application settings, navigate to
Session and user action properties
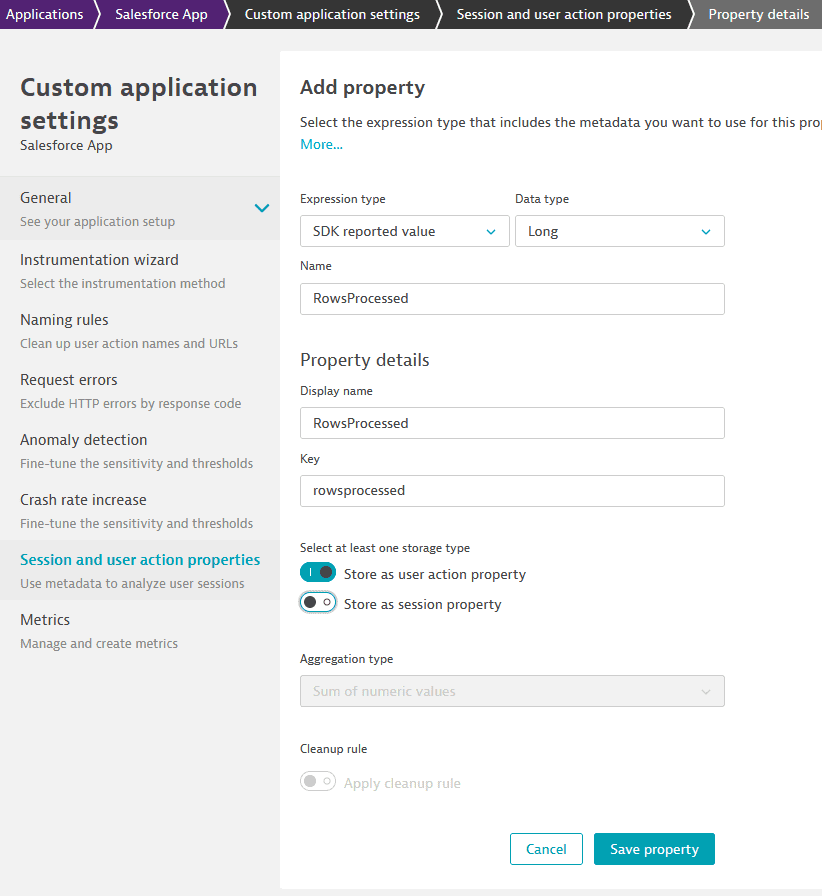
- Create a property. Note: the Name must match exactly the property name as documented in the Salesforce events.
Example: capturing the number of rows for a report:

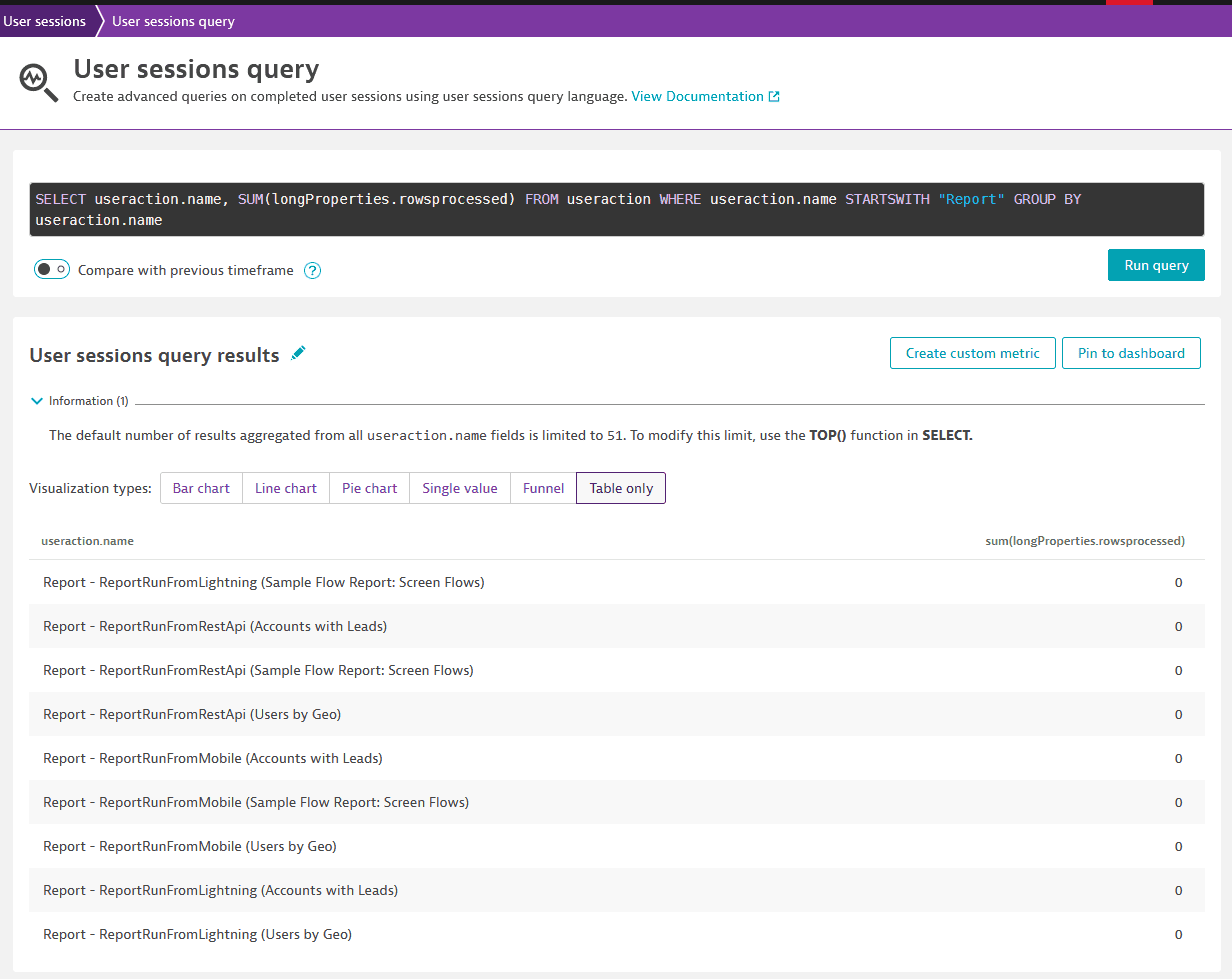
Querying the property:
SELECT useraction.name, SUM(longProperties.rowsprocessed) FROM useraction WHERE useraction.name STARTSWITH "Report" GROUP BY useraction.name

Business Events
For business events, all data is ingested using the business events API.
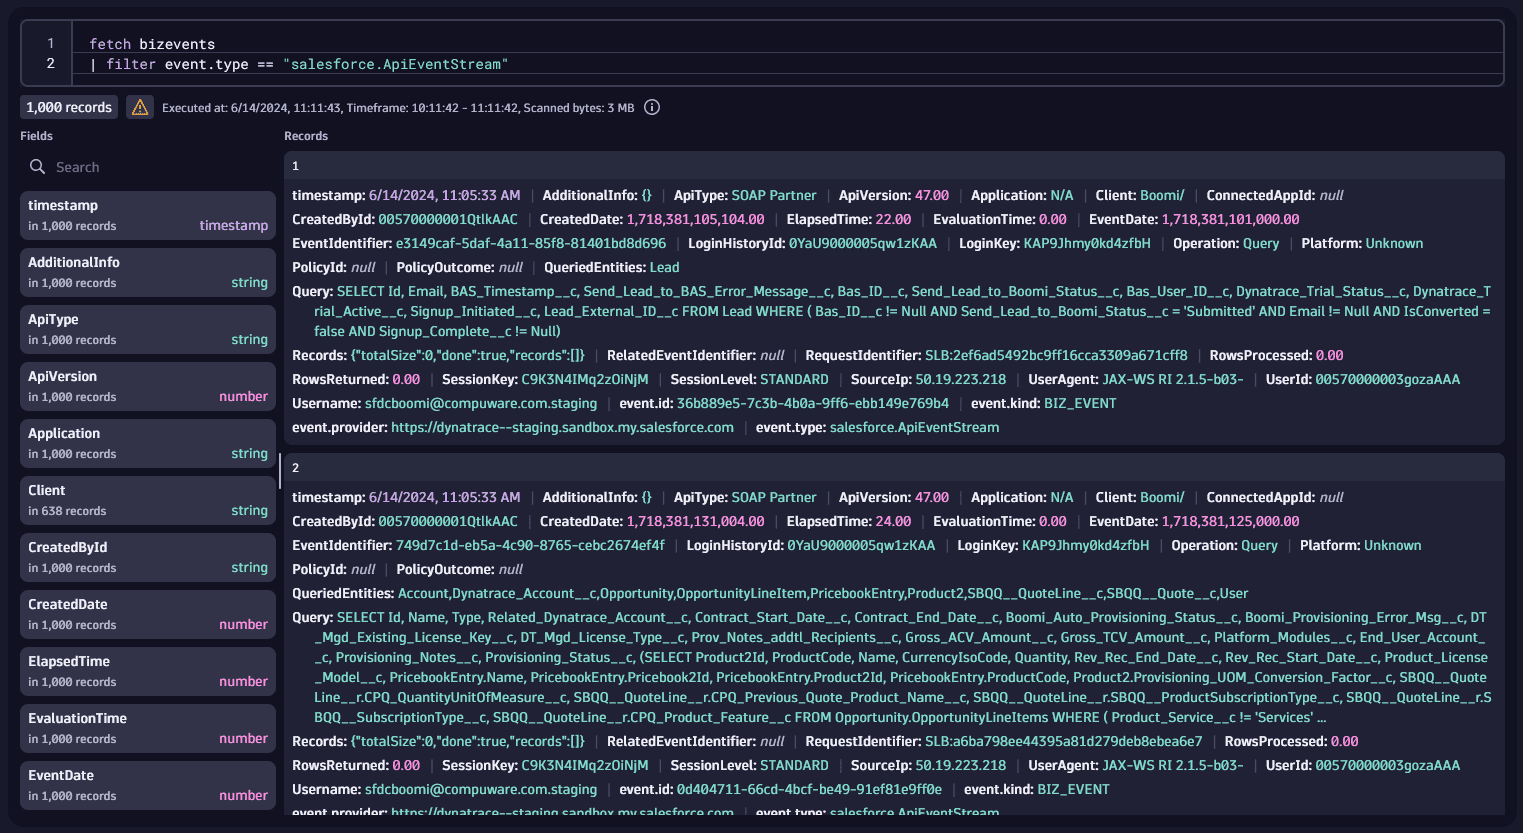
It can be queried using DQL:
fetch bizevents
| filter event.type == "salesforce.ApiEventStream"

Each of the events of type salesforce.NameOfTheEvent will have all properties documented by Salesforce.
For instance, these are the properties for an ApiEventStream
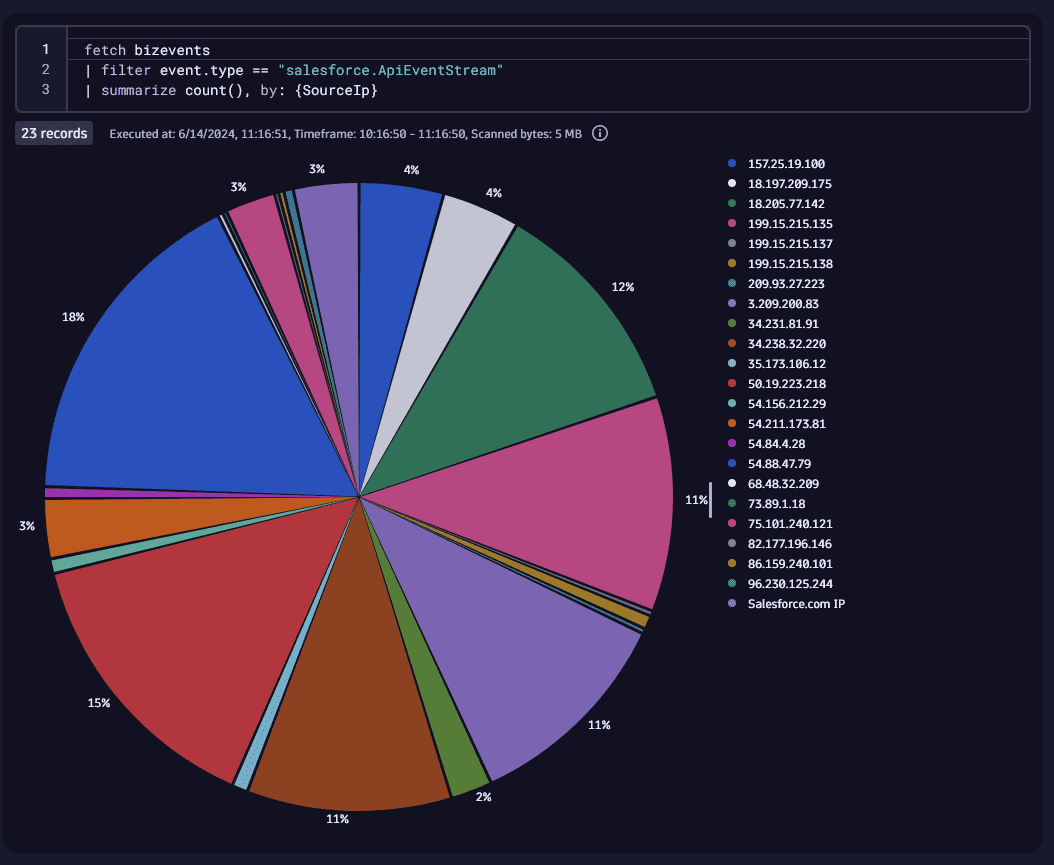
So we can create visualizations using all of these properties.
fetch bizevents
| filter event.type == "salesforce.ApiEventStream"
| summarize count(), by: {SourceIp}

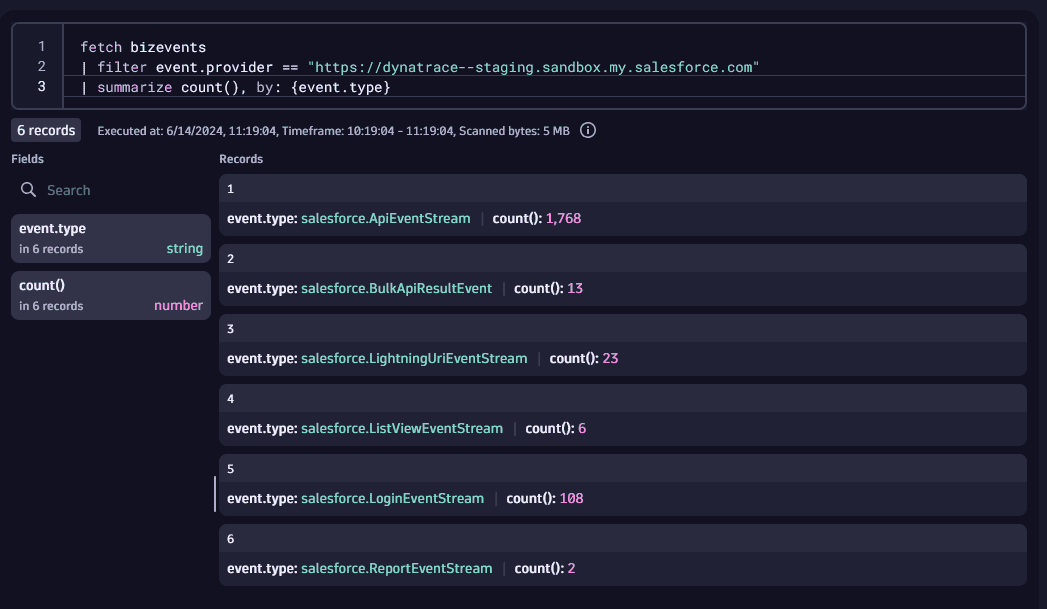
You can get a list of all event types with DQL:
fetch bizevents
| filter event.provider == "https://dynatrace--staging.sandbox.my.salesforce.com"
| summarize count(), by: {event.type}

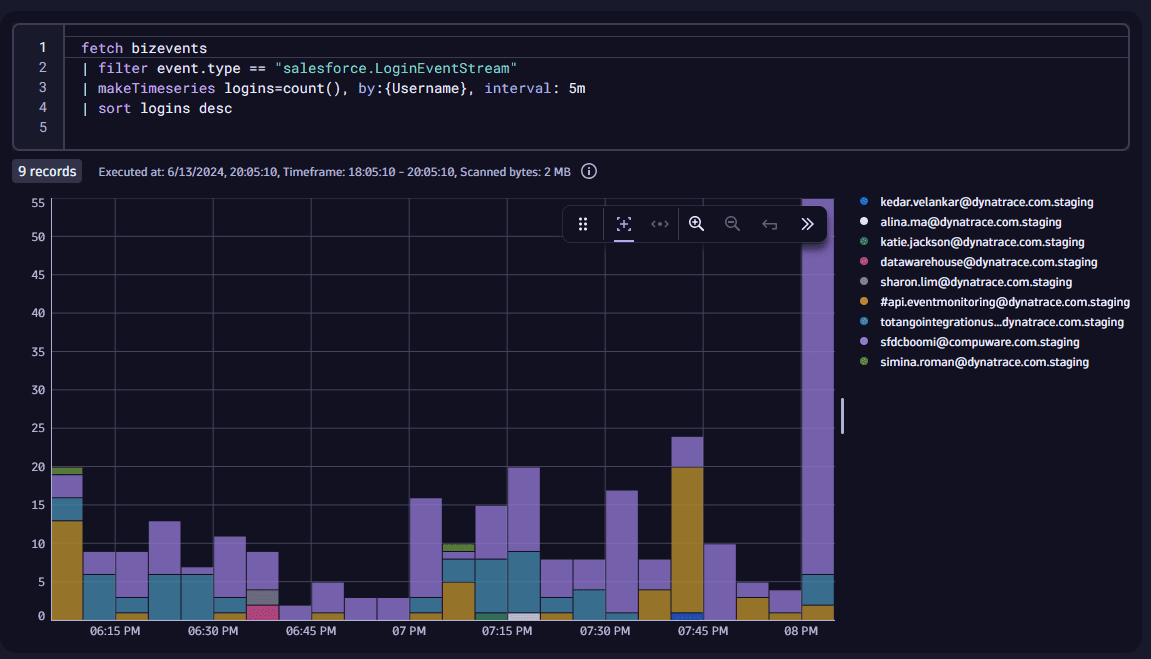
Example: Get Logins by User overtime
fetch bizevents
| filter event.type == "salesforce.LoginEventStream"
| makeTimeseries logins=count(), by:{Username}, interval: 5m
| sort logins desc








 To use these properties in