Troubleshoot monitoring interruptions
A monitoring interruption is a situation where the majority of your installed OneAgents lose their connection with the Dynatrace server and usually manifests itself as a lack of visibility in terms of both availability and performance monitoring.
This doesn't necessarily mean an outage of your servers though. In case of a monitoring interruption, Dynatrace automatically suppresses all Host unavailable problems and alerts you to the monitoring interruption. All hosts are set to the availability state Unmonitored for the duration of the monitoring outage. Monitoring interruption alerts do have a special severity filter within your alerting profiles. The Monitoring unavailable alert severity level allows you to create a filter and then deliver these highly critical alerts to your monitoring operations teams.
Monitoring interruptions can have different root causes depending on the type of Dynatrace deployment you're running. Dynatrace SaaS environments are administered by the Dynatrace DevOps team, who post all operational issues to dynatrace.status.io. For environments running in Dynatrace Managed deployments, it's most likely that the monitoring interruption is caused by an issue within your own data center or network configuration.
Read below for use-case-specific details.
Monitoring interruption in a single Dynatrace environment
This situation is detected whenever a single Dynatrace SaaS environment loses the connection to its OneAgents. As no other environments are affected on the same Dynatrace SaaS cluster, it's highly recommended that you check the following issues within your own network configuration:
- Check whether a recent change in your network or firewall configuration blocks the outgoing monitoring traffic of your OneAgents.
- In case you are routing OneAgent traffic through an ActiveGate, check the operational status of your ActiveGates.
- Finally, in case you don't find any network issues within your own data center, check dynatrace.status.io for a general issue in your region.
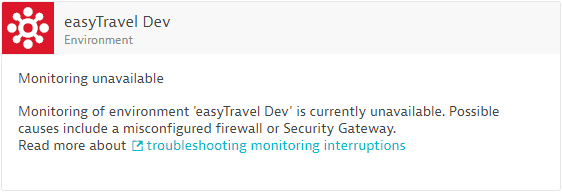
The following is an example alert for a monitoring interruption within a Dynatrace SaaS environment.

Monitoring unavailable alert detection
Monitoring unavailable status means that the Dynatrace server didn't receive the heartbeats of your monitored hosts for more than 3 minutes.
- Possible causes include network outages within your data centers, incorrect ActiveGate configuration, and incorrect firewall configuration.
- If the issue is resolved, the monitoring unavailable status should reset after 2 hours.
Monitoring interruption within a Dynatrace cluster
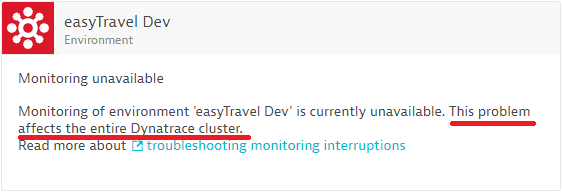
An alert is sent out to all affected monitoring environments within a Dynatrace SaaS cluster in case of a general interruption of OneAgent communication. The alert message states that the issue affects the complete Dynatrace cluster and isn't limited to your own environment. As the SaaS clusters within different regions are operated by the Dynatrace DevOps team, you can check the status of your own SaaS region on dynatrace.status.io.
The following is an example alert for a monitoring interruption on a Dynatrace SaaS region.
