Amazon CloudWatch Logs monitoring
Dynatrace ingests metrics for multiple preselected namespaces, including Amazon CloudWatch Logs. You can view metrics for each service instance, split metrics into multiple dimensions, and create custom charts that you can pin to your dashboards.
Prerequisites
To enable monitoring for this service, you need
- ActiveGate version 1.197+
- For Dynatrace SaaS deployments, you need an Environment ActiveGate or a Multi-environment ActiveGate.
For role-based access in a SaaS deployment, you need an Environment ActiveGate installed on an Amazon EC2 host.
-
Dynatrace version 1.201+
-
An updated AWS monitoring policy to include the additional AWS services.
To update the AWS IAM policy, use the JSON below, containing the monitoring policy (permissions) for all supporting services.
{"Version": "2012-10-17","Statement": [{"Sid": "VisualEditor0","Effect": "Allow","Action": ["acm-pca:ListCertificateAuthorities","apigateway:GET","apprunner:ListServices","appstream:DescribeFleets","appsync:ListGraphqlApis","athena:ListWorkGroups","autoscaling:DescribeAutoScalingGroups","cloudformation:ListStackResources","cloudfront:ListDistributions","cloudhsm:DescribeClusters","cloudsearch:DescribeDomains","cloudwatch:GetMetricData","cloudwatch:GetMetricStatistics","cloudwatch:ListMetrics","codebuild:ListProjects","datasync:ListTasks","dax:DescribeClusters","directconnect:DescribeConnections","dms:DescribeReplicationInstances","dynamodb:ListTables","dynamodb:ListTagsOfResource","ec2:DescribeAvailabilityZones","ec2:DescribeInstances","ec2:DescribeNatGateways","ec2:DescribeSpotFleetRequests","ec2:DescribeTransitGateways","ec2:DescribeVolumes","ec2:DescribeVpnConnections","ecs:ListClusters","eks:ListClusters","elasticache:DescribeCacheClusters","elasticbeanstalk:DescribeEnvironmentResources","elasticbeanstalk:DescribeEnvironments","elasticfilesystem:DescribeFileSystems","elasticloadbalancing:DescribeInstanceHealth","elasticloadbalancing:DescribeListeners","elasticloadbalancing:DescribeLoadBalancers","elasticloadbalancing:DescribeRules","elasticloadbalancing:DescribeTags","elasticloadbalancing:DescribeTargetHealth","elasticmapreduce:ListClusters","elastictranscoder:ListPipelines","es:ListDomainNames","events:ListEventBuses","firehose:ListDeliveryStreams","fsx:DescribeFileSystems","gamelift:ListFleets","glue:GetJobs","inspector:ListAssessmentTemplates","kafka:ListClusters","kinesis:ListStreams","kinesisanalytics:ListApplications","kinesisvideo:ListStreams","lambda:ListFunctions","lambda:ListTags","lex:GetBots","logs:DescribeLogGroups","mediaconnect:ListFlows","mediaconvert:DescribeEndpoints","mediapackage-vod:ListPackagingConfigurations","mediapackage:ListChannels","mediatailor:ListPlaybackConfigurations","opsworks:DescribeStacks","qldb:ListLedgers","rds:DescribeDBClusters","rds:DescribeDBInstances","rds:DescribeEvents","rds:ListTagsForResource","redshift:DescribeClusters","robomaker:ListSimulationJobs","route53:ListHostedZones","route53resolver:ListResolverEndpoints","s3:ListAllMyBuckets","sagemaker:ListEndpoints","sns:ListTopics","sqs:ListQueues","storagegateway:ListGateways","sts:GetCallerIdentity","swf:ListDomains","tag:GetResources","tag:GetTagKeys","transfer:ListServers","workmail:ListOrganizations","workspaces:DescribeWorkspaces"],"Resource": "*"}]}
If you don't want to add permissions to all services, and just select permissions for certain services, consult the table below. The table contains a set of permissions that are required for All AWS cloud services and, for each supporting service, a list of optional permissions specific to that service.
"cloudwatch:GetMetricData""cloudwatch:GetMetricStatistics""cloudwatch:ListMetrics""sts:GetCallerIdentity""tag:GetResources""tag:GetTagKeys""ec2:DescribeAvailabilityZones"
cloudwatch:GetMetricData,cloudwatch:GetMetricStatistics,cloudwatch:ListMetrics,sts:GetCallerIdentity,tag:GetResources,tag:GetTagKeys,ec2:DescribeAvailabilityZonesacm-pca:ListCertificateAuthoritiesapigateway:GETapprunner:ListServicesappstream:DescribeFleetsappsync:ListGraphqlApisathena:ListWorkGroupsrds:DescribeDBClustersautoscaling:DescribeAutoScalingGroupsautoscaling:DescribeAutoScalingGroupscloudfront:ListDistributionscloudhsm:DescribeClusterscloudsearch:DescribeDomainscodebuild:ListProjectseks:ListClustersdatasync:ListTasksdax:DescribeClustersdms:DescribeReplicationInstancesrds:DescribeDBClustersdirectconnect:DescribeConnectionsdynamodb:ListTablesdynamodb:ListTables,dynamodb:ListTagsOfResourceec2:DescribeVolumesec2:DescribeVolumesec2:DescribeInstancesec2:DescribeSpotFleetRequestsecs:ListClustersecs:ListClusterselasticache:DescribeCacheClusterselasticbeanstalk:DescribeEnvironmentselasticfilesystem:DescribeFileSystemselasticmapreduce:ListClusterses:ListDomainNameselastictranscoder:ListPipelineselasticloadbalancing:DescribeInstanceHealth,elasticloadbalancing:DescribeListeners,elasticloadbalancing:DescribeLoadBalancers,elasticloadbalancing:DescribeRules,elasticloadbalancing:DescribeTags,elasticloadbalancing:DescribeTargetHealthevents:ListEventBusesfsx:DescribeFileSystemsgamelift:ListFleetsglue:GetJobsinspector:ListAssessmentTemplateskafka:ListClusterskinesisanalytics:ListApplicationsfirehose:ListDeliveryStreamskinesis:ListStreamskinesisvideo:ListStreamslambda:ListFunctionslambda:ListFunctions,lambda:ListTagslex:GetBotselasticloadbalancing:DescribeInstanceHealth,elasticloadbalancing:DescribeListeners,elasticloadbalancing:DescribeLoadBalancers,elasticloadbalancing:DescribeRules,elasticloadbalancing:DescribeTags,elasticloadbalancing:DescribeTargetHealthlogs:DescribeLogGroupsmediaconnect:ListFlowsmediaconvert:DescribeEndpointsExample of JSON policy for one single service.
{"Version": "2012-10-17","Statement": [{"Sid": "VisualEditor0","Effect": "Allow","Action": ["apigateway:GET","cloudwatch:GetMetricData","cloudwatch:GetMetricStatistics","cloudwatch:ListMetrics","sts:GetCallerIdentity","tag:GetResources","tag:GetTagKeys","ec2:DescribeAvailabilityZones"],"Resource": "*"}]}
In this example, from the complete list of permissions you need to select
"apigateway:GET"for Amazon API Gateway"cloudwatch:GetMetricData","cloudwatch:GetMetricStatistics","cloudwatch:ListMetrics","sts:GetCallerIdentity","tag:GetResources","tag:GetTagKeys", and"ec2:DescribeAvailabilityZones"for All AWS cloud services.
autoscaling.<REGION>.amazonaws.comlambda.<REGION>.amazonaws.comelasticloadbalancing.<REGION>.amazonaws.comdynamodb.<REGION>.amazonaws.comec2.<REGION>.amazonaws.comrds.<REGION>.amazonaws.coms3.<REGION>.amazonaws.comacm-pca.<REGION>.amazonaws.comapigateway.<REGION>.amazonaws.comapprunner.<REGION>.amazonaws.comappstream2.<REGION>.amazonaws.comappsync.<REGION>.amazonaws.comathena.<REGION>.amazonaws.comcloudfront.amazonaws.comcloudhsmv2.<REGION>.amazonaws.comcloudsearch.<REGION>.amazonaws.comcodebuild.<REGION>.amazonaws.comdatasync.<REGION>.amazonaws.comdax.<REGION>.amazonaws.comdms.<REGION>.amazonaws.comdirectconnect.<REGION>.amazonaws.comecs.<REGION>.amazonaws.comelasticfilesystem.<REGION>.amazonaws.comeks.<REGION>.amazonaws.comelasticache.<REGION>.amazonaws.comelasticbeanstalk.<REGION>.amazonaws.comEnable monitoring
To learn how to enable service monitoring, see Enable service monitoring.
View service metrics
You can view the service metrics in your Dynatrace environment either on the custom device overview page or on your Dashboards page.
View metrics on the custom device overview page
To access the custom device overview page
- Go to Technologies & Processes or Technologies & Processes Classic (latest Dynatrace).
- Filter by service name and select the relevant custom device group.
- Once you select the custom device group, you're on the custom device group overview page.
- The custom device group overview page lists all instances (custom devices) belonging to the group. Select an instance to view the custom device overview page.
View metrics on your dashboard
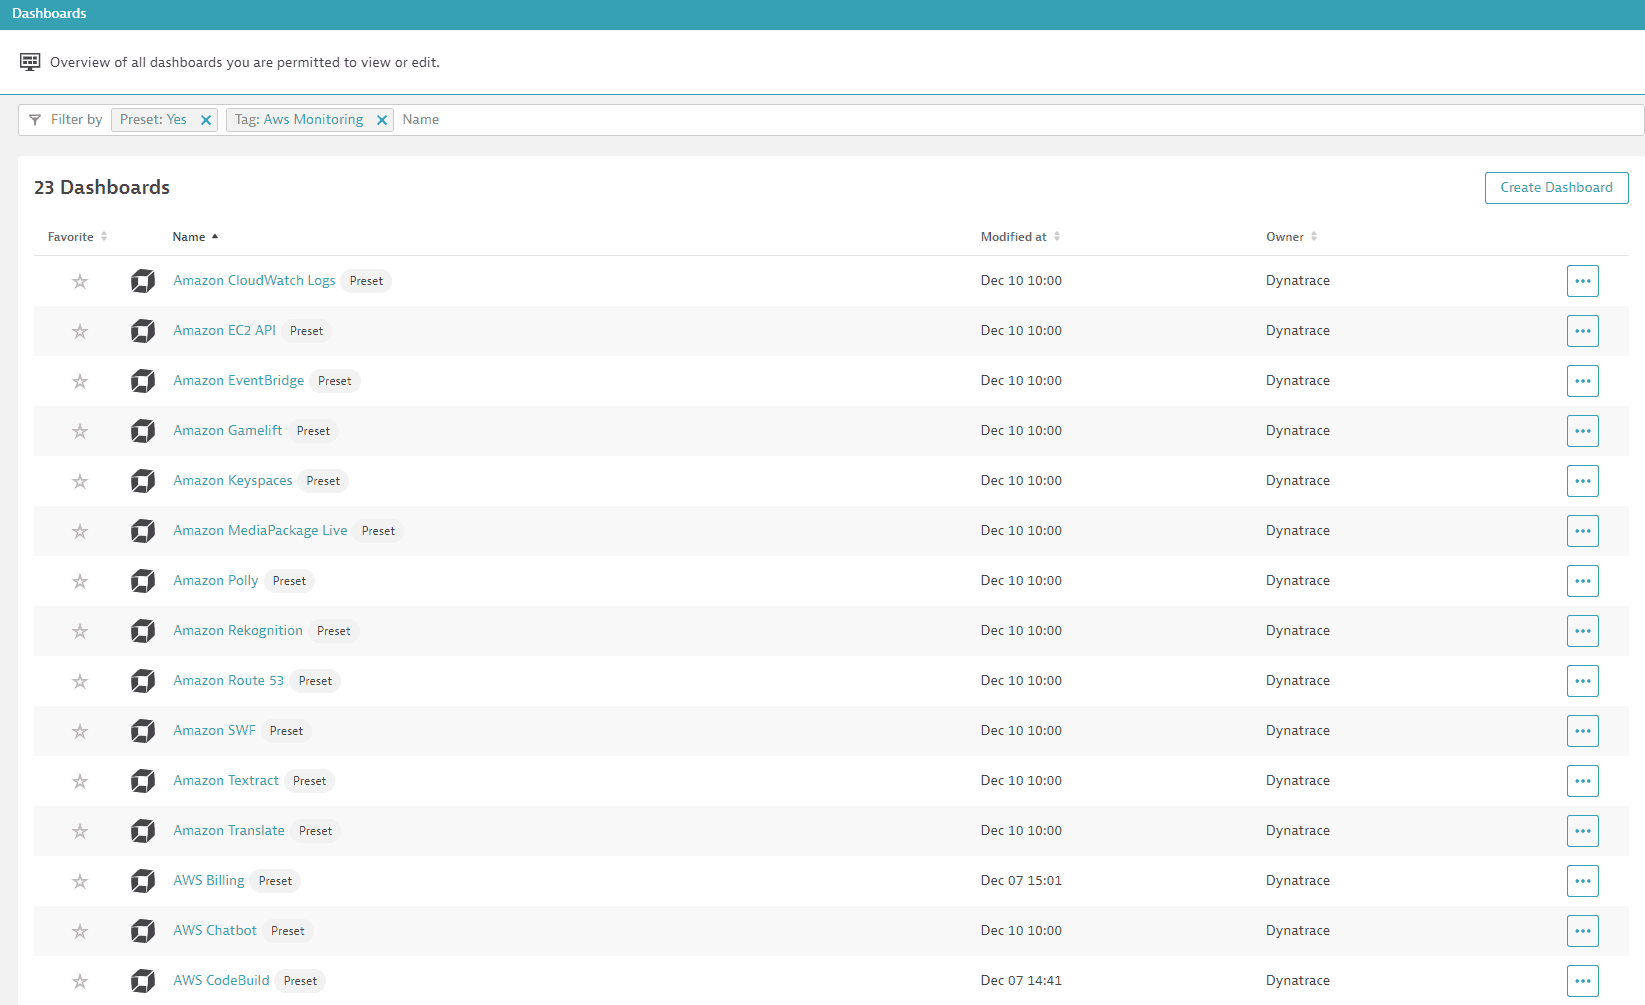
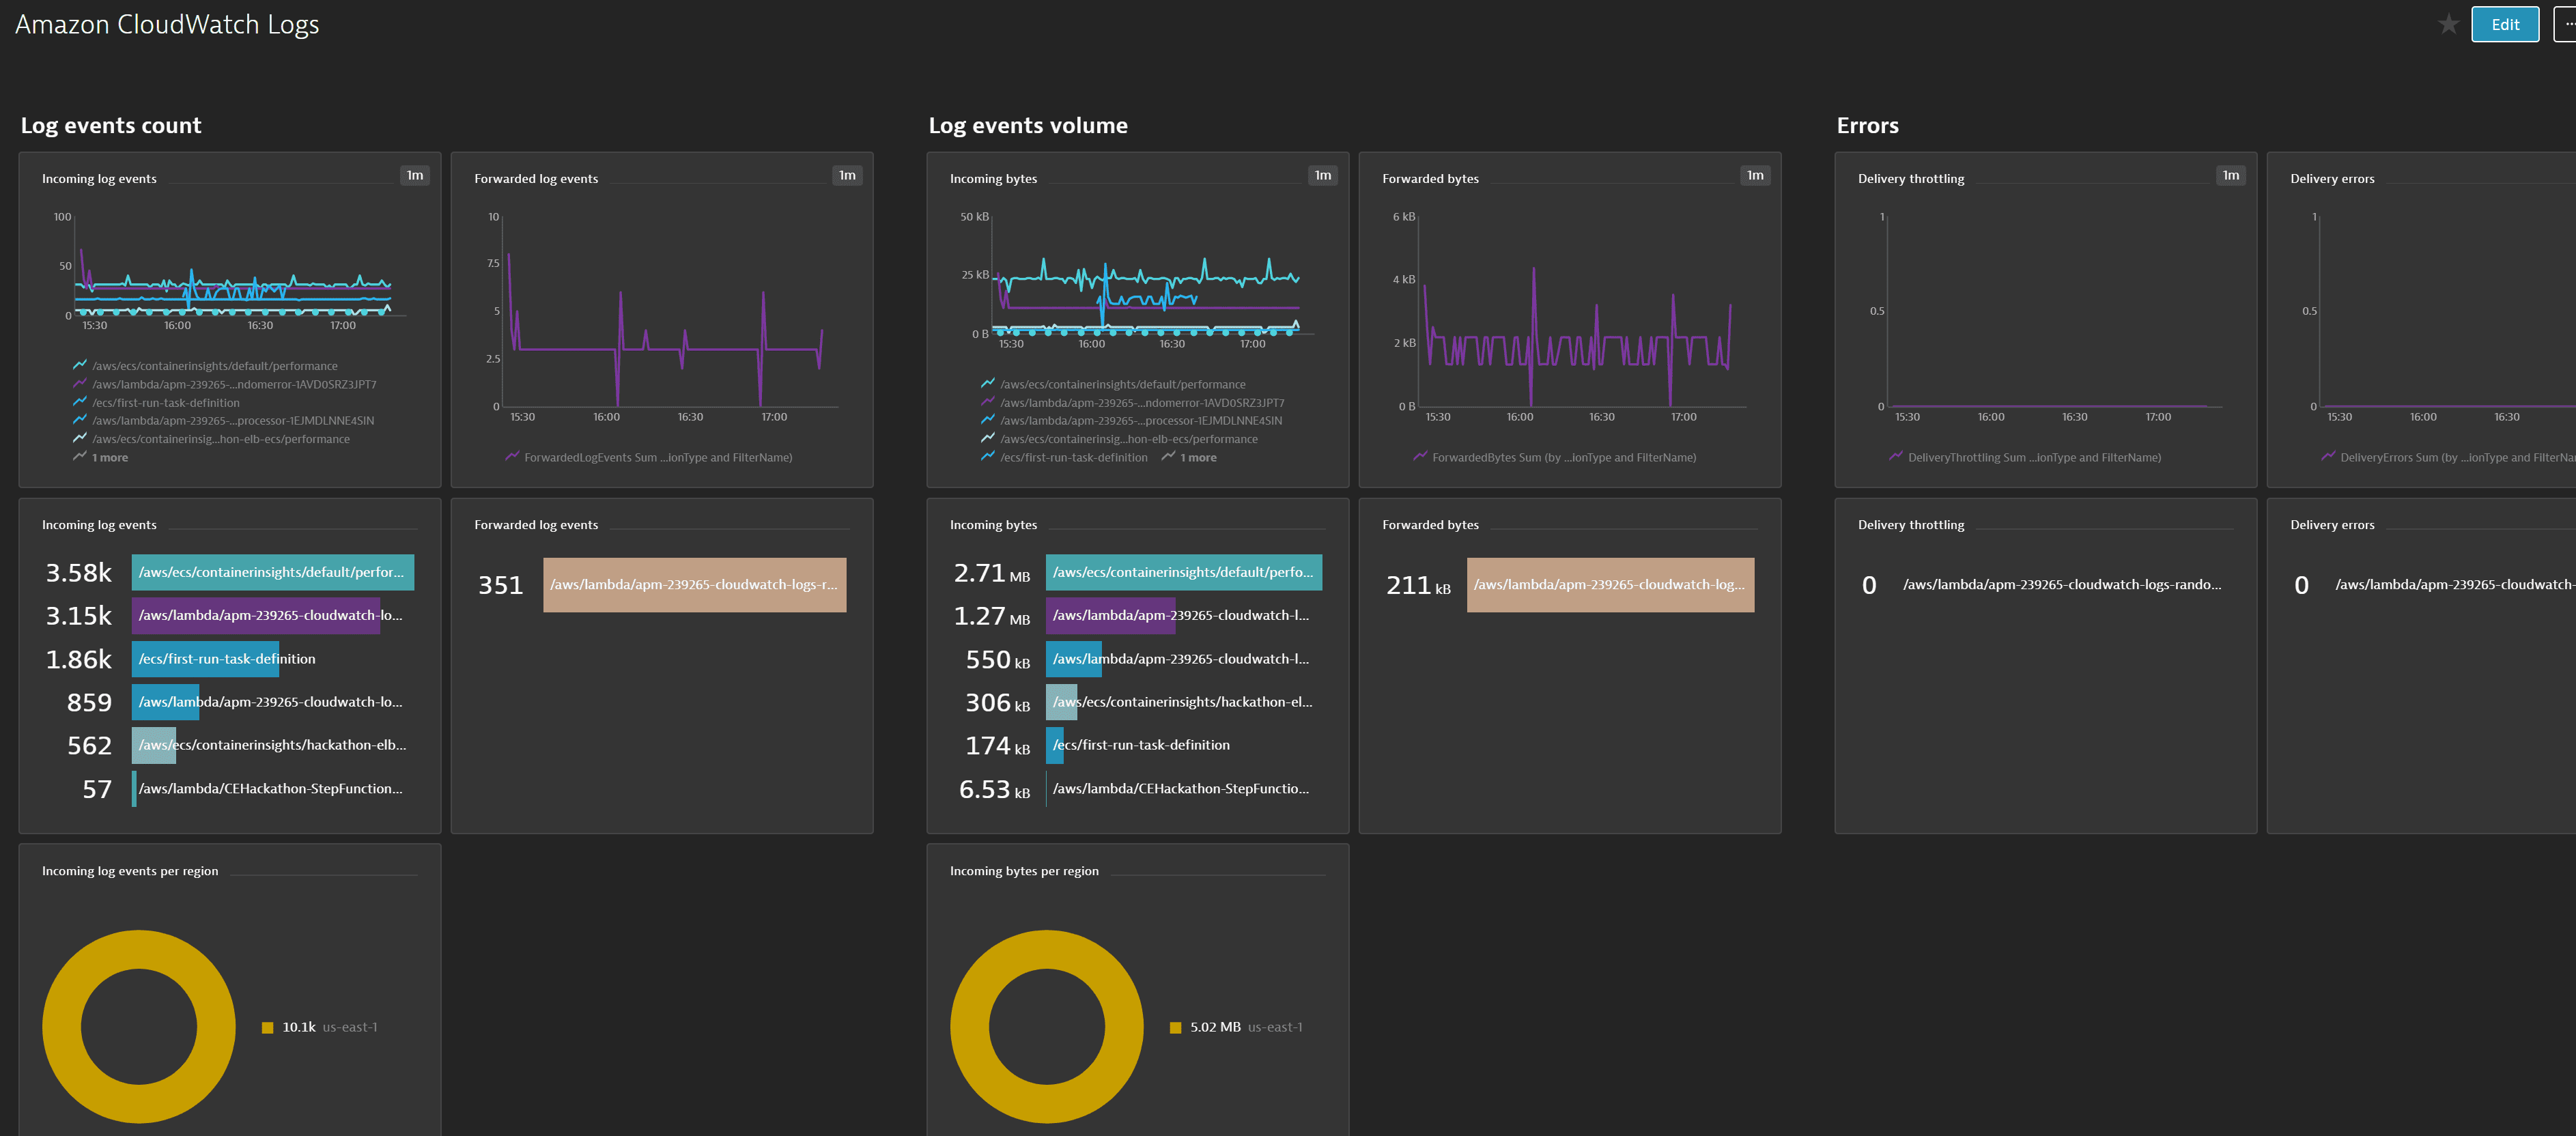
After you add the service to monitoring, a preset dashboard containing all recommended metrics is automatically listed on your Dashboards page. To look for specific dashboards, filter by Preset and then by Name.

For existing monitored services, you might need to resave your credentials for the preset dashboard to appear on the Dashboards page. To resave your credentials, go to Settings > Cloud and virtualization > AWS, select the desired AWS instance, and then select Save.
You can't make changes on a preset dashboard directly, but you can clone and edit it. To clone a dashboard, open the browse menu (…) and select Clone.
To remove a dashboard from the dashboards page, you can hide it. To hide a dashboard, open the browse menu (…) and select Hide.
Hiding a dashboard doesn't affect other users.

To check the availability of preset dashboards for each AWS service, see the list below.

Available metrics
LogGroupName is the main dimension.
LogGroupName dimension, this is the volume of log events in uncompressed bytes uploaded to the log group.LogGroupName dimension, this is the number of log events uploaded to the log group.