SNMP traps data source
SNMP traps are a standard way to notify your network central management of significant issues and events in your network infrastructure.
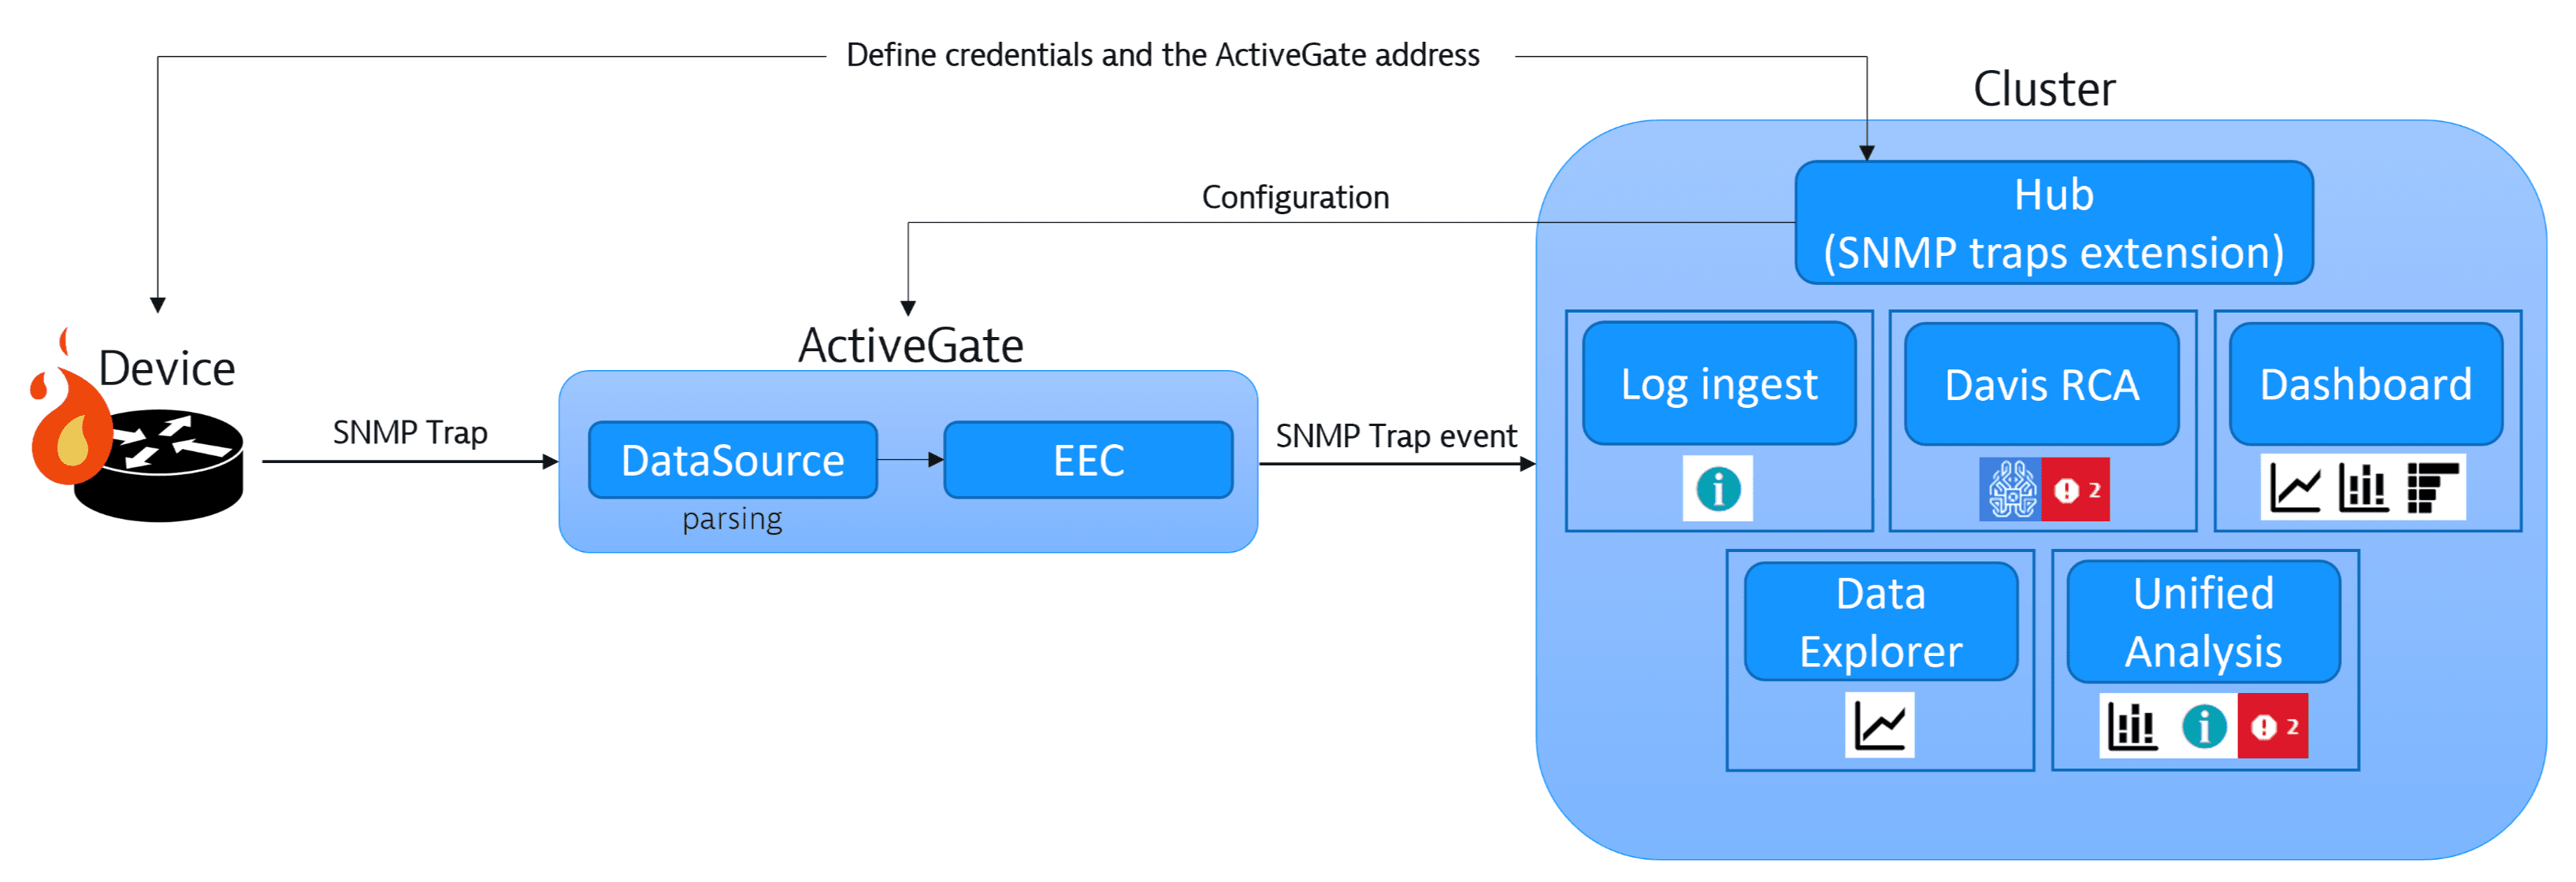
Dynatrace provides you with a framework to extend your insights into data related to SNMP traps issued in your infrastructure and forward the trap messages issued by your SNMP devices as log events.
We assume the following:
- Your devices are capable of issuing SNMP traps
- You know how to configure those devices to send traps and have the authority to do so
- You're familiar with Extensions 2.0 basic concepts and the general structure of the extension YAML file.

Prerequisites and support
Learn the prerequisites and scope of the supported technologies. For limits applying to your extension, see Extensions 2.0 limits.
Supported Dynatrace versions
- Dynatrace version 1.236+
- ActiveGate version 1.235+
- Log Monitoring v1 isn't supported
Supported SNMP versions
- SNMPv2c and earlier
- SNMPv3 ActiveGate version 1.251+
Hardware requirements
If a large number of traps is sent, it is possible that many of them may be dropped by the operating system. The same situation occurs when the limit with logs is reached
These are values for EEC in default performance profile
Instance
CPU
Mem (MiB)
Estimated number of traps
Estimated number of traps for SNMPv3
c5.large
5%
45 MiB
30k/min (logs enabled)
45k/min (logs disabled)
17k/min (logs enabled)
32k/min (logs disabled)
These are values for EEC set in high performance profile
Instance
CPU
Mem (MiB)
Estimated number of traps
Estimated number of traps for SNMPv3
c5.large
15%
45 MiB
75k/min (logs enabled)
150k/min (logs disabled)
60k/min (logs enabled)
105k/min (logs disabled)
Supported authentication
SNMP v2c and earlier
Community strings.
SNMP v3
For SNMP v3, the SNMP traps data source supports the NoAuthNoPriv, authNoPriv, and authPriv security levels and the following authentication protocols:
authNoPriv
authPriv
These encryption algorithms are not officially specified, but they are often supported by network devices. See SNMPv3 with AES-256.
See the Authentication section to learn how to define authentication in your monitoring configuration.
Supported messages
The SNMP traps data source supports only SNMP traps. SNMP inform requests aren't supported.
Events
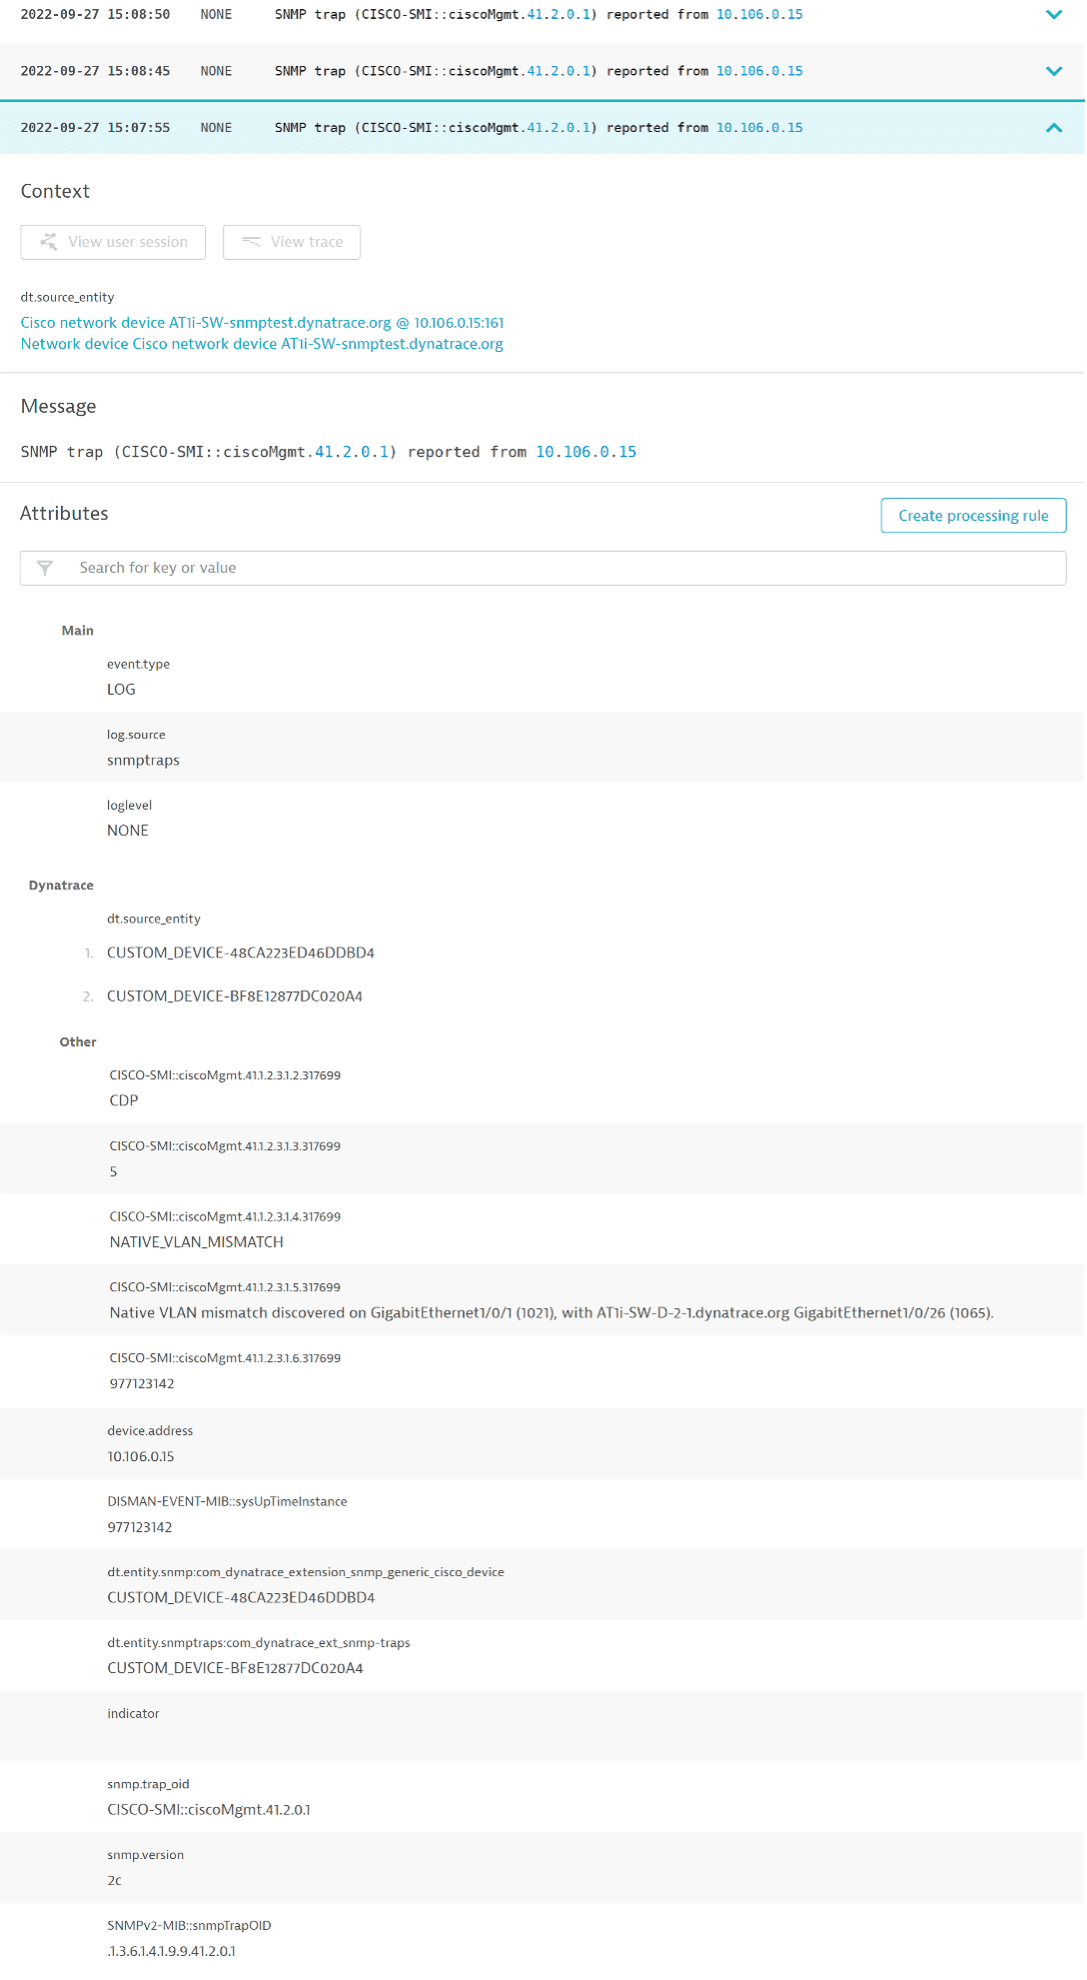
Trap events send detailed information about each trap to the log ingest. The trap message contains the following information:
Context
The entity for which the log event is accounted. The device IP and the OID are translated to a human-readable form using MIB files.
Message
The actual trap message with the trap type.
Attributes
Attributes passed to the log event.
Main
event.type—always set toLOGlog.source—always set tosnmptrapsloglevel—always set toNONEsnmp.version—always set to1,2c, or3
Dynatrace
Dynatrace topological properties.
dt.source_entity—the ID of the device (entity) for which the log event is accounted.
Other
All variable bindings reported with the trap message and extension-defined variables are added as log event attributes (for example, device.address and snmp.trap_oid).
For more information about custom log attributes and log processing rules, see:
Enable trap events
Select the Events feature set to enable forwarding trap events to log ingest.
If you use the default feature set, the extension will only report a single metric that counts the number of traps sent by a defined source during a defined interval.
Log Viewer
In the Log Viewer, go to Logs and filter trap events by log.source: snmptraps.

Limits
The number of received and processed trap events is limited to 7,000 per minute.
Define data scope
- Extension name
- Extension version
- Frequency of metric collection (interval)
- Metric name
- Two available dimensions: trap sender and trap OID
Example YAML definition file
name: custom:snmptraps-extension-exampleversion: 1.0.0minDynatraceVersion: "1.235"author:name: Dynatrace SNMP traps data source teamsnmptraps:- group: genericinterval:minutes: 1featureSet: basicmetrics:- key: number-of-traps-receivedvalue: calculatedtype: count,delta
Your SNMP traps monitoring scope definition starts with the snmptraps YAML node. All the settings under the node pertain to the declared data source type, which in this case is SNMP traps.
Metrics
SNMP traps collect just one metric that counts the number of traps sent by a source defined in your monitoring configuration during a defined interval. Your only customization option is to provide its key.
For example:
metrics:- key: myExtension.number-of-traps-receivedvalue: calculatedtype: count,delta
The metric key string must conform to the metrics ingestion protocol.
Best practices for metric keys
The metrics you ingest into Dynatrace using your extension are just some of the thousands of metrics, built-in and custom, processed by Dynatrace. To make your metrics keys unique and easy to identify in Dynatrace, the best practice is to prefix the metric name with the extension name. This guarantees that the metric key is unique and you can easily appoint a metric to a particular extension in your environment.
Feature set
Feature sets are categories into which you organize the data collected by the extension. For more information, see Feature sets. You can define feature sets at the extension, group, or individual metric level.
When activating your extension using monitoring configuration, you can limit monitoring to one of the feature sets.
In highly segmented networks, feature sets can reflect the segments of your environment. Then, when you create monitoring configuration, you can select a feature set and a corresponding ActiveGate group that can connect to this particular segment.
All metrics that aren't categorized into any feature set are considered to be default and are always reported.
Interval
The interval at which the data measurement will be taken. You can define intervals at the group, subgroup, or individual metric level. You can define intervals with the granularity of one minute. The maximum interval is 2880 minutes (2 days, 48 hours).
Setting the interval is not possible for JMX data sources.
For example:
interval:minutes: 5
The above format is supported starting with schema version 1.217. For earlier schema versions, use the following format (supported up to schema version 1.251):
interval: 5m
MIB files
Management Information Base (MIB) is the database managing the entities in a network identified by OIDs. MIB provides a source of additional information related to OIDs declared in your extension. For more information, see SNMP data source reference.
Monitoring configuration
After you define the scope of your configuration, you need to identify the network devices you'd like to collect data from and identify the ActiveGates that will execute the extension and connect to your devices.
The monitoring configuration is a JSON payload defining the connection details, credentials, and feature sets that you want to monitor. For details, see Start monitoring.
Example payload to activate an SNMP extension:
[{"scope": "ag_group-default","value": {"version": "1.0.0","description": "traps from routers","enabled": true,"featureSets": ["basic"],"snmptraps": {"sources" : [{"ip": "172.10.11.0/8","port": 8162,"authentication": {"community": "x120a1f"}},{"ip": "0.0.0.0/0","port": 162,"authentication": {"community": "public"}}]}}}]
When you have your initial extension YAML ready, package it, sign it, and upload it to your Dynatrace environment. For details, see Manage extension lifecyle.
The Dynatrace Hub-based extension activation wizard contains a dynamically updated JSON payload with your monitoring configuration
You can also use the Dynatrace API to download the schema for your extension that will help you create the JSON payload for your monitoring configuration.
Use GET an extension schema endpoint.
Issue the following request:
curl -X GET "{env-id}.live.dynatrace.com/api/v2/extensions/{extension-name}/{extension-version}/schema" \-H "accept: application/json; charset=utf-8" \-H "Authorization: Api-Token {api-token}"
Replace {extension-name} and {extension-version} with values from your extension YAML file. A successful call returns the JSON schema.
Scope
Note that each ActiveGate host running your extension needs the root certificate to verify the authenticity of your extension. For more information, see Sign extension.
The scope is an ActiveGate group that will execute the extension. All of the ActiveGates from the group will run this monitoring configuration at a time. If you plan to use a single ActiveGate, assign it to a dedicated group. You can assign an ActiveGate to a group during or after installation. For more information, see ActiveGate group.
Use the following format when defining the ActiveGate group:
"scope": "ag_group-<ActiveGate-group-name>",
Replace <ActiveGate-group-name> with the actual name.
Version
Version of this monitoring configuration. Note that a single extension can run multiple monitoring configurations.
Description
Human-readable description of the specifics of this monitoring configuration.
Enabled
If set to true, the configuration is active and Dynatrace starts monitoring immediately.
Sources
You have to define the sources of traps in a monitoring configuration. To define a source, add the following details:
- The network that sends packets with traps provided in the CDIR notation. To configure a single interface address, add the
32subnet mask after the IP address, for example172.10.11.0/32. - UDP port to which traps are sent
- Authentication credentials
- SNMPv1 and SNMPv2 are authenticated using community name only.
- SNMPv3 requires advanced authentication and is described in a following section.
Authentication
Authentication details passed to the Dynatrace API when activating a monitoring configuration are obfuscated and it's impossible to retrieve them.
Depending on the security level, construct the authentication details using one of the examples below. See the list of supported protocols.
{"ip": "10.10.10.10","port": 161,"authentication": {"type": "SNMPv3","userName": "user","securityLevel": "AUTH_PRIV","authPassword": "********","authProtocol": "SHA","privPassword": "********","privProtocol": "AES256C"}
Advanced
In some SNMP traps, variable binding OIDs have dynamic parts at the end that change with each incoming trap. To prevent problems with processing SNMP traps, you can configure variable binding OID trimming.
Format
"advanced": {"varbindings": [{"root": ".1.3.6","suffixLen": 1}]}
-
root—is used to match the suffix and trim it accordingly. You can specifyrootin raw (1.3.6.1.4.1.9.9.41.1.2.3.1) or resolved (CISCO-SMI::ciscoMgmt.41.1.2.3.1) format. -
suffixLen—specifies the number of octets at the end of the OID that should be trimmed.
Example
In this example, all variable bindings in the CISCO-SMI::ciscoMgmt subtree end in 34024. With each subsequently generated trap, the number will increase.
Before trimming:
"event.type": "LOG","content": "SNMP trap (CISCO-SMI::ciscoMgmt.41.2.0.1) reported from 192.168.1.100\n","status": "NONE","timestamp": "1678712960382","loglevel": "NONE","log.source": "snmptraps","snmp.trap_oid": "CISCO-SMI::ciscoMgmt.41.2.0.1.","device.address": "192.168.1.100","CISCO-SMI::ciscoMgmt.41.1.2.3.1.2.34024": "PKI","SNMPv2-MIB::snmpTrapOID": ".1.3.6.1.4.1.9.9.41.2.0.1","DISMAN-EVENT-MIB::sysUpTimeInstance": "1660720758","snmp.version": "2c","CISCO-SMI::ciscoMgmt.41.1.2.3.1.5.34024": "Certificate chain validation has failed. The certificate has expired. Validity period ended on 2023-11-29T03:21:33Z","CISCO-SMI::ciscoMgmt.41.1.2.3.1.6.34024": "1004407027","CISCO-SMI::ciscoMgmt.41.1.2.3.1.3.34024": "4","CISCO-SMI::ciscoMgmt.41.1.2.3.1.4.34024": "CERTIFICATE_INVALID_EXPIRED"
All variable bindings that match the value specified in root are trimmed.
After trimming:
"event.type": "LOG","content": "SNMP trap (CISCO-SMI::ciscoMgmt.41.2.0.1) reported from 192.168.1.100\n","status": "NONE","timestamp": "1678712960382","loglevel": "NONE","log.source": "snmptraps","snmp.trap_oid": "CISCO-SMI::ciscoMgmt.41.2.0.1.","device.address": "192.168.1.100","CISCO-SMI::ciscoMgmt.41.1.2.3.1.2": "PKI","SNMPv2-MIB::snmpTrapOID": ".1.3.6.1.4.1.9.9.41.2.0.1","DISMAN-EVENT-MIB::sysUpTimeInstance": "1660720758","snmp.version": "2c","CISCO-SMI::ciscoMgmt.41.1.2.3.1.5": "Certificate chain validation has failed. The certificate has expired. Validity period ended on 2023-11-29T03:21:33Z","CISCO-SMI::ciscoMgmt.41.1.2.3.1.6": "1004407027","CISCO-SMI::ciscoMgmt.41.1.2.3.1.3": "4","CISCO-SMI::ciscoMgmt.41.1.2.3.1.4": "CERTIFICATE_INVALID_EXPIRED"
Feature sets
Add a list of feature sets you want to monitor. To report all feature sets, add all.
"featureSets": ["basic","advanced"]
You can enable sending traps as events by setting featureSets to events.