Full Stack Observability
Monitor and analyze your entire stack, with AI-driven context, with a single solution combining logs, metrics, and traces.
Say goodbye to alert fatigue by embracing a unified platform
Get end-to-end visibility across your entire application stack
Detect and eliminate blind spots across your entire hybrid cloud environment by:
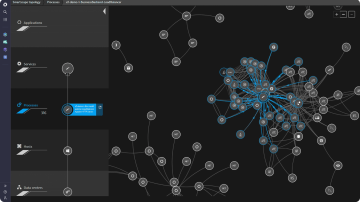
- Enabling end-to-end service ownership at scale with automated application topology and dependency mapping
- Breaking down silos with intelligently correlated traces, metrics, and logs in context
- Getting real time insights into the user journey with real user monitoring, synthetic transaction monitoring, and session replay
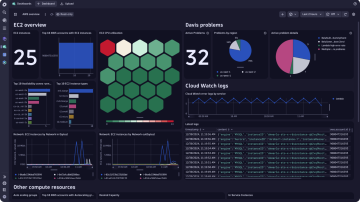
- Comprehensive infrastructure monitoring that tracks the health and performance of servers, containers, databases, and other backend components
Improve business outcomes with AI driven insights
Get intelligent answers to business critical questions by:
- Prioritizing problems based on their business impact
- Resolving issues faster with automated root cause analysis and details down to the code level
- Proactively optimizing application health and end-user experience with predictive exploratory analytics
- Driving business decisions with real-time data linked to supporting requests
Accelerate your digital transformation journey
Keep up with evolving cloud-native application architectures by:
- Ensuring projects are developed efficiently, securely, adhering to compliance requirements and the highest industry standards
- Providing teams with the flexibility to choose mixed environments tailored to their specific needs
- Getting real-time performance insights before, during, and after your shift to the cloud
- Ensuring wide supportability for multiple technologies and data sources, with or without an agen
Unlock the power of a unified platform


Resources
 Knowledge BaseWhat is full stack observability?
 KNOWLEDGE BASEWhat is cloud monitoring? How to improve your full-stack visibility
 eBOOK5 key trends shaping the future of digital transformation
Digital transformation has emerged as the compass guiding organizations toward a more agile, efficient, and customer-centric future.
Get a free trial
Want to see what intelligent observability powered by AI and automation can do for you? Get a free trial of the Dynatrace platform now.


