

Overview
In software, observability refers to the collection of measurements, better known as telemetry, produced by application services. Observability has been historically defined by three key pillars — metrics, distributed traces, and logs — the so-called “three pillars of observability”. Thanks to projects such as OpenTelemetry, which promotes the standardization of data collection, and W3C trace-context, built-in telemetry will soon become a must-have feature of cloud-native software.
Dynatrace believes that metrics, traces, and logs are the beginning of achieving true modern observability. Observability’s main goal is to derive useful outputs for decision making from the data points collected. Decision making goes beyond how to remediate problems when they appear. The next phase of observability is more sophisticated, it surpasses application remediation to focus on business value creation, ultimately helping companies achieve their operating objectives. User experience, topology, and security data are just a couple of ways to enrich this decision-making process. Let’s start by exploring the benefits of the three pillars of observability and then explore how user experience and security are advancing observability today.
The three pillars of observability and beyond — Captured continuously and automatically, no code changes required
There are many options for collecting telemetry data. One of the fastest and easiest ways to get started is with Dynatrace’s OneAgent. With Dynatrace, there is a single point of installation — appropriately named OneAgent — per each monitored host to collect all relevant data, in context, with high fidelity. Dynatrace OneAgent auto-discovers all the processes running on a host, including dynamic microservices running inside containers. OneAgent automatically activates instrumentation specifically for your stack. New components are continuously auto instrumented in real-time, with no code changes or manual configuration required. This means that observability is automatically added to applications and telemetry data is available in real-time.
In addition to the OneAgent, Dynatrace also makes it easy to ingest other 3rd party telemetry data. These additional details can add context and users benefit from the power of AI and analytics on their full telemetry data set. Some of the most notable include open-source tools like OpenTelemetry.
From the beginning Dynatrace has supported the Open Telemetry project and continues to be a top contributor today. Dynatrace ingests OTel data and users can extend OpenTelemetry’s benefits by getting access to topology mapping, advanced adhoc analytics and using the Davis AI engine to get answers.
Metrics
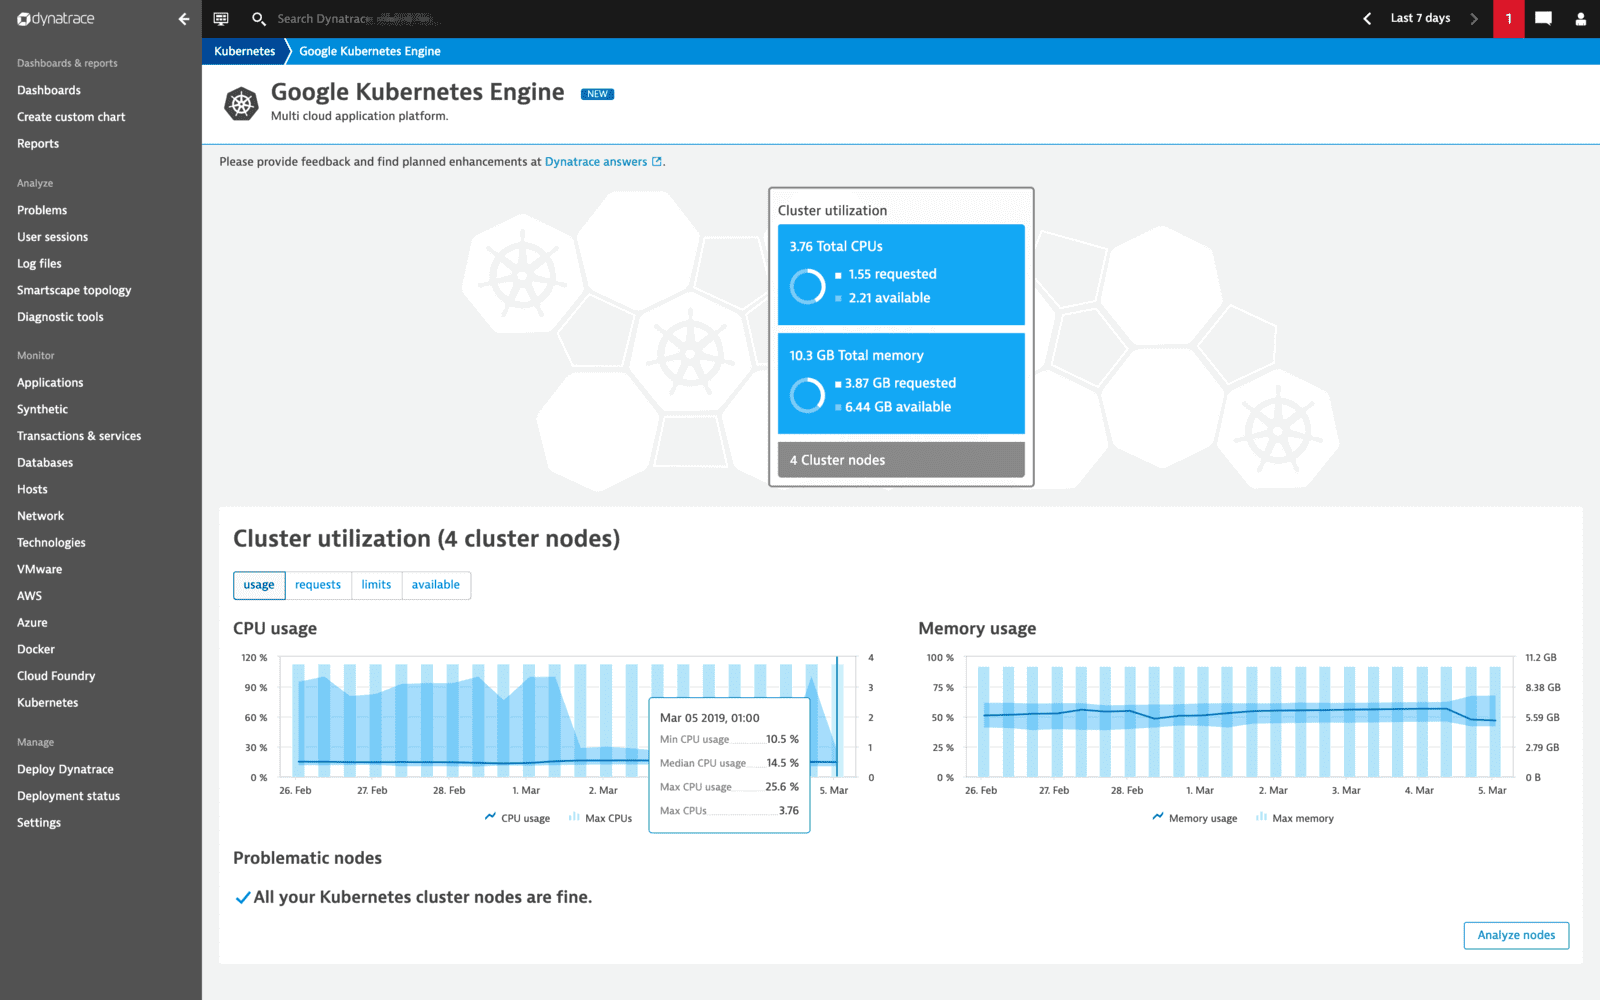
As a full-stack monitoring platform, Dynatrace collects a vast number of metrics for each monitored host in your environment. Depending on the types of technologies running, the average number of metrics is about 500 per computational node.
In addition, Dynatrace also collects important key performance metrics for services and real-user monitored applications, as well as metrics from cloud platforms like AWS, Azure, Kubernetes, and VMware Tanzu. Dynatrace is an open and extensible platform, and telemetry data from open source tools like Prometheus and StatsD can also be ingested to get the most accurate answers.
What’s most important, however, is not data collection, but deriving answers from data. Davis, our AI engine looks at all of these metrics in context to provide answers.
Distributed traces
With a microservices environment, you can have dozens, if not hundreds, of services calling one another. Distributed tracing is used to understand how all those different services connect together and how your requests flow through them. The Dynatrace service flow is generated automatically from distributed traces.

Distributed tracing, with no code changes required, has been a core component of Dynatrace from the very beginning. Our version of a distributed trace is powered by our patented PurePath™ technology and not only captures tracing information but also collects code-level data. Distributed traces are extended with code-level execution trees that include useful information such as CPU time, suspension time, and network I/O time.

Distributed tracing helps to rapidly (in our case, almost instantly) localize the service that’s causing the issue. But distributed tracing won’t help you dig deeper into the code to get more details. For that, you need OneAgent’s codelevel visibility and CPU profiling. OneAgent also captures information about background and service activity for CPU analysis and method hotspots. This is all done with OneAgent autoinstrumentation — which means no wasted time spent instrumenting or configuring.

For those who may be already using OpenTelemetry as part of their approach to gathering distributed traces Dynatrace makes it easy to ingest OTel data using the OneAgent for an automated approach or without it, by simply ingesting OTel data into the platform. With this approach users get the benefits of OTel with the power of AI-backed analytics in Dynatrace.
Logs
Dynatrace automatically detects log files and puts them in context with the corresponding infrastructure metrics and traces. Grail, Dynatrace’s data lakehouse, enables users to store petabytes of data without schemas, indexing and rehydration. What this means is instant access to log data on-demand, allowing for fast and accurate real-time decision making.

Log management and analytics has many possibilities. Chart log details over time by creating a log metric, create log events for critical information found in log patterns, search for text patterns across multiple monitored logs and create problems based off log events.
Logs in Dynatrace have the advantage of being held in a sea of context rich information. Using our AI engine and query based analysis to get the best results.

Advancing observability
While the three pillars of observability serve as a solid foundation, there are opportunities to extend observability to make even more effective data driven decisions. To achieve a more complete understanding, it is essential to incorporate details from user experience and security. Advanced observability takes a holistic, context driven approach and provides answers that can proactively address potential problems before they happen.
User Experience
While people tend to focus on back-end services when referring to observability, there is great value in understanding the end user experience (in the browser, mobile app or any custom application), pulling in experience metrics and extracting user data from logs.
Dynatrace Digital Experience Monitoring (DEM) automatically captures full sessions from real users, providing you with complete visibility into the customer experience across every digital touchpoint. Without this “User Experience” pillar added into the definition of advanced observability, you’re missing context relating to HTTP and Javascript errors, application performance from the user’s perspective, and third-party services. This lack of visibility would also create blind spots and an inability to understand to the impact that applications have on business level KPI’s such as revenue, conversions, and customer engagement.
The goal of advanced observability is to deliver precise answers that are actionable and prescriptive in their approach. Understanding real users and business impact are both essential parts in making the right decisions that can change business outcomes.
Security
In the past, security has been siloed from other teams. With the increase in number and sophistication of attackers, security is being included at each stage of the SDLC (sales development lifecycle) resulting in a more collaborative DevSecOps approach.
Dynatrace detects application vulnerabilities in real time and at runtime and knows if a vulnerability is publicly available and alerts if it is being exploited. The combination of Davis AI and contextual insights from additional observability data leads to faster problem resolution and simplifies the understanding of problem impact.
After an attack or an attempted breach has occurred application forensics play an important role. Understanding the how, where and why of an attack helps with putting processes and controls in place to prevent future attackers from having any success. Dynatrace’s log audit and forensics enable fast analysis by leveraging observability data in context, allowing for proactive action to be taken. A layered approach to security is best, covering all possible entrances for attackers.
Avoid data silos: Context matters
Capturing observability data is good. But it’s even better when it’s done automatically, without code changes or cumbersome manual configuration needed from your already constrained human resources.
However, too often, metrics, traces, logs, userexperience, and security are treated as data silos, with no relationships between them and are aggregated in unrelated ways without any answers. But what is the point of capturing and reporting on this disconnected data? Looking at metrics, traces, logs, user experience, and security alone — without meaningful interdependencies and context between the pillars — is useless for root cause analysis in highly dynamic and complex environments.
With silos, you might get an alert for an increase in the failure rate of service A. And then get an alert because process B has an increase in CPU usage. But you won’t know if these two alerts have a causational relationship and how your users may be impacted by them. You need to dig deeper, but you’re looking for only a few traces amongst billions that document the issue. It’s going to be extremely difficult to find that needle in the haystack. And it will be near impossible to do it continuously as your environment continues to scale in size and complexity.
The secret to connecting the silos with context?
There is a vast amount of telemetry data and connecting all of the details is not an easy task. Dynatrace is powered by AI and Automation to give data driven answers. One of the ways users can take an expanded approach to observability, is with with real-time topology discovery and dependency mapping. With Smartscape™, Dynatrace continuously and automatically maps data into a realtime dependency map that shows the relationships and dependencies for all entities, both vertically up and down the stack and horizontally between services, processes, and hosts. All captured traces, metrics, log files, and user experience data points are automatically mapped to the monitored entities they relate to, making it easier to get answers.

By automatically analyzing the dependencies among components, Dynatrace identifies not only if a problematic service is the root cause of a problem, but also its dependencies on other services that run within different process groups in your data center. To get answers quickly and ensure that all details are in context, Dynatrace uses a unique way to store data. With Grail — Dynatrace’s data lakehouse, massive amounts of unstructured data can be stored creating a unified dataset.
Petabytes of data can be queried to get answers in real time as decisions are being made. The value lies not only the speed and cost but encompasses the ability to easily query and correlate data.
In the above example, Dynatrace’s AI engine, Davis,automatically follows and evaluates the health of each relevant back-end service within the transaction and immediately identifies a Golang service as the root cause.
As a result, Dynatrace AI presents the complete, vertical technology stack of the Golang service in the Root cause section of the problem details page and highlights all the relevant findings. With one click, you can then dive deep into the affected metrics, traces, log files, and user experiences to analyze and fix the issue.
A backend problem can impact real users and business operations. Grail along with Davis our AI engine makes it easy to correlate and quantify, create a truly BizDevSecOps environment.
Having advanced observability into what you know could go wrong can make a huge difference. But what can really cause challenges for your business are the unknown unknowns. These are the things you aren’t aware of, don’t understand, and might not monitor. Because of how Dynatrace is architected, it automatically monitors unknown unknowns in your environment. Our platform auto-instruments, captures high-fidelity data, and provides full-stack real-time dependency maps to enable instant, precise, AI-assisted answers — not just correlations. Our Notebooks leverage the power of Grail to enable users to collaborate and create custom ongoing analytics specific to users needs. By extending the pillars and requirements of advanced observability, you can finally achieve precise answers that drive action and significantly improved business outcomes.
To get even more out of their telemetry data in context users can benefit from custom, data driven apps with AppEngine. This easy to use low code approach allows users to create custom apps in Dynatrace. With the vast amount of observability data available, it is possible to create an app, that provides useful answers to members of your organization or perhaps your industry as a whole. Ultimately driving better decision making. One example of an app developed by Dynatrace is our Carbon impact app — which leverages Dynatrace collected data for hybrid and multicloud environments to understand your IT carbon footprint. With this app view it is possible to view underutilized instances and resize or re-architect if necessary, saving costs and becoming more green.
A Leader in the 2023 Gartner® Magic Quadrant™ and ranked #1 in the Critical Capabilities for APM and Observability reports
See why we’re positioned furthest for Vision and highest for Execution in the Magic Quadrant, and ranked #1 in all Use Cases in the Critical Capabilities Report for Application Performance Monitoring and Observability.

Trusted by thousands of top global brands
Try it free
