

As modern cloud-native environments continue to grow exponentially, so does the need for agile Kubernetes practices.
The 2025 edition of the Kubernetes in the Wild report highlights global trends in the technology’s adoption and usage in production environments from thousands of organizations across diverse industries. This report is based on data from organizations using the Dynatrace unified observability and security platform to secure their Kubernetes clusters while ensuring optimal performance, health, and reliability.
Key findings from this past year’s analysis provide insights into the Kubernetes utilization differences between cloud and on-premises environments, particularly regarding cluster hosting and infrastructure model preferences. The report also reveals how organizations are adopting auxiliary workloads, primary areas of growth, and the most popular open-source technologies and programming languages organizations are using in their Kubernetes environments today.
These trends highlight the need for organizations to comprehensively understand their Kubernetes environments.
1. Widespread migration of Kubernetes clusters to the cloud signals a pivotal shift to cloud-native infrastructure
At the close of 2024, the majority of Kubernetes clusters were hosted in the cloud instead of on-premises.
Currently, two out of every three clusters are hosted in the cloud. In 2022, only 45% were in cloud. This represents a significant and sustained shift toward cloud hosting over recent years. While cloud migration is still a top priority for organizations of all verticals, several organizations have already made major shifts toward the cloud, resulting in a moderation in the adoption rate year over year.
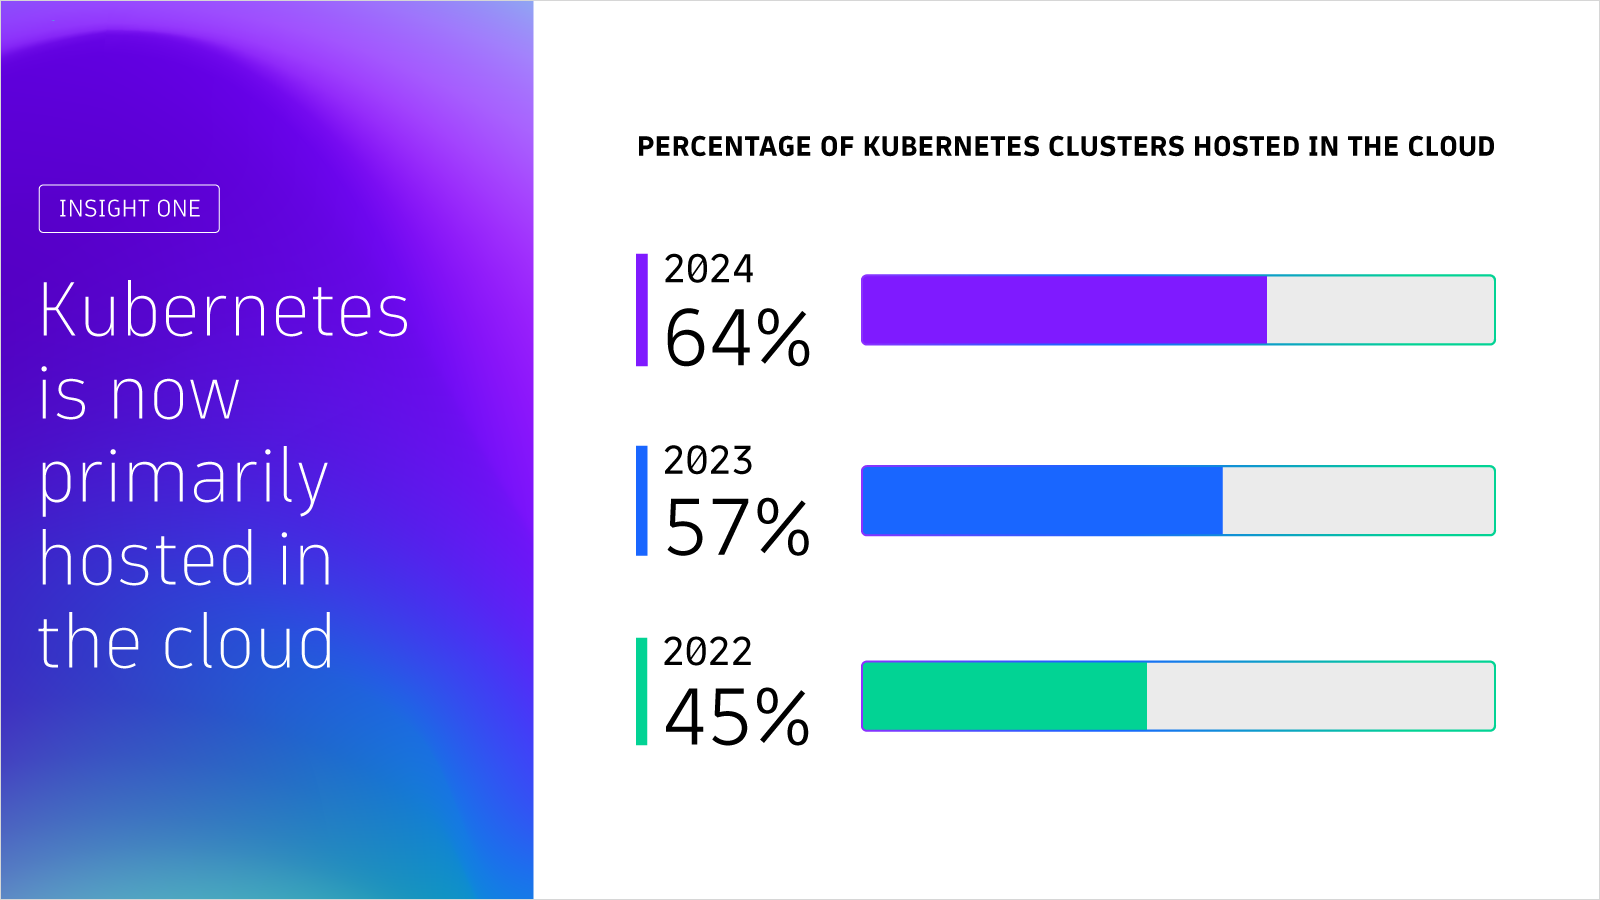
With most clusters now in the cloud, this stabilization marks a new era where cloud-native computing and containerized applications are the standard for modern IT and business operations. In 2025, cloud environments will likely continue to grow at a steady rate and solidify as the “new normal” for delivering cloud-native applications and services.
Furthermore, widespread standardization of Kubernetes lays the groundwork for new and innovative ways to maximize the value of the platform. However, new approaches and best practices will take time to come to fruition and become standardized as organizations implement the necessary Kubernetes-adjacent tools, technologies, and practices to usher in a new wave of innovations.
2. Smaller Kubernetes node sizes in the cloud reflect a focus on cost-effective infrastructure strategies
In past years, nodes with smaller memory sizes, around 16 to 32 GB each, have had a higher concentration in the cloud compared to on-premises. Conversely, on-premises clusters generally contained more nodes with larger memory sizes, around 32 to 64 GB. In 2024, the distribution of node memory sizes does not significantly deviate from this trend, with smaller nodes shifting toward the cloud and larger nodes remaining on-premises.
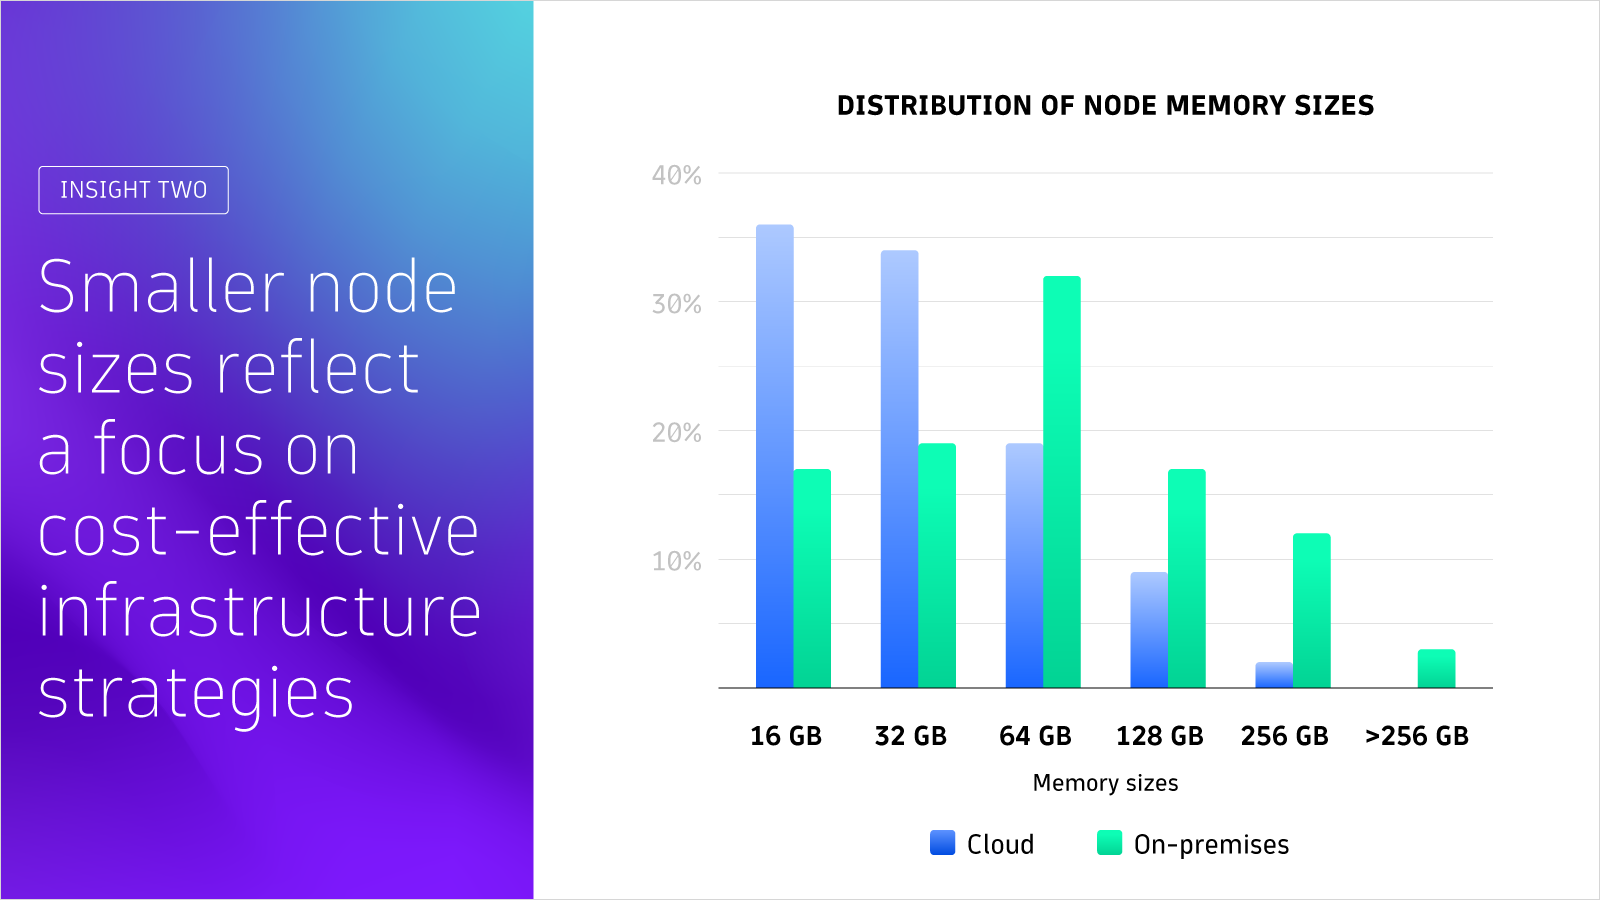
This indicates the value companies are realizing from the scalability and agility of cloud architectures. Additionally, there were no significant changes in the number of nodes and pods per cluster in both cloud and on-premises environments.
The procurement price of hardware remains only one of many considerations when developing a cost-effective infrastructure model. Scalability and operational efficiency are important factors teams must consider when deciding on node size, quantity, concentration, and location.
For example, while using more, smaller nodes may not lead to lower costs overall, this approach does provide flexibility and cost optimization opportunities for scaling up and down based on demand.
3. Kubernetes solidifies its status as the “operating system” of the cloud, driven by expanding auxiliary workloads
In recent years, Kubernetes has rapidly emerged as the “operating system” of the cloud, a title accredited to its flexibility, versatility, and capacity to run almost any workload.
One way Kubernetes demonstrates its “operating system” status is how organizations utilize auxiliary workloads in proportion to application workloads.
Auxiliary workloads support and run alongside the primary application workload. They are used for tasks such as running and supporting system services, monitoring, build pipelines, service meshes, and other services that enhance the core application’s functionality.
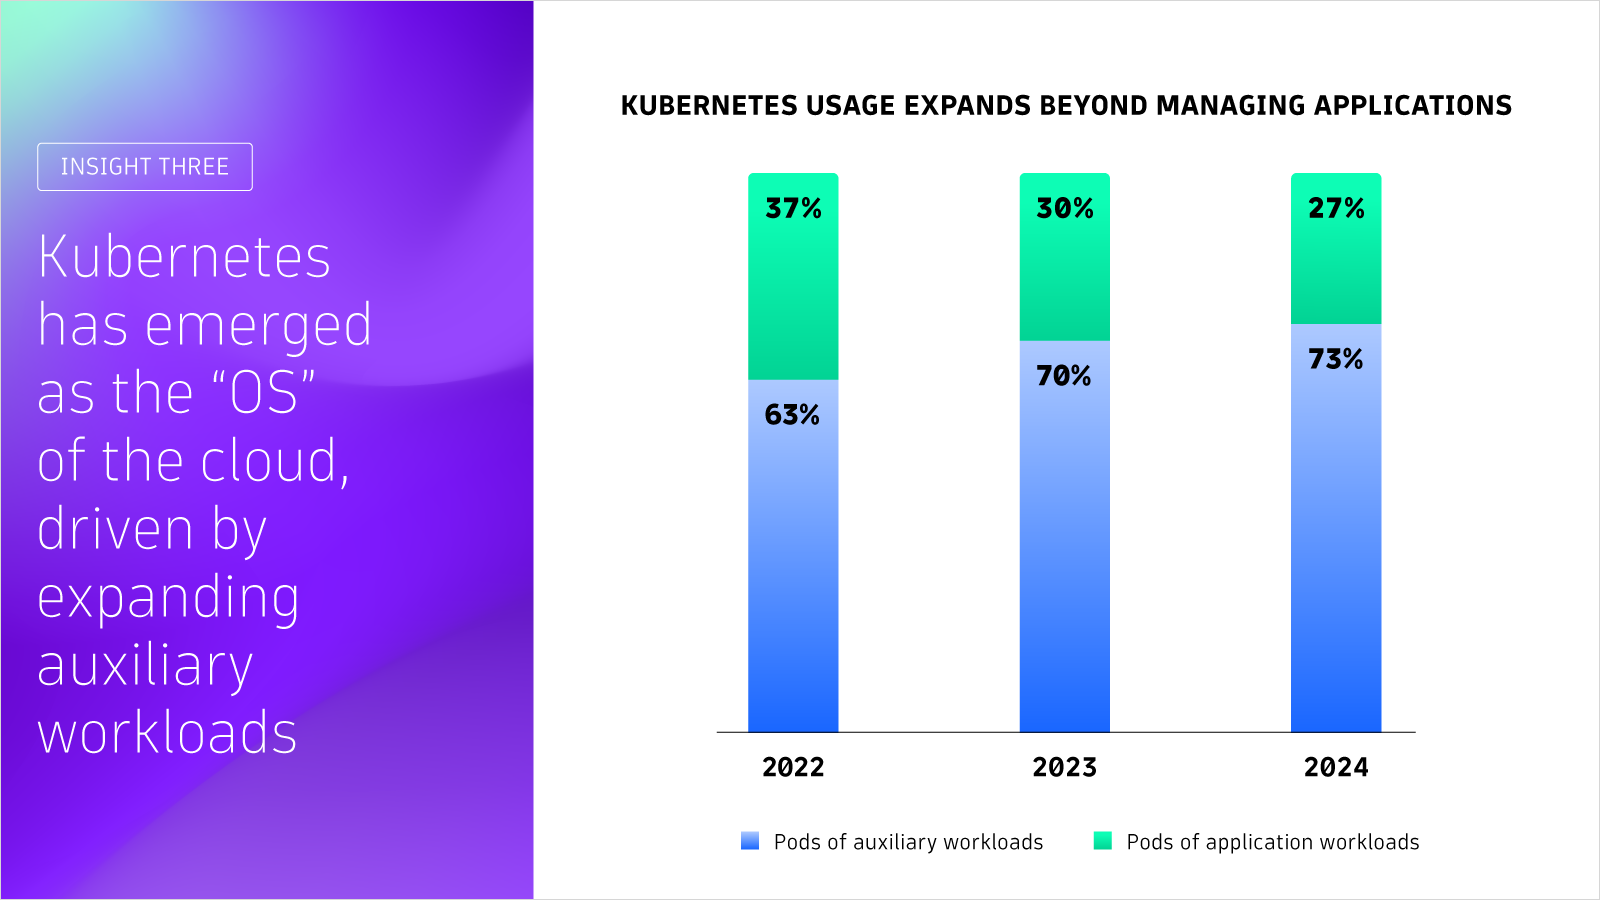
The ratio of pods for auxiliary to application workloads shows a steady increase from previous years. This increase suggests organizations are continuing to expand their use of Kubernetes beyond simply deploying, running, and managing applications to also use Kubernetes to standardize how they deploy and manage their auxiliary workloads.
In the past, pods of auxiliary workloads represented roughly two-thirds to one-third application workload and have increased to nearly three-quarters auxiliary to one-quarter application workload. Technologies like service meshes, observability platforms, security controls, and messaging systems play a key role in this evolution, reinforcing Kubernetes’ reputation as the “operating system” of the cloud.
Moreover, examining median pod runtime patterns reveals that pods of build and backing service workloads have much shorter runtimes than pods that directly support applications. While build pipeline pods are short-lived at just 4 minutes, application, monitoring, and system pods run consistently for 24 hours alongside the 8-hour daily runtime of backing service pods.
Let’s look at a median sized cluster and sum up the runtimes of all the running pods for one day. Such a cluster logs approximately 3,500 pod hours a day. At 46%, application workloads account for almost half the pod hours, 37% are system, 14% monitoring, 3% backing, and less than one percent of pod hours are from build workloads.
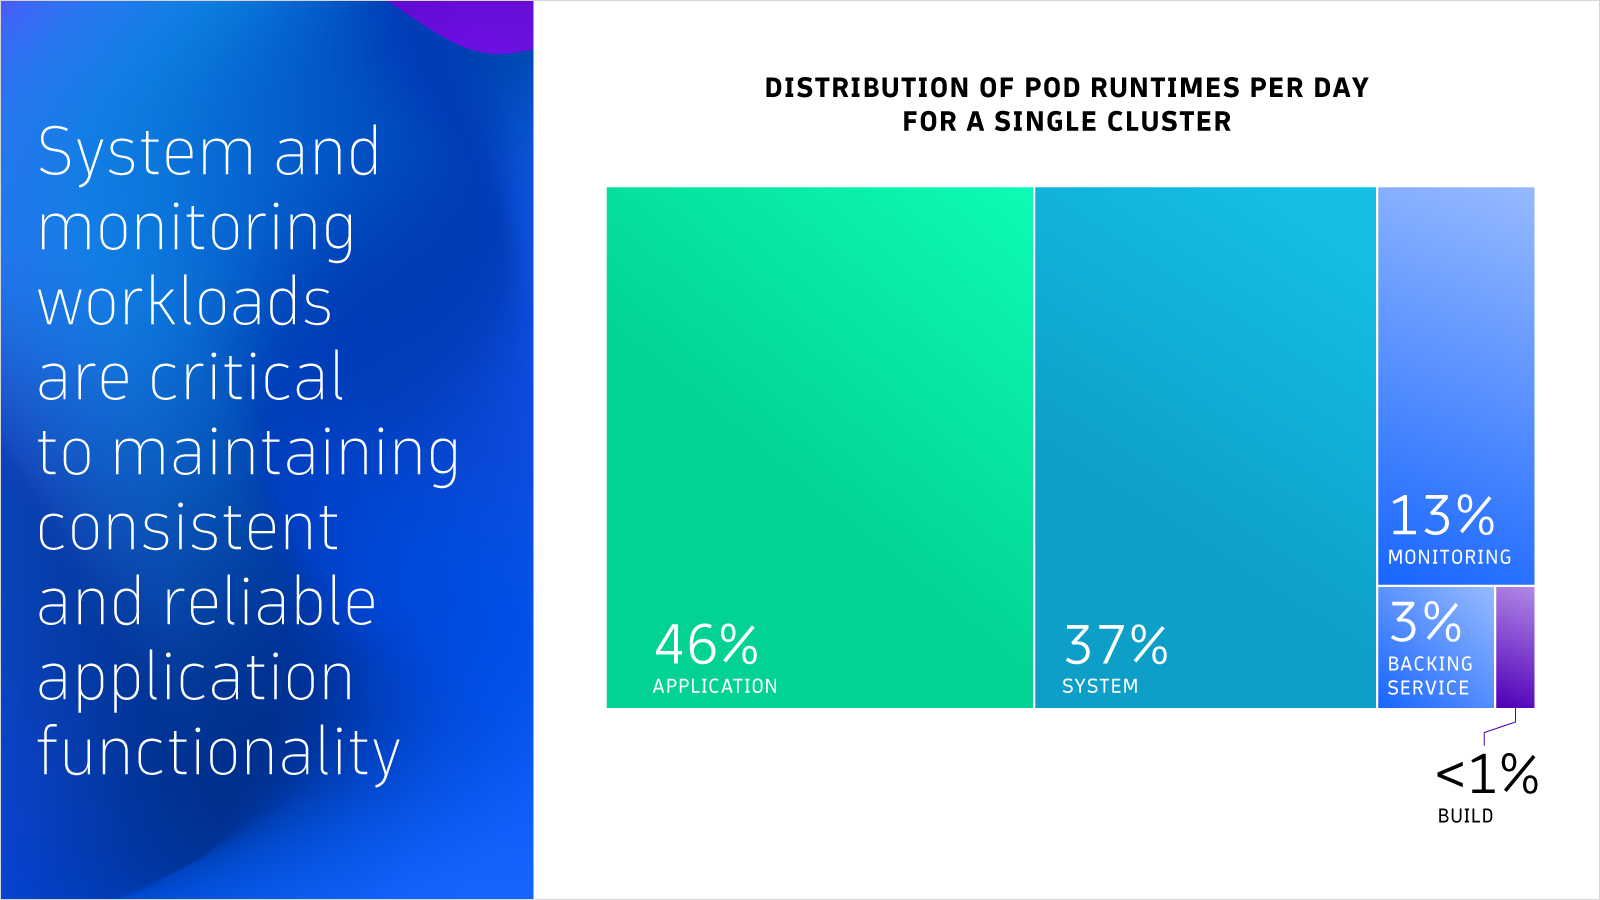
This distribution of pod lifespans illustrates how critical system and monitoring functions are to maintaining consistent and reliable application functionality. This breakdown underscores the importance of optimizing workload efficiency to ensure cluster stability, scalability, and cost effectiveness.
4. Security solutions, internal development platforms (IDPs), and open-source software gain traction
While the adoption rates for three auxiliary workload categories—databases, open-source monitoring solutions, and messaging services—have stabilized, Kubernetes security and compliance solutions continue to see steady growth.
From just under 35% in 2022, the use of Kubernetes security tools has surged to over 50% in the past year. This upward trend is expected to persist as security awareness increases and both new security threats and solutions continue to emerge.
A new insight from this past year’s analysis shows the rise in adoption of internal development platforms (IDPs). IDPs help teams streamline and automate the provisioning of development environments. Although still in the early stages, the adoption rate surpassed 10% in 2024, emerging as a new category and one that is likely to increase in coming years.
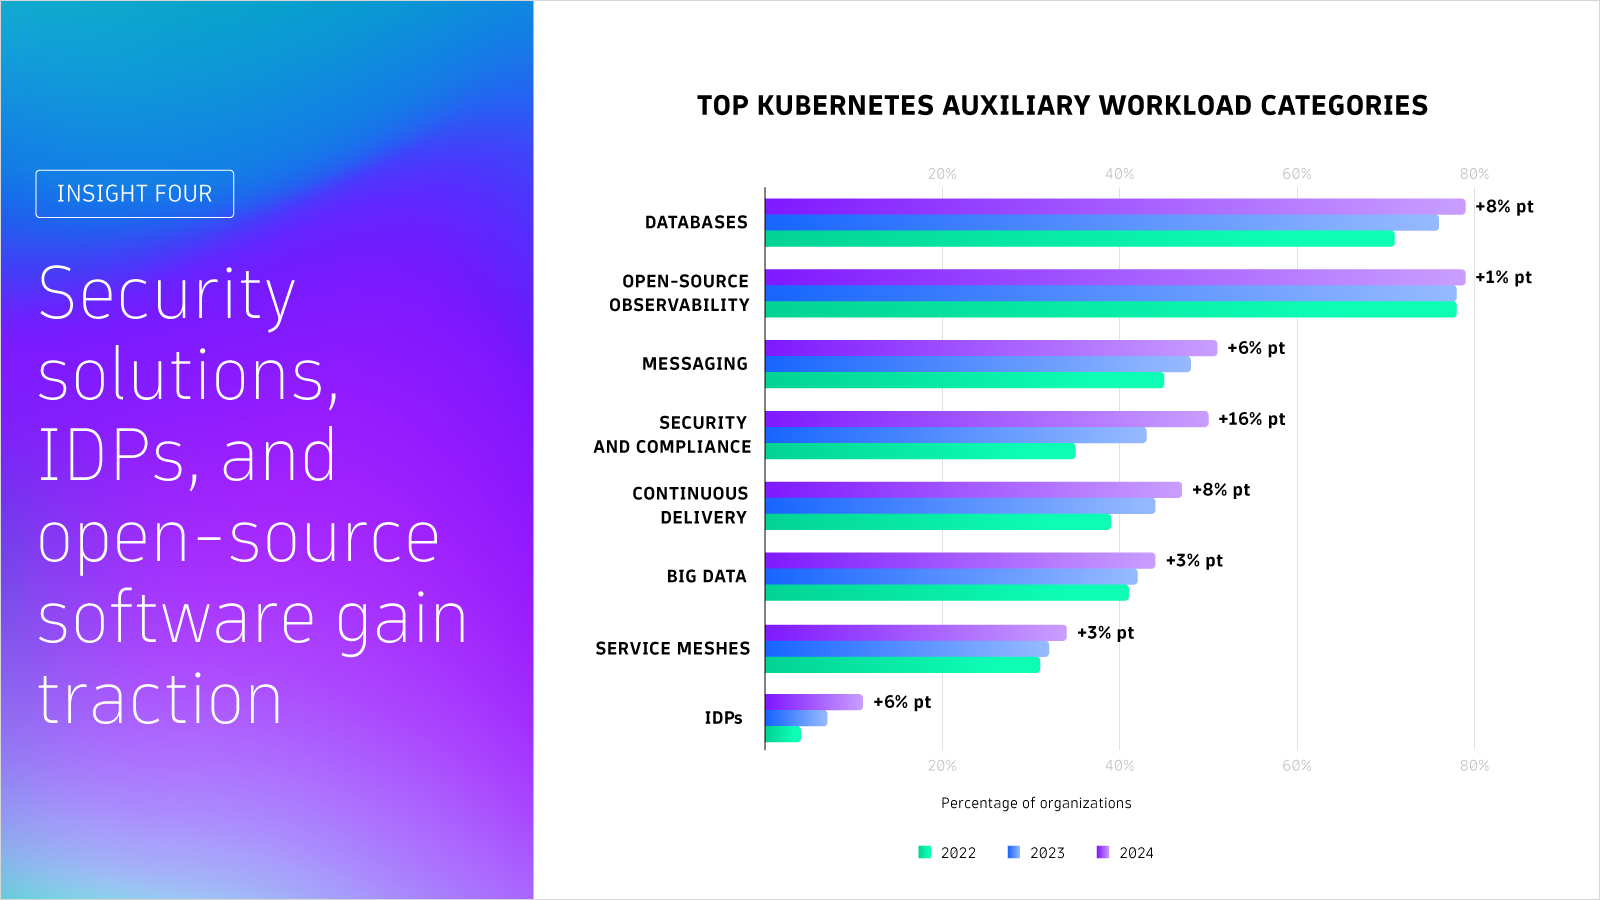
These conditions emphasize the continued need for teams to prioritize and gain insights from security data efficiently by combining observability and security data in a single view. This integration of observability and security enables teams to analyze security data in the context of the larger digital environment, allowing for easier management of both the security and performance of cloud-native applications.
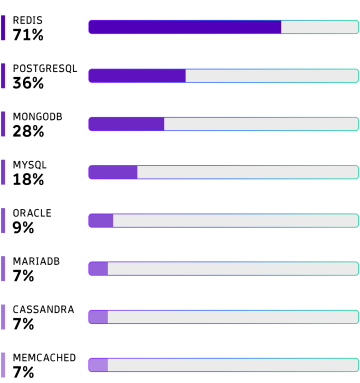
DATABASES
Redis is an in-memory key-value store and cache that streamlines processing, storage, and interaction with Kubernetes applications. Redis remains the clear leader in database and caching workload usage, and its prevalence has grown by 12 percentage points since 2022, with about 3 out of 4 organizations now running the technology in Kubernetes. Ranking second in database workloads, PostgreSQL saw a slight uptick in usage (up 6 percentage points from 2022).
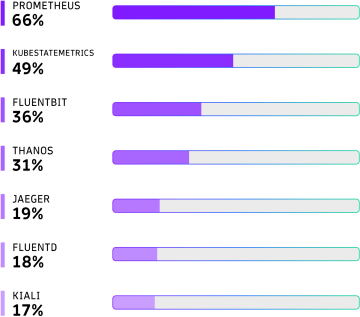
OPEN-SOURCE OBSERVABILITY
While Prometheus remains the most widely used open-source observability tool, with about two thirds of organizations using the technology, there were several significant changes among less popular tools. Out of the top seven open-source observability tools used across surveyed organizations, usage increased for both Fluent Bit (9 points), and Thanos (5 points).
Accompanying these was a shift away from Fluentd in the past two years (from 32% to 18%), representing a transition toward its lighter-weight successor, Fluent Bit.
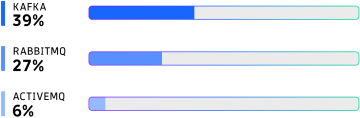
MESSAGING
Kafka and RabbitMQ remain at the head of the pack for messaging and event-streaming systems, seeing a respective 7 and 4 percentage point increase since 2022. Beyond this marginal increase, there are no significant changes in messaging and event-streaming technology usage.
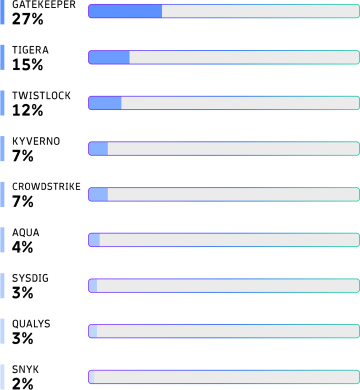
SECURITY AND COMPLIANCE
Gatekeeper is still the most popular tool supporting security among organizations. It has increased in usage by 11 percentage points since 2022, rendering it the clear leader in this category. Proprietary security solutions such as CrowdStrike and Tigera also saw slightly higher usage rates (5 and 6 percentage point growth, respectively).
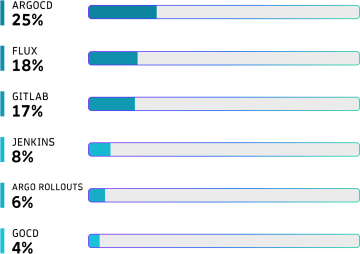
CONTINUOUS DELIVERY
ArgoCD and Flux both continue to hold the lead for continuous delivery (CD) solutions. In particular, ArgoCD – a tool popular in platform engineering for driving efficiency and scalability, saw the most significant increase in usage since 2022, with about a quarter of organizations now using the solution (up from 17% in 2022).
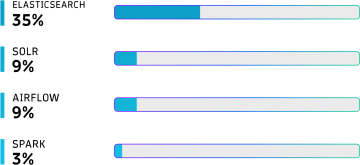
BIG DATA
With over a third of organizations using the technology, Elasticsearch remains a popular solution for many organizations looking to store, search, and analyze large datasets. For reference, the second most popular solution is Apache Solr, which is used by 9% of organizations.
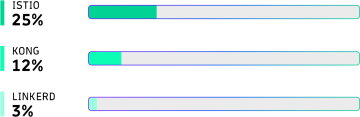
SERVICE MESHES
While still behind Istio (which a quarter of organizations now use) as the most popular service mesh, Kong has seen a 5 percentage point increase in usage, jumping from 7% in 2022 to 12% in 2024—which could be indicative of the need for enterprise-grade options as cloud-native architecture becomes the status quo.
INTERNAL DEVELOPMENT PLATFORMS
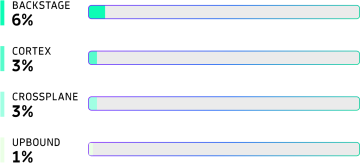
IDPs are playing an increasingly important role in development teams, enabling them to offload time-consuming setup tasks and focus on value creation. The leading platform technologies in this space are Backstage (6%), Cortex (3%), and Crossplane (3%).


5. Java, Go, and Node.js remain the top Kubernetes programming languages
Dynatrace OneAgent can identify the specific programming languages of every application workload running on Kubernetes and provides key insights into programming language preferences and trends across organizations.
Data from OneAgent shows that Java virtual machine (JVM)-based languages remain the most widely used—85% of companies use JVM-based languages for 56% of their application workloads. This usage remained consistent with previous years, demonstrating the lasting and widespread predominance of JVM-based languages across industries.

Go is a fast follower, with 81% of companies using the language for 19% of their application workloads. Similar to the rates associated with JVM-based languages, the adoption and utilization trends of Go and other programming languages remained mostly consistent in 2024.
These stable rates indicate the continued preference for proven and scalable approaches to support the unique and robust needs of cloud-native solutions.
Stabilization, innovation, and the next wave of possibilities
As organizations develop greater technical proficiency with Kubernetes, they can expect increased stabilization, predictability, and standardization, along with opportunities for optimization and innovation. Rapid advancements in AI along with the growing security concerns will drive the evolution and adaptation of Kubernetes usage and monitoring to meet modern business needs, paving the way for new trends.
However, Kubernetes implementation alone does not guarantee increased business value. To maintain Kubernetes health, security, operational efficiency, and cost efficiency—and to drive optimization and innovation—comprehensive Kubernetes observability with AI-driven analysis is essential.
A Leader in the 2025 Gartner® Magic Quadrant™ for Observability Platforms
Read the complimentary report to see why Gartner positioned us highest for Ability to Execute in the latest Magic Quadrant.
This graphic was published by Gartner, Inc. as part of a larger research document and should be evaluated in the context of the entire document. The Gartner document is available upon request from Dynatrace. Dynatrace was recognized as Compuware from 2010-2014.

Trusted by thousands of top global brands
Try it free
