
Software is taking over the world
As companies push to digitally transform, they are accelerating their workloads to the cloud to leverage the technology platform they need to release better software faster, and ensure it works perfectly across every customer interaction. But, the very nature of dynamic cloud environments is complex and can threaten an organization’s business / end-user experience.
This eBook will give you 5 key tips for monitoring VMware Tanzu so that you can better allow development, operations/ SRE and business teams to get fast feedback on platform performance. This will help you modify and improve applications quickly, and continue to increase the value you are delivering to business teams.
Speed and scale: a double-edged sword
You invested in VMware Tanzu to build and run your software at a speed and scale that will transform your business—that’s where VMware Tanzu excels. But are you prepared for the complexity that comes with speed and scale? As software development transitions to a cloud native approach that employs microservices, containers, and software-defined cloud infrastructure, the complexity you will experience in the immediate future is more immense than the human mind can envision.
You also invested in monitoring tools. Lots of them over the years. But your traditional monitoring tools don’t work in this new dynamic world of speed and scale that VMware Tanzu enables. That’s why many analysts and industry leaders predict that more than 50% of enterprises will entirely replace their traditional monitoring tools in the next few years.
What killed traditional monitoring?
Which brings us to why we’ve written this guide. We understand how important your software is. And we know that choosing the right monitoring platform is mandatory if you want to live by speed and scale, and not die by speed and scale.
We worked with your industry peers to arrive at our insights and conclusions
Dynatrace works with the world’s most recognized brands, helping to automate their operations and release better software faster. We have experience monitoring the largest VMware Tanzu implementations, helping enterprises manage the significant complexity challenges of speed and scale. Some examples include:
- A large retailer managing 2,000,000 transactions a second
- An airline with 9,200 agents on 550 hosts capturing 300,000 measurements per minute and more than 3,000,000 events per minute
- A large health insurer with 2,200 agents on 350 hosts, with 900,000 events per minute and 200,000 measures per minute
Read on to reveal five critical factors that dictate the right monitoring platform for VMware Tanzu.
At Dynatrace, we experienced our own transformation—embracing cloud, automation, containers, microservices, and NoOps. We saw the shift early on and transitioned from delivery software through a traditional on-premise model to the successful hybrid-SaaS innovator it is today. Read the Game changing – From zero to DevOps cloud in 80 days-brief to learn more, too.
Hybrid, multi-cloud is the norm
Insight
Enterprises are rapidly adopting cloud infrastructure as a service (IaaS), platform as a service (PaaS), and function as a service (FaaS) to increase agility and accelerate innovation. Cloud adoption is so widespread that hybrid multi-cloud is now the norm. According to RightScale, 81% of enterprises are executing a multi-cloud strategy.
Hybrid cloud
As enterprises migrate applications to the cloud or build new cloud-native applications, they also maintain traditional applications and infrastructure. Over time, this balance will shift from the traditional tech stack to the new stack, but both new and old will continue to coexist and interact.
Multi-cloud
Different cloud platforms have different features and benefits, technologies, levels of abstraction, prices, and geographic footprints. Each of these differences make them suitable for specific services. Enterprises started with a single cloud provider but quickly embraced multiple clouds, resulting in highly distributed application and infrastructure architectures.
Challenge
The result of hybrid multi-cloud is bimodal IT—the practice of building and running two distinctly different application and infrastructure environments. Enterprises need to continue to enhance and maintain existing, relatively static environments. They also need to build and run new applications and scalable, dynamic software defined infrastructure in the cloud.
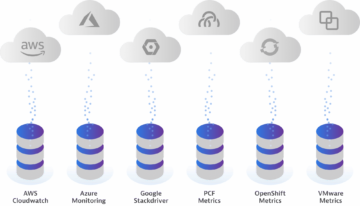
Putting traditional IT to one side for a moment to focus solely on multiple cloud platforms, the frequent output is monitoring tool proliferation. This is because of teams operating in silos, despite critical interdependencies between services running across clouds.
The challenge of multiple monitoring tools across clouds is further compounded when we bring traditional IT back into focus. And with it, the need to monitor and manage a range of existing technologies that also have service interdependencies with cloud environments.
Key consideration
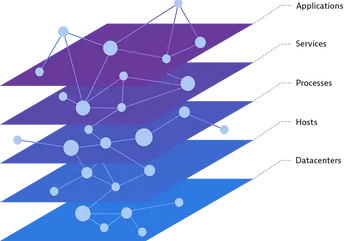
Simplicity and cost saving were the drivers for early cloud adoption. But today, cloud use has evolved into complex and dynamic landscapes that incorporate multiple clouds as well as traditional on-premise technologies. Being able to seamlessly monitor the full technology stack across multiple clouds as well as traditional on-premise technology stacks is critical to automating operations–no matter how highly distributed the applications and infrastructure.
Microservices and containers introduce speed
Insight
Microservices and containers are revolutionizing the way applications are built and deployed. They provide tremendous benefits in terms of speed, agility, and scale. In fact, 98% of enterprise development teams expect microservices to become their default architecture. IDC predicts that by 2022, 90% of all apps will feature microservices architectures.
Challenge
Seventy-two percent of CIOs say that monitoring containerized microservices in real time is almost impossible. Moving to microservices running in containers makes it harder to get visibility into environments. Each container acts like a tiny server, multiplying the number of points you need to monitor. They live, scale, and die based on health and demand. As enterprises scales their VMware Tanzu environments from on-premises to cloud to multi-cloud, the number of dependencies and data generated increases exponentially, making it impossible to understand the system as a whole.
The traditional approach to instrumenting applications involves the manual deployment of multiple agents. When environments consist of thousands of containers with orchestrated scaling, manual instrumentation becomes impossible and severely limits the ability to innovate.
Key consideration
A manual approach to instrumenting, discovering, and monitoring microservices and containers will not work. For dynamic, scalable platforms like VMware Tanzu, a fully automated approach to agent deployment and continuous discovery of containers and monitoring of the applications and services running within them is mandatory.
— Dynatrace CIO Complexity Report 2018
AI empowers — but not all AI is equal
Insights
Gartner predicts 30% of IT organizations that fail to adopt AI will no longer be operationally viable by 2022. As enterprises embrace hybrid, multi-cloud environments, the sheer volume of data and massive complexity created will make it impossible for humans to monitor, comprehend, and take action in a timely manner. This critical need for machines to solve data volume and speed challenges resulted in Gartner developing a new category for the industry, known as “AIOps” (or AI for IT Operations).
Challenge
AI is a buzzword across many industries and making sense of the market noise is difficult. To help, here are three key AI use cases to keep in mind when considering how to monitor your VMware Tanzu Platform and applications:
Many enterprises are trying to address these use cases by adding an AIOps solution to the 10-25+ monitoring tools they already have. This approach may have limited benefits, such as alert noise reduction. But it will have minimal impact on addressing root cause analysis and auto-remediation requirements as it lacks the contextual understanding of the data to draw any meaningful conclusions.
You will also find there are many different approaches to AI. Here are a few of the more popular ones you are likely to encounter as you move towards an AIOps strategy:
Key consideration
So while AI empowers — not all AI is created equal. Attempting to enhance existing monitoring tools with AI such as machine learning and anomaly- based AI, will provide limited value. AI needs to be inherent in all aspects of the monitoring platform and see everything in real time, including the topology of the architecture, dependencies, and service flow. AI should also be able to ingest additional data sources for inclusion in the AI algorithms, as opposed to correlating data via charts and graphs.
— Gartner
DevOps and Continuous Delivery: Innovation's soulmate
Insight
DevOps and Continuous Delivery is perhaps the most critical consideration when maximizing an investment in VMware Tanzu and other cloud technologies. Implemented and executed correctly, these can enhance an enterprise’s ability to innovate with speed, scale, and agility. Last year Dynatrace did a survey that included two important dimensions, MTTR (length of time to remediate and resolve an issue) and mean-time-to-innovation (the time it takes to build and test functionality to push to the end-users). These tell a lot about the maturity of a company and their level of automation. The results surprisingly showed that only about 5% of the people we surveyed are achieving top performance. 95% of companies today are not leveraging the full potential of cloud native technology.
Challenge
As enterprises scale across multiple teams, there will be hundreds or thousands of changes a day, resulting in code pushes every few minutes. While CI/CD tooling helps mitigate error-prone manual tasks through automated build, test, and deployment, bad code can still make it into production. The complexity of a highly-dynamic and distributed cloud environment like VMware Tanzu, along with thousands of deployments a day, will only exacerbate this risk.
As the software stakes get higher, shifting quality checks left—that is, earlier in the pipeline—and enabling faster feedback loops becomes critical. But it can’t be accomplished easily with a multi- tool approach to monitoring. To be effective, a monitoring solution needs to have a holistic view of every component, every change, and contextual understanding of the impact each change has on the system as a whole.
Key consideration
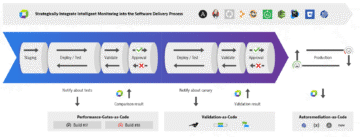
To go fast and not break things, AI and automation should be a part of your DevOps monitoring strategy.
- Use monitoring strategically as a feature of the end-to-end pipeline to help automate, and also to democratize data for tighter collaboration across teams.
- Shift-left and automate quality and stop bad code changes before they reach production
- Shift-right and automate deployments and release higher quality applications more frequently
- And automate operations so that you can auto-mitigate and self-heal bad deployments in production.
Digital experiences matter
Insight
Enterprises are striving to accelerate innovation without putting customer experiences at risk, but it’s not just traditional end-customer experiences of web and mobile apps at risk. Apps build on VMware Tanzu support a broad range of services and audiences that are reliant on the emerging paradigm of machine-to-machine (M2M) and Internet of Things (IoT) connections.
- The consumerization of IT has evolved to include wearables, smart homes, smart cars and life-critical health devices
- Corporate employees are increasingly working remotely and need access to systems that are in the corporate datacenter and cloud based
- Employees using office workspaces rely on smart office features for lighting, temperature, safety, and security
What was simply regarded as user experience has evolved and grown into digital experience, encapsulating end-users, employees, and IoT.
Challenge
Enterprise IT departments face mounting pressure to accelerate their speed of innovation, while user expectations for speed, usability, and availability of applications and services increases unabated. Combined with the explosion of IoT devices and the increasingly vast array of technologies involved, managing and optimizing digital experiences while embracing high frequency software release cycles and operating complex hybrid cloud environments presents significant challenges.
If digital experiences aren’t measured, how can enterprises prioritize and react when problems occur? Are they even aware there are problems? And if experiences are quantified, is it in the context of the supporting applications, services, and infrastructure that permit rapid root-cause analysis and remediation? Only enterprises able to deliver extraordinary digital customer experiences will stay relevant and prosper.
Key consideration
Enterprises need confidence that they’re delivering, or on the path to delivering, exceptional digital experiences in increasingly complex environments. To achieve this, they require real-time monitoring and 100% visibility across all types of customers, employees, and machine-based experiences. Key things to look for include:
— Dynatrace CIO Complexity Report 2018
Dynatrace helps you build better software faster
Dynatrace's all-in-one platform provides intelligence into the performance of your apps, underlying infrastructure, experience of users, and more, so you can automate IT operations, release better software faster, and deliver unrivaled digital experiences.
Dynatrace + VMware Tanzu:
A powerful partnership
Transform your digital business faster with Dynatrace & VMware Tanzu
With Dynatrace and VMware Tanzu, organizations can:
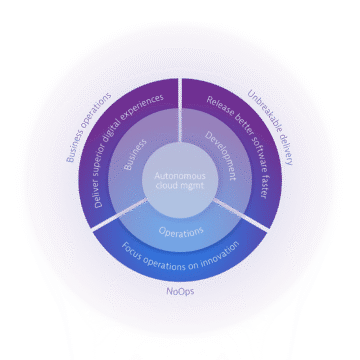
- Release better software, faster. Build an unbreakable delivery pipeline and enable self-healing, so you can focus on innovation, not troubleshooting.
- Automate and modernize cloud operations. Ensure cloud success while optimizing resources and rationalizing tools with automated, AI-powered monitoring.
- Deliver perfect software experiences. Ensure perfect experiences by seeing every customer’s journey from their perspective, in the context of your app and infrastructure performance.
Power and scale: Native VMware Tanzu integration
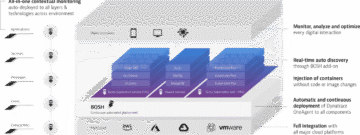
Dynatrace natively embeds OneAgent technology through VMware Tanzu virtual machine extensions, making it the most powerful cloud monitoring solution available for this cloud platform.
One-click deployment delivers the full picture of how Dynatrace builds on top of the productivity, intelligence, and hybrid capabilities of VMware Tanzu.
A Leader in the 2025 Gartner® Magic Quadrant™ for Observability Platforms
Read the complimentary report to see why Gartner positioned us highest for Ability to Execute in the latest Magic Quadrant.
This graphic was published by Gartner, Inc. as part of a larger research document and should be evaluated in the context of the entire document. The Gartner document is available upon request from Dynatrace. Dynatrace was recognized as Compuware from 2010-2014.

Trusted by thousands of top global brands


Try it free

Additional Ebooks
DXC + Dynatrace: Master cloud complexity with AI-powered observability
AI-Powered Observability for Financial Services IT Leaders
Business Observability in Action: Dynatrace eBook
Outpacing the Legacy Trap: Dynatrace’s Blueprint for Advancing Observability with Bank of America
AI adoption starts with observability
6 challenges enterprise face and how Dynatrace solves them
Attack Surface Checklist for Cloud & Kubernetes
The importance of business observability for enhanced success

The Developer’s Guide to Observability
eBook: Maximize business outcomes with modern log management

Beyond monitoring: Analyze, automate, and innovate faster with AI-powered observability
State of Observability 2025: The control plane for AI transformation
The impact of digital experience on the business
The Dynatrace Approach to Kubernetes

Five strategies to reduce tool sprawl
Kubernetes in the Wild report 2025: New trends

Why the cloud needs observability

Kubernetes platform observability best practices guide
Use Grail to ingest and analyze logs at scale

Answers to the top 6 privacy and security questions
How to make technology your strategic advantage

5 infrastructure monitoring challenges and their impact

6 Best Practices for upgrading from Dynatrace Managed to SaaS

Redefining the customer journey with application optimization

Delivering on the potential of application optimization

5 trends shaping the future of digital transformation

Fighting tool sprawl with unified observability
