
The promise of AI
Enable autonomous operations, boost innovation, and offer new modes of customer engagement by automating everything.
AI is driving the next innovation cycle in enterprise software, enabling new levels of intelligent automation and vertical integration. As today’s enterprise systems increase in size, the benefits of digitization and cloud computing go hand-in-hand with technological complexity and operational risks. AI-powered software intelligence holds the promise to tackle these challenges and enable a new generation of autonomous cloud enterprise systems.
Beyond error detection, towards self-healing
Consider this all-too-familiar challenge: An anomaly in a large microservice application triggers a storm of alerts as services around the globe are impacted. As your application contains literally millions of dependencies, how do you find the original error? Conventional monitoring tools are not much help. They collect metrics and raise alerts, but they provide few answers as to what went wrong in the first place.
In contrast, envision an intelligent system that accurately provides the answers—in this case, the technical root cause of the anomaly and how to fix it. Such intelligence, if accurate and reliable, can be trusted to trigger auto- remediation procedures before most users even notice a glitch.
AI and automation are poised to radically change the game in operations. And even more, it's about collecting and applying intelligence along the entire digital value chain, from software development through service delivery all the way to customer interactions. Smart integration and automation will drive the next innovation cycle in enterprise software.
A proven record in AIOps
Dynatrace helps the world’s most recognized brands to simplify cloud complexity and accelerate digital transformation. Davis®—our deterministic, causation-based AI engine — was built into the fabric of the Dynatrace software intelligence platform four years ago, at a time when cloud computing became mainstream and conventional monitoring tools hit a wall. Since then, many leading global brands have relied on Dynatrace and our AIOps platform to accurately and reliably identify the root cause of performance problems while automating Ops, DevOps, and business processes.
How to avoid closing down 500 supermarkets on a busy Saturday:
Coop, Denmark’s largest food retail group, celebrated its 150th anniversary by digitizing its business and moving 80% of their core apps into the cloud.
In 2016, Coop launched their new customer loyalty solution and an updated point-of- sale software. Despite extensive testing, a problem developed soon after the launch in production—checkout registers froze when trying to print out receipts. Suddenly, Coop was facing the prospect of having to close 500 of its stores on a busy Saturday morning because its payment systems were down.
However, two minutes after the first problems occurred in a couple of stores, the Dynatrace monitoring software was able to pinpoint the root cause, a lack of CPU power in the Azure cloud. A major breakdown was avoided by simply spinning up additional resources on the fly.
The AI paves the way for autonomous operations, enabling us to create auto-remediation workflows that remove the need for human intervention.
Anomaly detection and alerting
Insight
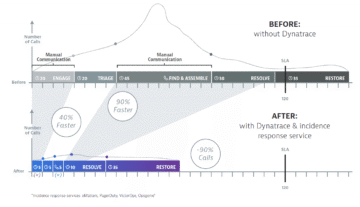
The concept of automating operations revolves around better troubleshooting, with the ultimate goal to reduce the Mean Time To Recovery (MTTR). This is accomplished through automatic anomaly detection and alerting, i.e., speedy Mean Time To Discovery (MTTD). However, further reduction of MTTR require automatic root cause analysis.
Challenge
Traditional monitoring tools focus on application performance metrics and baselining methods to distinguish normal from faulty behavior. Defining the anomaly thresholds turns out to be a tricky task that requires advanced statistics like machine learning. However, even the best baselining methods prove to be inadequate when it comes to the cloud. With modern microservice architectures, a single fault impacts a multitude of connected services which subsequently also fail. Therefore, a single problem typically triggers many alerts, which are all justified. This is called an alert storm or noisy alerts. Conventional monitoring solutions fall short of resolving this issue. It remains up to human operators to make sense of the alerts. Problem triage becomes a time consuming and often frustrating exercise involving war rooms and graveyard shifts. The only way out is a reliable method for determining the underlying root cause automatically.
Fine-tuning individual baselines helps, but it does not fix alert storms. For a real cure, we need to step outside the box and try to find the underlying root cause directly.
There are two very distinct AI-based approaches to reduce alert noise:
Getting the best monitoring data
Insight
In an environment of disparate monitoring tools, operations personnel are left to make sense of multiple diverse inputs coming from various sources. This increases the likelihood of error in situational awareness and diagnosis.² Currently, only 5% of applications are monitored. The aim is to get full end-to-end visibility.
Challenge
Full system visibility is a necessary precondition for automating operations including solid self-remediation. We need full insight not only into the application—including containers and functions-as-a-service—but also into all layers of the cloud infrastructure, networks, the CI/CD pipeline, and the real user experience. In many cases, data collection itself comes for free, as all major public cloud providers offer monitoring APIs, and open-source tools are abundantly available. However, the following considerations are critical:
- How much manual effort is required for instrumentation and deployment of updates?
- Can the monitoring agents inject themselves into ephemeral components like functions or containers, and do configuration changes require additional manual instrumentation?
- Are the metrics coarsely sampled or high-fidelity?
- Is there enough meta-information and context to build a unifying data model?
Rich data in context
In order to accomplish true root cause analysis, the collected data need to be high-fidelity (minimal or no sampling) and context-rich in order to create real-time topology and service flow maps.
Topology map
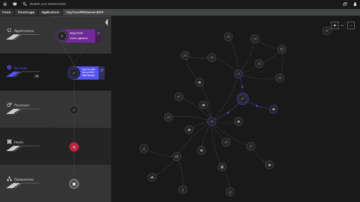
A topology map captures and visualizes the entire application environment. This includes the vertical stack (infrastructure, services and processes) and the horizontal dependencies, i.e. all incoming and outgoing call relationships. Leading monitoring solutions provide auto-discovery of new environment components and near real-time updates.
Service flow map
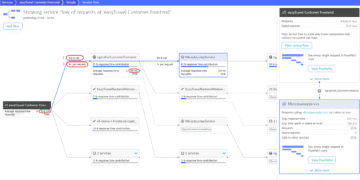
A service flow map offers a transactional view that illustrates the sequence of service calls from the perspective of a single service or request. The difference to topologies is that service flows display step-by-step sequence of a whole transaction while topologies are higher abstractions and only show general dependences. Service flows require high fidelity data with minimal or no sampling.
AI Operations and Root Cause Analysis
Insights
Enterprises without AI attempt the impossible. Gartner predicts 30% of IT organizations that fail to adopt AI will no longer be operationally viable by 2022.³ As enterprises embrace a hybrid, multi-cloud environment, the sheer volume of data and massive environmental complexity will make it impossible for humans to monitor, comprehend, and take action.
Challenge
We are quickly entering a time when humans will no longer be the main actors to fix IT problems or push code into production. Cloud and AI solutions revolve around automation, so DevOps won’t require nearly as much human intervention in the future. For AIOps (truly autonomous cloud operations) to work perfectly, we need a system that can not only identify that something is wrong, but pinpoint the true root cause. Modern, highly dynamic microservice architectures run in hybrid and multi-cloud environments. Infrastructure and services are spun up and killed within the blink of an eye as loads demand. Determining the root cause of an anomaly requires exponentially more effort than humans can take on.
Root cause analysis with deterministic AI
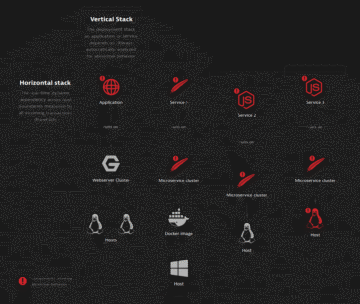
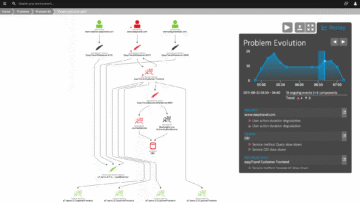
Davis—the Dynatrace AI engine — uses the application topology and service flow maps together with high-fidelity metrics to perform a fault tree analysis. A fault tree shows all the vertical and horizontal topological dependencies for a given alert. Consider the following example visualized in the chart to the right.
- A web app exhibits an anomaly, like a reduced response time (see top left in the graphic).
- Davis first “takes a look” at the vertical stack below and finds that everything performs as expected—no problems there.
- From here, Davis follows all the transactions and detects a dependency on Service 1 that also shows an anomaly. In addition, all further dependencies (Services 2 and 3) exhibit anomalies as well.
- The automatic root-cause detection includes all the relevant vertical stacks as shown in the example and ranks the contributors to determine the one with the most negative impact.
- In this case, the root cause is a CPU saturation in one of the Linux hosts.
Deterministic AI automatically and accurately determines the technical anomaly root cause. This is a necessary precondition for true AIOps. We’ll go deeper into the requirements auto-remediation in the next sections.
Understanding problem evolution
Deterministic fault tree analysis yields precise, explainable results. This can be used to replay the evolution and resolution of a problem step by step and visualize the affected components in a topology map. This is an extremely powerful feature because it allows the DevOps team to gain a deep understanding of the problem right from the get-go, cutting triage and research time to a minimum.
The problem evolution data is key for auto-remediation. Given that it can be accessed through APIs, remediation sequences can be triggered to resolve a problem with surgical precision and at a speed not achievable by human operators.
Impact analysis and foundational root causes
Most observability approaches require developers to manually instrument their code. In environments with tens of thousands of hosts and microservices that dynamically scale across global, multi-cloud infrastructure, this becomes a futile effort.
Insight
Infrastructure and services get spun up and killed as needed at a mind-boggling speed in a modern dynamic microservice application. That’s the nature of a healthy system. A disappearing container can be a desired event to optimize resources, or it can be a sign of an unintended disruption that requires immediate mitigation. The AI needs to be able to tell an anomaly from a desired change.
Challenge
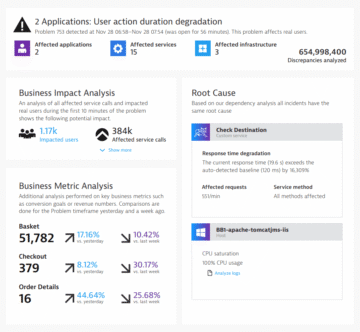
A precise and reliable determination of the technical root cause is absolutely essential for auto-remediation, but it is not sufficient. We also need a measure of an anomaly’s severity and some indication of what led to the technical root cause in the first place.
Impact severity
Not every disappearing container or host is a problem, and a slow service that nobody uses does not require immediate attention. Therefore, an advanced software intelligence system assesses the severity of a problem:
Foundational root causes
The technical root cause determines WHAT is broken.
The foundational root cause specifies WHY it is broken.
Typical foundational root causes are:
- Deployments: Collecting metrics and events from the CI/CD tool chain makes it possible to link a problem to a specific deployment (and roll it back if needed).
- Third-party configuration changes: These can relate to changes in the underlying cloud infrastructure or a third-party service.
- Infrastructure availability: In many cases, the shutdown or restart of hosts or individual processes causes the problem.
To determine the foundational root causes the AI engine needs to have access to metrics and events from the CI/CD pipeline, ITSM solutions, and other connected tools. Dynatrace provides an API and plug-ins to ingest third-party data into Davis.
Auto-remediation
Insight
Infrastructure as code and powerful cloud orchestration layers provide the necessary ingredients to automate operations and enable self-remediation. This will not only reduce operational cost but also avoid human error. The key to truly autonomous cloud operations is reliable system health information including deep anomaly root cause and impact analyzes.
Challenge
Many cloud platforms offer mechanisms to dynamically adjust resources based on load demand or restart unhealthy hosts and services. Some of these solutions are very advanced—however, they only work within their designed scope. Software intelligence solutions cover the entire enterprise system end-to-end, including hybrid environments where mainframes exist along multiple cloud platforms.
Enabling auto-remediation
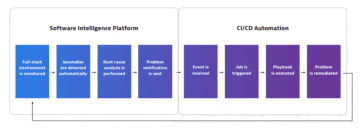
There are many ways of implementing auto-remediation in practice. Typically, the software intelligence platform integrates with CI/CD solutions or with cloud platform configuration layers to execute remediation actions. In any case, the software intelligence solution needs to provide full stack monitoring, automatic anomaly detection, precise root cause analysis and problem notification through APIs.
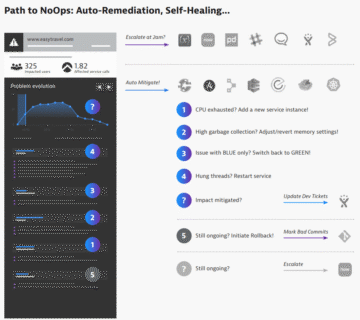
Complex auto-remediation sequences
This example shows how a precise analysis of the technical root cause, foundational root causes and user/business impact can be used to automate problem resolution through integration with a variety of CI/CD, ITOM, workflow and cloud technologies.
Automation and system integrations
Insight
Automation doesn’t stop at software operations and auto-remediation in an enterprise grade application environment. Accurate and explainable software intelligence has the capacity to move towards automating the entire digital value chain and to enable novel business processes.
— Verizon Enterprise
The unbreakable DevOps pipeline
Over the last years, many DevOps teams have come a long way in implementing a CI/CD pipeline that codifies and automates parts of the build, testing, and deployment steps. The goal is to speed up time to market and ensure excellent software quality—to get faster and better. AI-powered software intelligence helps to close existing automation gaps like manual approval steps at decision gates or build validation. It also provides valuable performance signatures to test new builds against production scenarios.
This follows the concept of “shift left”—to use more production data earlier in the development lifecycle to answer the question: "Is this a good or bad change that we try to push towards production?"
Automating customer service
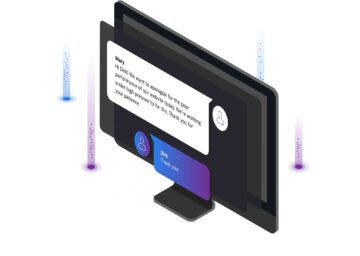
Any good software intelligence solution needs to include real user data, and an impact analysis (as described in chapter 4) can be used to ensure customer satisfaction even if something goes wrong. In case of a breakdown or slowdown, the system can engage autonomously with impacted users. One way is to open a chat window operated by a chatbot behind the scenes and inform the customer about the specific performance issue, then offer to make it up to them by providing discounts, etc.
Natural language interfaces
Insight
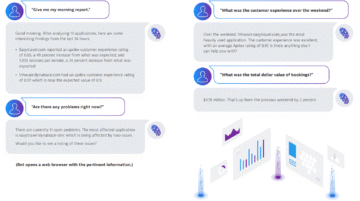
Virtual assistants have emerged as one of the fastest-growing areas of AI and exist in many forms, including voice bots, text bots, and SMS bots.⁵ These technologies have become mainstream with smartphones and home automation systems. When applied to software intelligence platforms, which usually require expert knowledge to navigate, natural language interfaces enable broad user adoption, organizational learning and innovation.
Challenge
Most people are not well-trained performance engineers, but everybody knows how to ask a question. To improve service quality in the eye of the customers, up-to-the-minute information on system health and business KPIs need to be available to customer service reps, PR and marketing specialists, business analysts, software developers and architects, and executive management across the board. Information and actionable knowledge can be democratized to allow for cross-departmental organizational learning and culture change.
Smart assistants meet software intelligence
A software intelligence solution that holds actionable insights about recent and current problems, their causes, and their impacts on users and the business is well suited for a new and convenient human user interface. With Dynatrace Davis Assistant users can simply ask a question verbally or use a text- based chat tool to interact with the software intelligence platform, and they’ll get a plain-language answer back within the second. Alternatively, for a deep dive, the bot can open a web browser and display the relevant charts. The ultimate level of system intelligence would be smart assistants that identify an error pattern, proactively suggest remediation actions, and only ask for approval to execute them.
A Leader in the 2025 Gartner® Magic Quadrant™ for Observability Platforms
Read the complimentary report to see why Gartner positioned us highest for Ability to Execute in the latest Magic Quadrant.
This graphic was published by Gartner, Inc. as part of a larger research document and should be evaluated in the context of the entire document. The Gartner document is available upon request from Dynatrace. Dynatrace was recognized as Compuware from 2010-2014.

Trusted by thousands of top global brands


Try it free

Additional Ebooks
DXC + Dynatrace: Master cloud complexity with AI-powered observability
AI-Powered Observability for Financial Services IT Leaders
Business Observability in Action: Dynatrace eBook
Outpacing the Legacy Trap: Dynatrace’s Blueprint for Advancing Observability with Bank of America
AI adoption starts with observability
6 challenges enterprise face and how Dynatrace solves them
Attack Surface Checklist for Cloud & Kubernetes
The importance of business observability for enhanced success

The Developer’s Guide to Observability
eBook: Maximize business outcomes with modern log management

Beyond monitoring: Analyze, automate, and innovate faster with AI-powered observability
State of Observability 2025: The control plane for AI transformation
The impact of digital experience on the business
The Dynatrace Approach to Kubernetes

Five strategies to reduce tool sprawl
Kubernetes in the Wild report 2025: New trends

Why the cloud needs observability

Kubernetes platform observability best practices guide
Use Grail to ingest and analyze logs at scale

Answers to the top 6 privacy and security questions
How to make technology your strategic advantage

5 infrastructure monitoring challenges and their impact

6 Best Practices for upgrading from Dynatrace Managed to SaaS

Redefining the customer journey with application optimization

Delivering on the potential of application optimization

5 trends shaping the future of digital transformation

Fighting tool sprawl with unified observability
