As companies accelerate digital transformation, they implement modern cloud technologies like serverless functions. According to Flexera, serverless functions are the number one technology currently evaluated by enterprises and are one of the top five cloud technologies in use by enterprises. The elasticity of serverless services means they can scale as needed, for example, to handle traffic spikes during periods of peak load, and to offer flexibility so that customers only pay for what they use. With this evolution, Functions-as-a-Service (FaaS) are quickly being adopted by enterprises to run granular functions at low cost.
Observability is essential for ensuring the reliability, security, and quality of software systems. Observability helps developers and operators identify and troubleshoot issues, optimize performance, and improve user experience.
However, serverless applications have some unique characteristics that make observability more difficult than in traditional server-based applications. In this blog post, we’ll discuss some of these challenges and how you can overcome them.
What are serverless applications?
Serverless applications are comprised of event-driven functions that run on demand in response to triggers from various sources, such as HTTP requests, messages, or timers. These functions are executed by a serverless platform or provider (such as AWS Lambda, Azure Functions, or Google Cloud Functions) that manages the underlying infrastructure, scaling, and billing.
Serverless applications have several benefits over server-based applications:
- They eliminate the need to provision, manage, and maintain servers or containers.
- They scale automatically based on the demand and traffic patterns.
- They only charge for the resources consumed during the execution time of the functions.
- They enable faster development and deployment cycles by abstracting away infrastructure complexity.
However, serverless applications also introduce some trade-offs and challenges:
- Limited control over the execution environment and configuration of functions.
- Higher latency and cold start issues due to the initialization time of functions.
- More complex dependencies and interactions among different services and components.
- Less visibility into the internal state and behavior of functions.
Why is observability challenging in serverless applications?
Observability is typically achieved by collecting three types of data from a system: metrics, logs, and traces. Collecting these data types from serverless applications is not straightforward due to their ephemeral nature. Serverless functions are stateless, short-lived, and unpredictable. They can be invoked at any time from any source with varying frequency and duration. They can also be executed in parallel on different instances with different configurations. This makes it hard to track their lifecycle, contextualize their behavior, and correlate their activities.
Moreover, serverless platforms have different levels of support for observability tools and features. Some platforms provide built-in metrics, logs, and traces for serverless functions, while others require additional configuration or integration with external services or agents.
Therefore, observability challenges in serverless applications can be categorized into three dimensions:
- Data collection – How to collect metrics, logs and traces from serverless functions efficiently, reliably, and consistently
- Data visualization – How to present, explore, and interpret observability data from serverless functions intuitively, clearly, and holistically
- Data analysis – How to process, aggregate, and query observability data from serverless functions effectively, accurately, and comprehensively
Enhanced automation and intelligence for AWS Lambda, Azure Functions, and Google Cloud Functions end-to-end observability
The Dynatrace platform was built to help enterprises overcome their cloud complexity challenges with massive scale, continuous automation, Dynatrace Davis® AI to automatically identify issues before they impact customers, and serverless support as core capabilities.
For this, Dynatrace provides the most comprehensive support for observability across all cloud vendors, including serverless technologies such as AWS Lambda, Azure Functions, and Google Cloud Functions.
- Simple and unified integration that captures platform metrics from AWS CloudWatch, Azure Monitor, and Google Operations Suite.
- Automatic capture of application- and platform log data, in context so you can quickly drill into additional details.
- Distributed tracing integrations for all function runtimes, languages, and triggers, giving you end-to-end visibility to understand the impact and root cause of a problem, even within your most complex transactions.
For full details, see the complete matrix of Dynatrace support for serverless cloud services.
To enable all telemetry signals, you typically follow three steps:.
- Connect Dynatrace to your cloud vendor to gather relevant infrastructure monitoring data, which gives you essential health insights.
- Enable log collection either by centrally forwarding the logs to Dynatrace or using our latest enhancement for, for example, AWS Lambda to collect logs through Dynatrace AWS Lambda Layer directly at the edge to scale out log collection to any number of functions.
- Instrument your functions using either our cloud-native integrations, which give you automatic instrumentation simply by adding the Dynatrace AWS Lambda Layer or use a monitoring-as-code approach utilizing OpenTelemetry to add distributed tracing.
OpenTelemetry has been adopted by all cloud vendors as an open standard to expand their native monitoring solutions to provide or enhance visibility into their cloud services that support function triggers and bindings such as Http-Requests or queue events such as from Amazon SQS or Azure Service Bus.
Cloud vendors provide enhancements like resource detectors, pre-instrumented cloud-service SDKs and telemetry importer/exporters.
On top of these features, Dynatrace adds helper functionality for all platforms and languages including Python, .Net Core, Node.js, and GoLang to reduce the necessary boilerplate code to a minimum.
Dynatrace Documentation guides you with tutorials and best practices for applying instrumentation or using additional libraries such as AWS Distro for OpenTelemetry to gain deeper insights into your cloud services, for example, Amazon DynamoDB or connect your application logs with your performance data or transaction.
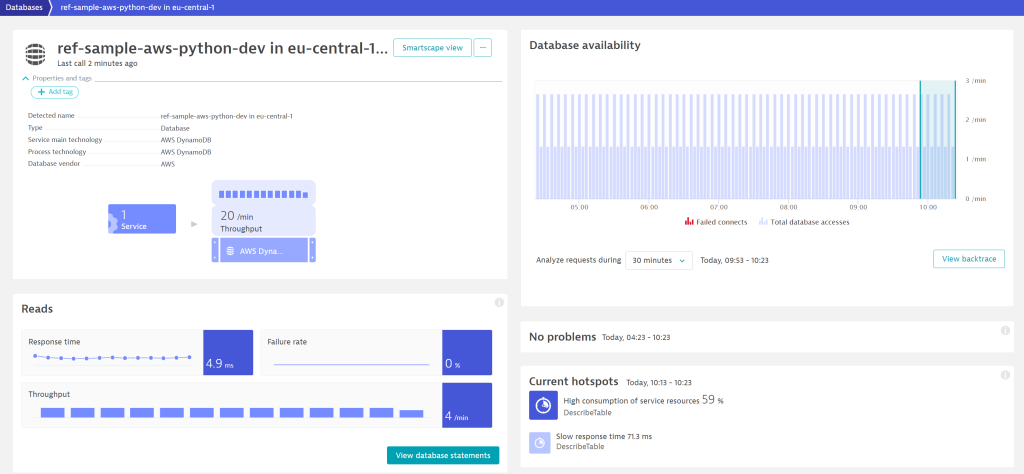
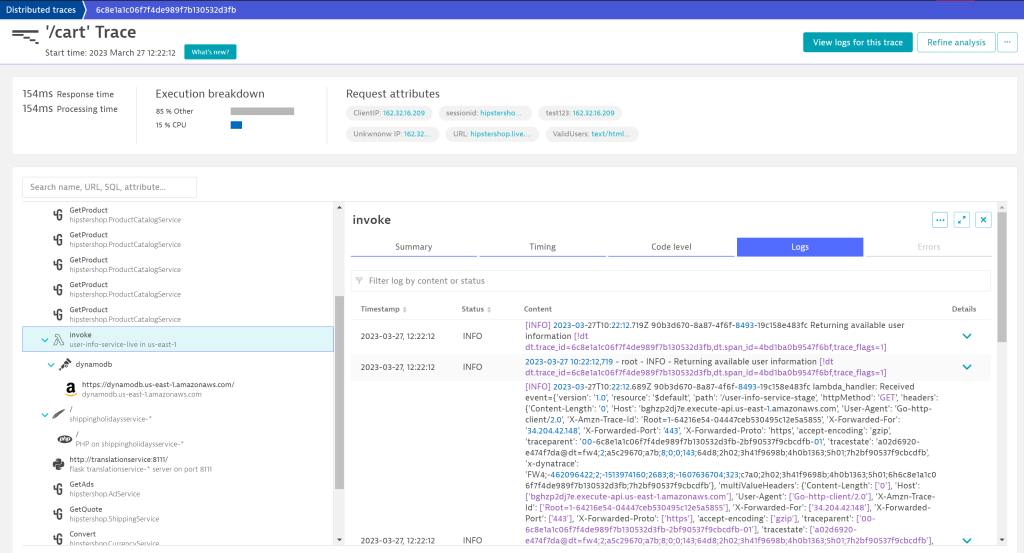
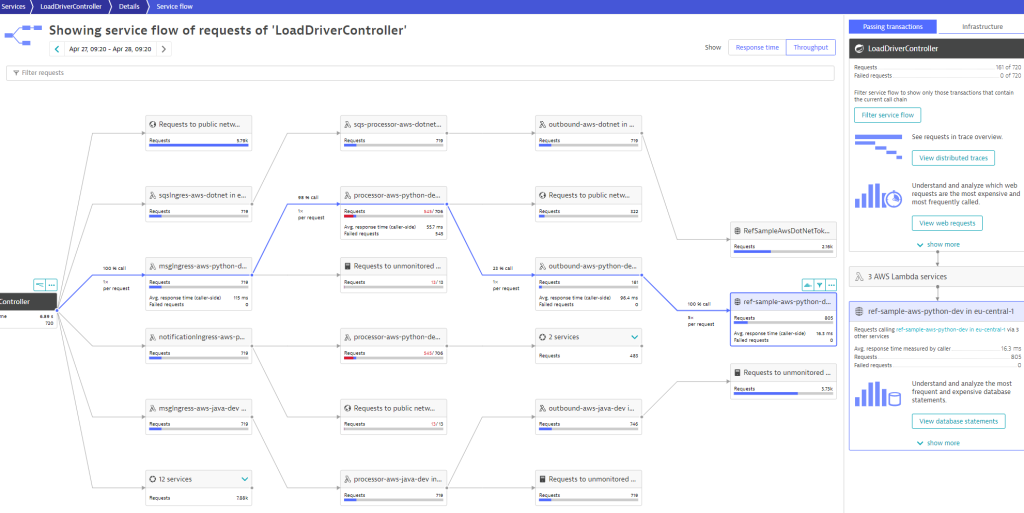
Once you enable your telemetry signals, Dynatrace provides you with a unified view across all the telemetry data captured from your various data sources.
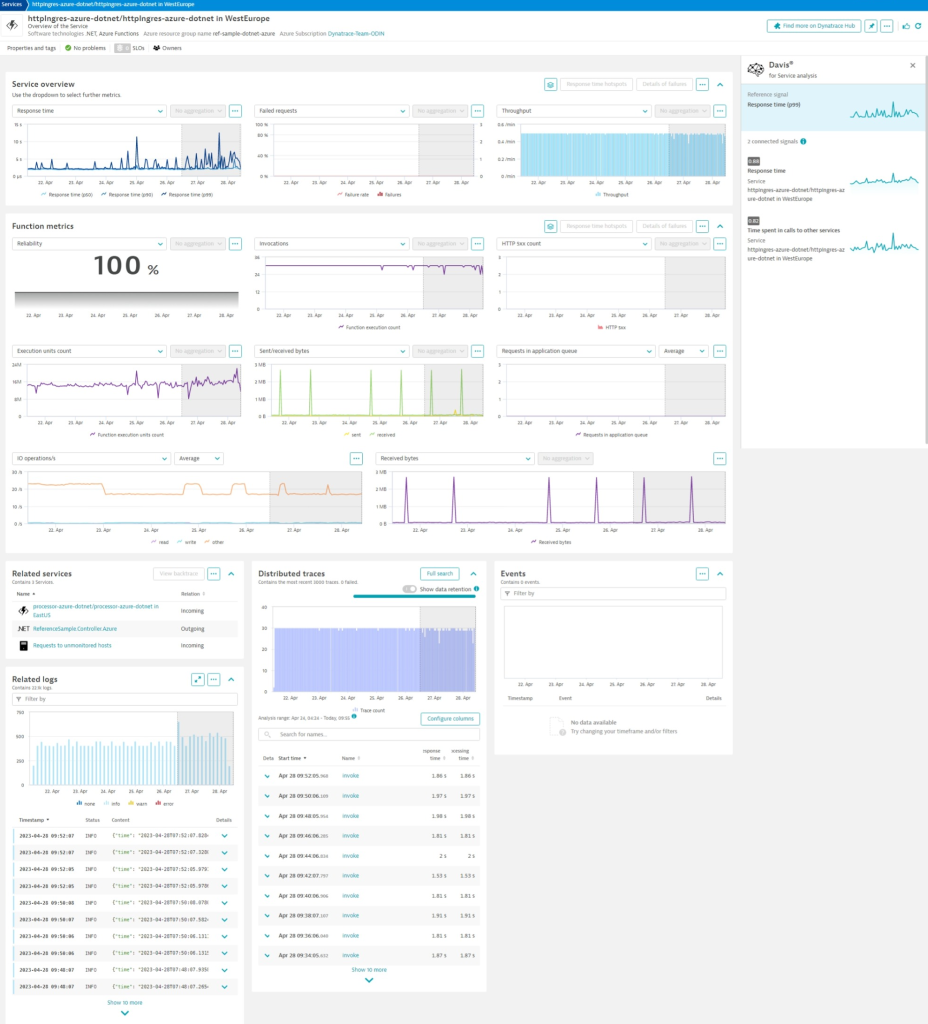
This makes it easy to explore the behavior of your serverless functions and identify the impact and root-cause of any detected anomalies. With Davis exploratory analysis, Dynatrace helps you understand correlations between anomalies across all your telemetry data. Such anomalies can be caused by function cold starts. Understanding cold-start behavior is essential to tuning your cloud application costs or performance to meet your operational needs.
Read more about function cold-starts in these cloud-vendor blog posts:
- Understanding serverless cold start | Azure-Blog und -Updates
- Lambda execution environments – AWS Lambda
- Faster cold starts with startup CPU Boost | Google Cloud
Get started with serverless observability with Dynatrace
To learn how Dynatrace provides extensive observability, including your serverless technologies, you can visit:
New to Dynatrace?
Sign up for a free trial.




Looking for answers?
Start a new discussion or ask for help in our Q&A forum.
Go to forum