The year is 2020 AD. The Go landscape is entirely occupied by the Dynatrace Software Intelligence Platform. Well, not entirely... One small group of statically linked Go applications still holds out against observation. This is the completely peaceful story of their surrender (no Go applications will be harmed during the transformation).
Organizations that want a high-performance language with a great ecosystem often write their applications in Go. Originally initiated at Google, Go—often referred to as Golang—is an open source programming language. Thanks to its simple and modern structure, it has gained popularity among many large technology companies from Uber to Dropbox. Even Kubernetes and Docker are written in Go.
The Dynatrace Software Intelligence Platform has long provided the industry’s first auto-instrumenting monitoring solution for Go. To take this further, we’re proud to announce that Dynatrace now also supports statically linked Go applications. With no required recompilation or code changes, you can:
- Monitor web-scale and highly dynamic microservice architectures including statically as well as dynamically linked Go applications and platform components.
- Optimize Go applications based on real-time data from production environments.
- Accelerate problem resolution and troubleshooting with our automatic root cause analysis.
- Improve cloud platform management with deeper insights into platform metrics.
Getting observability into statically linked applications ain’t that easy
The Go toolchain produces statically linked Go executables by default, as long as there are no dependencies on packages using cgo, like net or os/user from the Go standard library. Statically linked application binaries have their merits; they’re self-contained and they don’t have dependencies on the systems they’re deployed to.
However, the inability to load additional code dynamically at runtime prevents the injection of auto-instrumenting monitoring agents like Dynatrace OneAgent. With this approach, observability must be enabled either via manual source-code instrumentation or by forcing the application to be dynamically linked. However, changing build options or source code is cumbersome and not an option for prebuilt third-party applications.
Get fully automatic observability for your statically linked Go applications
The unique Dynatrace OneAgent for Go monitoring allows you to monitor your statically linked Go processes in the same way as is already possible for dynamically linked Go processes. No recompilation or code changes are required. It gives you fully automatic, code-level observability into your statically linked Go applications, enabling you to:
- Fully automate distributed tracing across HTTP and gRPC requests.
- Gain code-level insight not only into your own Go applications but also into third-party Go-based applications.
- Get always-on 24/7 code-level CPU profiling.
- Automatically monitor all important Go metrics.
- Do much more. See all the details in Dynatrace Help.
The recipe of the magic potion that takes away the pain was designed by the marvelous druids of the Dynatrace Go team (see photo below).

Activate Go static application monitoring
Go static application monitoring requires Dynatrace OneAgent version 1.203 and Dynatrace version 1.204.
This feature is an Early Adopter feature and is, therefore, disabled by default. To activate Go static application monitoring:
- Go to Settings > Monitoring > Monitored technologies > Go and select Edit.

- Turn on Enable Go static application monitoring on every host.

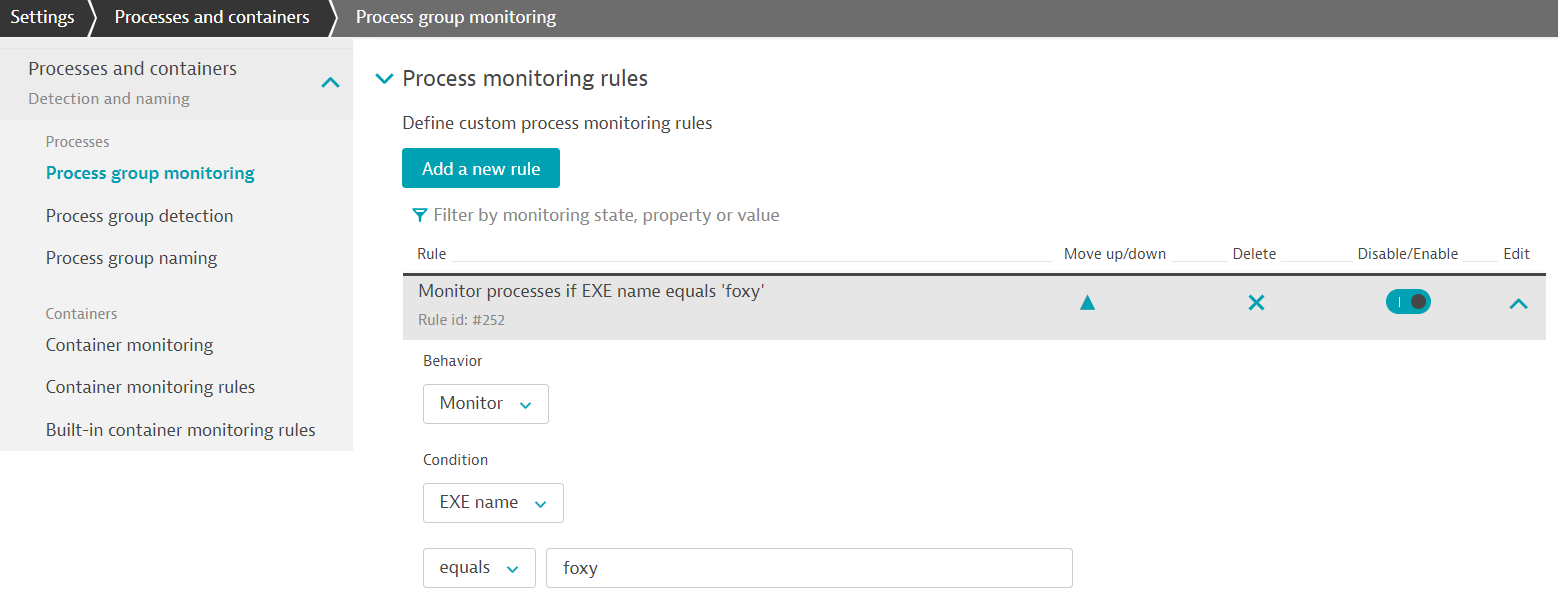
The next step for all Go applications is to create a process-monitoring rule that enables deep monitoring of each statically linked Go application. Read our blog post on process-group monitoring rules for more details, or check out the showcase described below.
Go static monitoring showcase
In End-to-end request monitoring for Go applications, we introduced foxy, a basic, application-specific forwarding proxy. It accepted requests from a Java-based load generator on port 8888 and forwarded the requests to the default port, 8086, of a locally running InfluxDB instance that was installed via the apt-get package manager.
package main

import (
   "net/http"
   "net/http/httputil"
)

func main() {
   http.HandleFunc("/", proxyHandler)
   http.ListenAndServe(":8888", nil)
}

func proxyHandler(w http.ResponseWriter, r *http.Request) {
   proxy := &httputil.ReverseProxy{
      Transport: &http.Transport{},
      Director: func(req *http.Request) {
         req.URL.Host = ":8086"
      },
   }

   proxy.ServeHTTP(w, r)
}
|
Building a web application like foxy that depends on the Go standard library net package results in a dynamically linked Go binary, because the default DNS name resolver requires cgo and its accompanying system libraries. However, many Go users force the Go toolchain to use the pure Go DNS name resolver by disabling cgo. As this post is about static Go application monitoring, the command CGO_ENABLED=0 go build foxy.go is used to enforce a statically linked foxy executable.
The following process monitoring rule enables Go static monitoring for foxy:
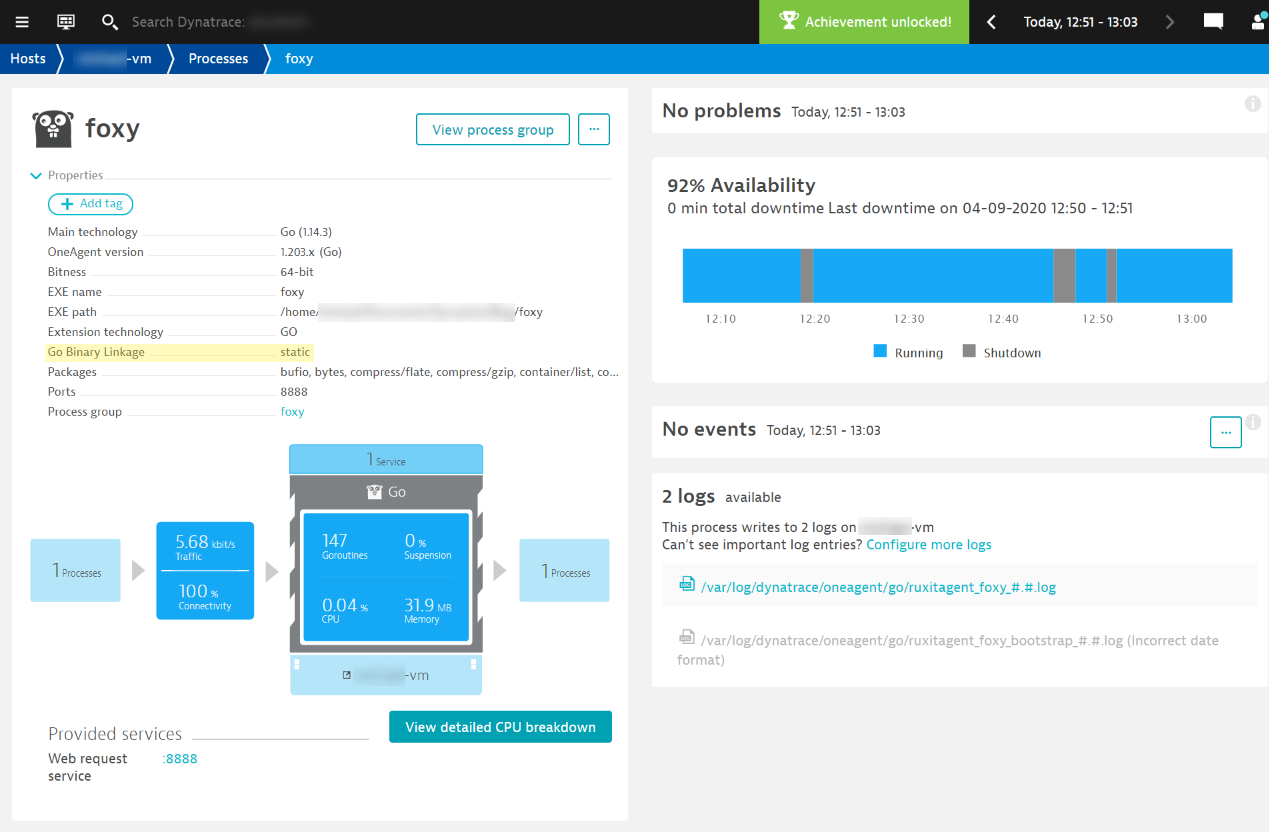
Dynatrace identifies foxy as a Go process and starts monitoring it automatically. The web request service hosted by the foxy process is detected and presented on the foxy process page. The property Go Binary Linkage shows that foxy is statically linked; this is the only difference from dynamically linked binaries.
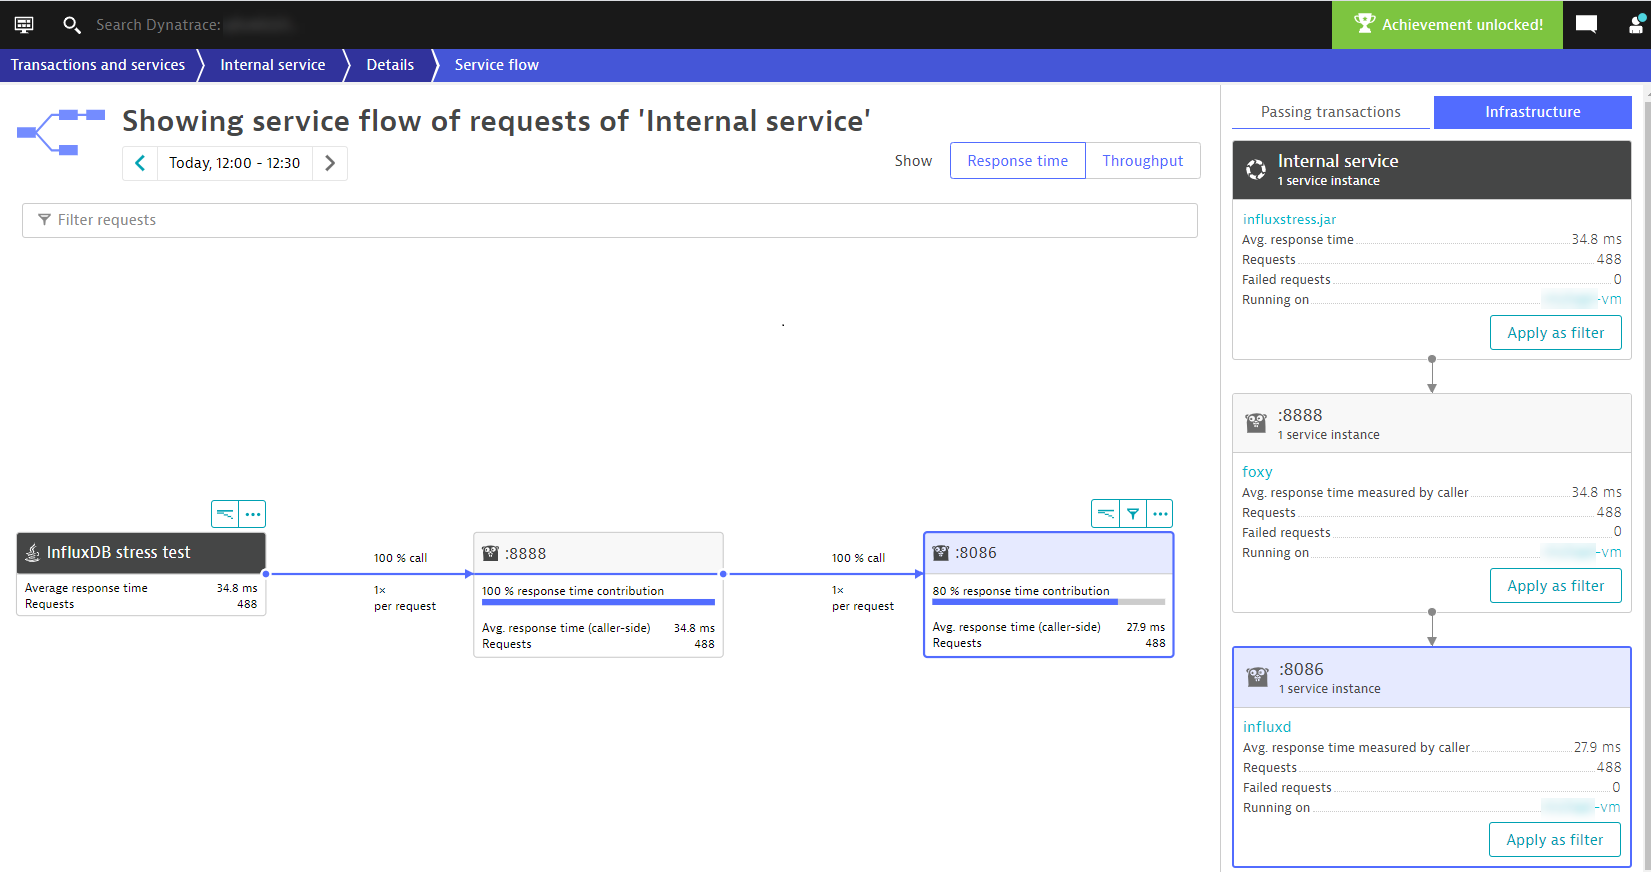
The Service flow and PurePath views reflect the whole setup. The PurePath provides basic code-level insights into the foxy request-processing mechanics.
Smooth and easy, isn’t it? Besides the Go Binary Linkage property being marked as static, there’s no difference between monitoring statically and dynamically linked Go binaries. All deep-monitoring features of OneAgent are supported in both cases.
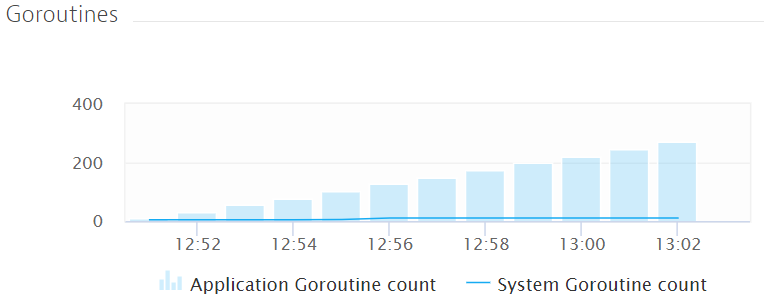
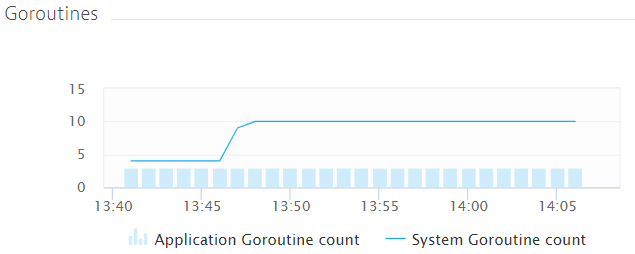
Upon checking the Go-specific metrics of the foxy process, a suspicious, continuous increase of goroutines can be observed.
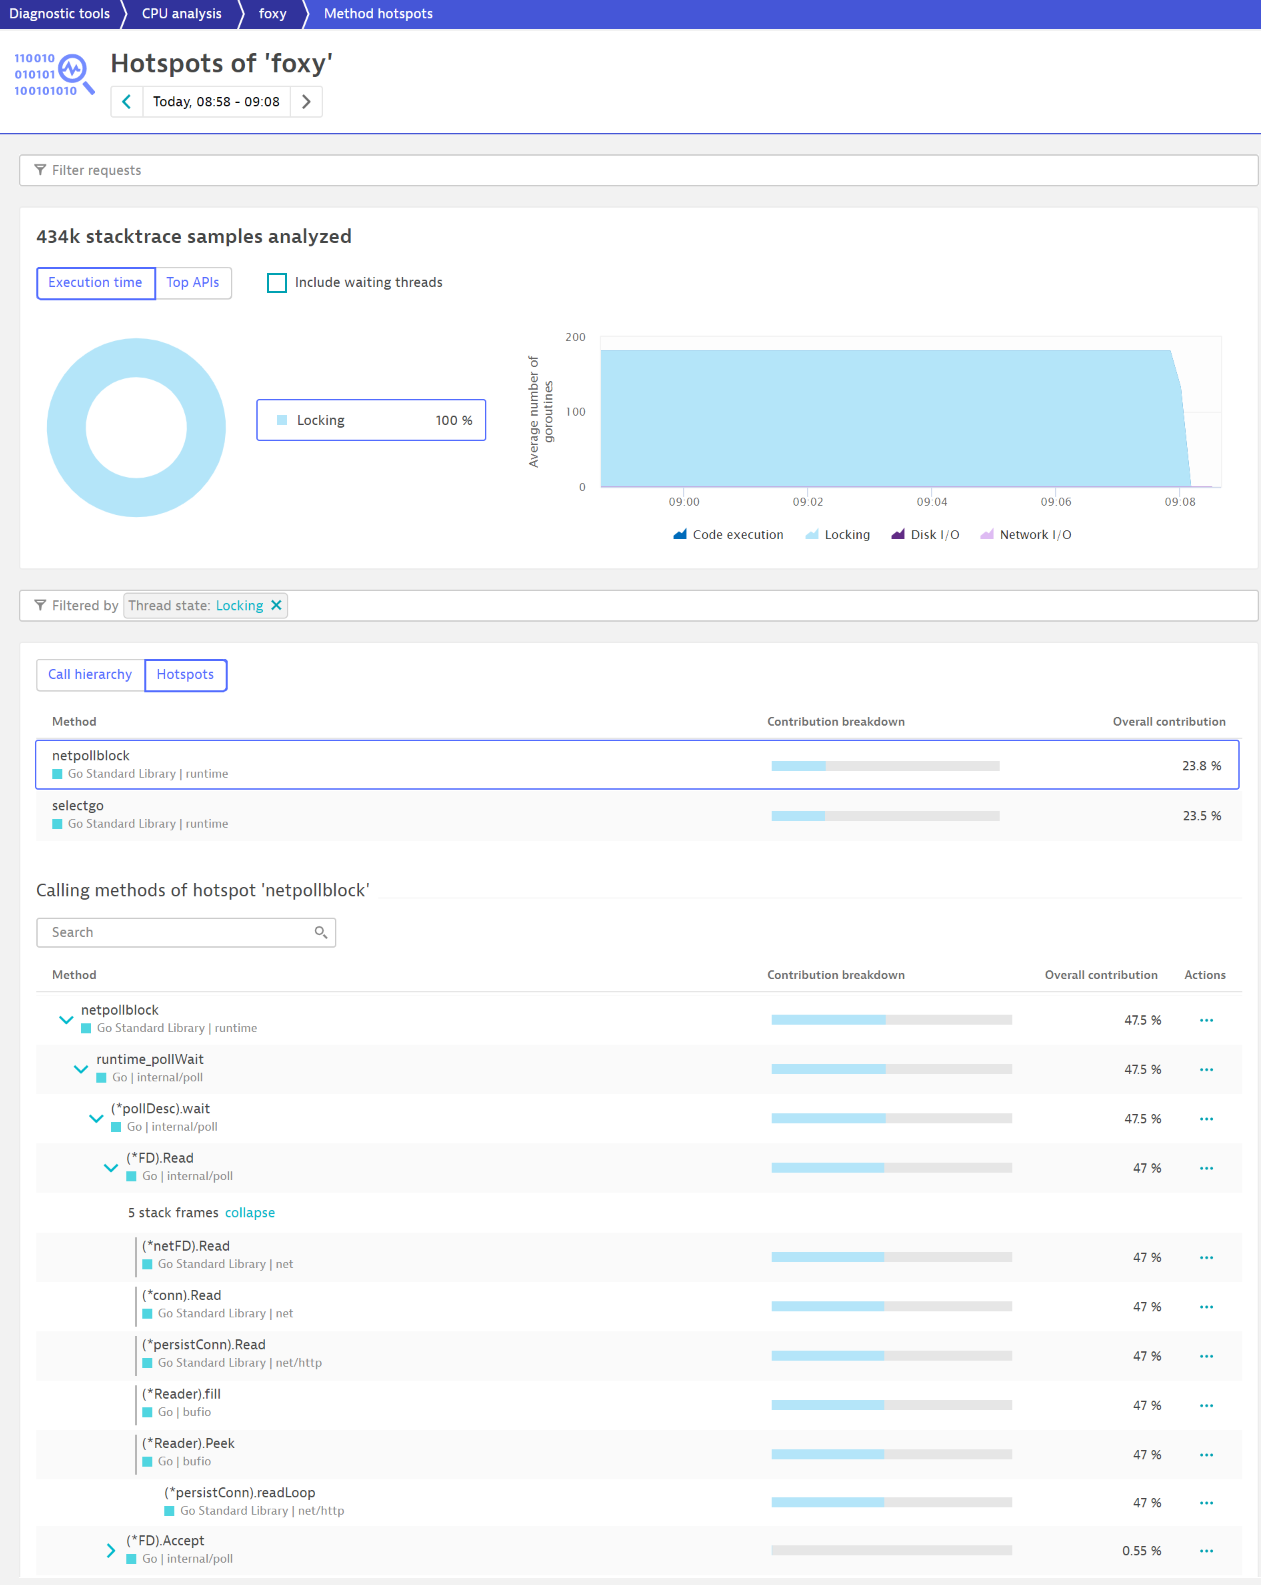
This indicates that the foxy application is probably suffering from a goroutine leak. A drill down into CPU analysis reveals the origins of these goroutines.
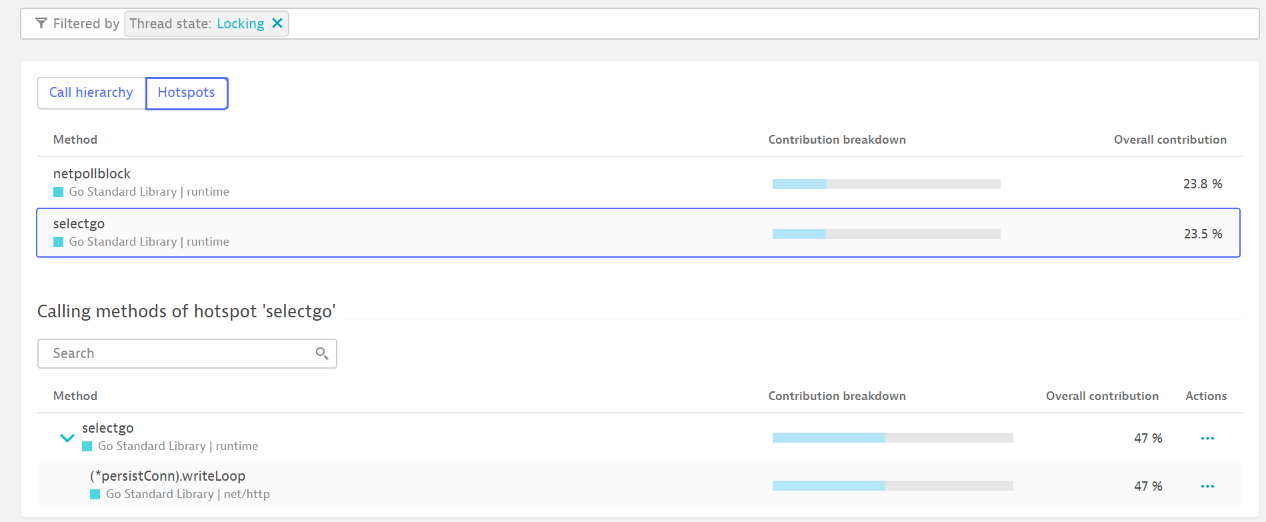
The method hotspots indicate that these goroutines seem to be locked while handling persistent HTTP connections. All the method hotspots were started on the net/http.(*persistConn) methods readLoop and writeLoop, which hints at the root cause for debugging. Checking the code references of these methods reveals that all leaking goroutines were started by the method type http.Transport, which is defined in the Go standard library package net/http:
func (t *Transport) dialConn(...) {
    // ...
    pconn.br = bufio.NewReader(pconn)
    pconn.bw = bufio.NewWriter(persistConnWriter{pconn})
    go pconn.readLoop()
    go pconn.writeLoop()
}
|
From http.Transport documentation:
By default,
Transportcaches connections for future reuse. This may leave many open connections when accessing many hosts. This behavior can be managed using Transport’sCloseIdleConnectionsmethod and theMaxIdleConnsPerHostandDisableKeepAlivesfields. Transports should be reused instead of created as needed.
This means that you shouldn’t create an http.Transport on every incoming request, because every instance keeps connections alive. In order to fix this problem, make sure that the ReverseProxy.Transport field isn’t set; this setting will lead to reuse of the default Transport instance that’s defined in net/http. Applying this change results in a stable number of goroutines.
Seeing is believing!
New to Dynatrace? Try out Go monitoring now by entering our free trial today. Already a customer? Go into your account and experience how Dynatrace can help you get the best out of your Go-based applications.
What’s next
There are many great new features ahead for Go application full-stack monitoring with Dynatrace. OpenTelemetry is a frequently used term in the Dynatrace Go team office, and (almost) zero-day support for new, minor Golang releases might not be too far out. So stay tuned!




Looking for answers?
Start a new discussion or ask for help in our Q&A forum.
Go to forum