A customer’s interaction with your online services sets the stage for their experience of doing business with you. If your digital experience is slow, unavailable, or difficult to work with, your risk of losing a customer to a competitor increases. Real user monitoring can help you catch these issues before they impact the bottom line.
Modern digital services are complex and will sometimes fail—that’s unavoidable. What you can avoid is having your customers discover those failures before you do.
What is real user monitoring?
Real user monitoring (RUM) is a performance monitoring process that collects detailed data about a user’s interaction with an application. Real user monitoring collects data on a variety of metrics. For example, data collected on load actions can include navigation start, request start, and speed index metrics.
A user session, also known as a click path or user journey, is a sequence of actions a user takes while working with an application. User sessions can be highly varied, even within a single application. For example, one user may fill in several fields, click multiple buttons, and upload a file, while another may click several other buttons and fail to upload the file. With RUM, you can collect data on each user action within a session, including the time required to complete the action, so you can begin to identify patterns and see where to make improvements.
Ideally, a solution should record all user actions to have a complete picture of a user’s experience. However, only highly scalable real user monitoring solutions can collect data on all user actions, while less scalable tools have to sample user actions and make inferences from partial data.
How real user monitoring works
Real user monitoring works by injecting code into an application to capture metrics while the application is in use. Browser-based applications are monitored by injecting JavaScript code that can detect and track page loads as well as XHR requests, which change the UI without triggering a page load.
Native mobile applications are monitored by adding the monitoring library directly to your mobile application package. Monitoring data is streamed from the application to a data store where it can be queried and visualized. Some real user monitoring tools include automatic instrumentation that makes them very quick and easy to set up, whereas others require more involved manual configuration.
Real user monitoring vs synthetic monitoring
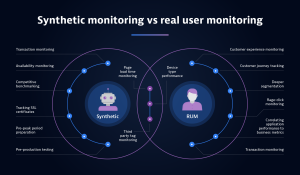
Real user monitoring is one of two kinds of user experience monitoring. The other is synthetic monitoring. Synthetic monitoring uses scripts to interact with an application rather than depend on actual users.

Whereas RUM can capture all the nuances of your real users, providing a true picture into their experience, synthetic monitoring is great for proactive simulation and testing of the expected user experience.
Especially useful is the ability of synthetic monitoring to collect data about a specific metric at regular time intervals, such as page load time. IT teams can deploy synthetic agents in different geographical regions, so you can detect variations in application performance based on geolocation.
Synthetic monitoring is also useful for developing baselines of performance. Since the same kind of operation is performed consistently over time, you can collect sufficient data to determine an expected level of performance for a particular application and configuration.
Synthetic monitoring has different use cases from real user monitoring, but they both play an important role in application performance monitoring (APM). Especially when used together, RUM and synthetic monitoring provide comprehensive insight into the digital experience.
Examples of real user monitoring
Virtually any application with a user interface can benefit from regular real user monitoring. Some examples include:
- Monitoring a retailer’s online catalog to detect any increase in page load times
- Analyzing a clinician’s clickstream when using an electronic medical record system to better improve the efficiency of data entry
- Detecting differences in performance when an application is accessed by different kinds of mobile devices
- Tracking users’ paths through the conversion funnel and using that data for attributing revenue
- Providing insight into the service latency to help developers identify poorly performing code
Want to learn more? Join us for the on-demand performance clinic, How to monitor your Digital Marketing Campaigns with Dynatrace.
Benefits and limitations of RUM
Real user monitoring provides substantial benefits. The primary benefit of RUM is it provides insights into users’ actual experiences when interacting with an application. This can help to identify performance issues before too many users experience them. Teams can use data collected by RUM to verify service level agreements (SLAs) are being met. And UX designers can use that data to better understand how users interact with an application and how developers can streamline the interface.
There are also some limitations of real user monitoring. For example, because real user actions vary widely, it is difficult to use RUM to generate baselines of performance over time. Also, RUM generates large volumes of data, so it is important to have query and visualization tools that allow RUM users to quickly identify key information latent in the data.
It is also difficult to have adequate visibility into the context of the user’s experience in the moment. RUM solutions can benefit from the ability to have a movie-like replay to see exactly what the user does and understand what’s happening behind the scenes.
RUM depends on users actively engaging with a service. When there is low usage — for example, during off-hours — there is little RUM data to work with. Similarly, if you are about to deploy a new version of a service, you won’t have RUM data on the new version until customers start working with it. This can undermine one of the top reasons to monitor services, which is to help detect problems before your customers do. This is one area where synthetic monitoring can help to fill the gaps.
Best practices for RUM
To leverage the greatest benefits of real user monitoring, keep in mind several best practices.
- Establish business objectives for how you use RUM. These should be quantifiable goals that you can use data to help you achieve. For example, you may want to decrease abandoned carts by 10%. Having a specific goal like this in mind can help to focus development efforts and help to determine what aspects of user behavior to look at.
- Link RUM business objectives to technical goals. Technical goals should be able to quantify business goals. For example, RUM is often used to measure latency, and the relationship between longer latencies and user disengagement is well documented. When using RUM to measure technical performance, keep in mind how that ties back to overall business goals.
- Measure RUM for mobile and web-based apps. In addition, be sure to include mobile RUM as well as web-based RUM. The performance characteristics of mobile devices can vary widely. RUM can help you identify performance problems in mobile apps and devise ways to mitigate those issues.
- Include RUM in your test environments. You wouldn’t deploy code that hasn’t passed basic functional tests, and you should have similar tests for RUM. Also, integrating data from other observability data, such as monitoring, logging, and distributed tracing, can help to identify the root cause when problems do occur.
User experience meets business impact
Quickly see if applications are performing as customers expect, get AI-powered answers to proactively address issues before end users are impacted, and drive better business outcomes.
What to look for in RUM solution
When choosing a real user monitoring solution, maximize your value by looking for a solution that combines powerful RUM capabilities with an all-in-one observability platform. Observability gives you comprehensive front-to-back insight into what your users are experiencing and why it’s happening.
The optimal RUM solution is integrated with AI-powered distributed tracing that enables observability into complex, distributed cloud-native applications. Integration with backend data from monitoring and logging services lets you trace the root cause of problems in the user experience with infrastructure or application issues. This end-to-end observability enables you to quickly take action and deliver better digital experiences.
In addition, look for solutions that capture a comprehensive view of users’ sessions. Tools that only sample data can leave you with blind spots in your users’ experiences. Without sufficient coverage, sampling can miss instances of poor performance and could delay your time to detect a significant issue. Furthermore, the ability to enhance RUM data with business context like revenue and voice-of-customer data enables you to understand the business impact of application performance and user experience so you can drive better business outcomes.
A solution that also includes session replay capabilities allows you to understand the full context of a user’s actions. Session Replay creates video-like playbacks of a recorded user session, allowing for a level of visibility into user sessions that isn’t possible when viewing metrics out of context. Session Replay should support fast deployment life cycles and protected resources. Replay can help you understand the context of the user’s experience, which in turn can guide new features or performance improvements.
Dynatrace’s real user monitoring solution scales to meet the needs of cloud-native applications, including full data capture, provide enhanced visualization, and Session Replay. With the full benefit of an automatic and intelligent observability platform, Dynatrace integrates RUM with cloud infrastructure and business context data for full visibility into the user experience.
You can learn more about real user monitoring and request a demo here.


Looking for answers?
Start a new discussion or ask for help in our Q&A forum.
Go to forum