Waterfall analysis is a great tool for viewing detailed information about the various resources that comprise your user actions. When analyzing modern web applications, waterfall analysis can become quite complex and initially overwhelming. To make it easier for you to understand at a glance some of the key insights that Dynatrace discovers, we’ve introduced a Findings section to each Waterfall analysis page.
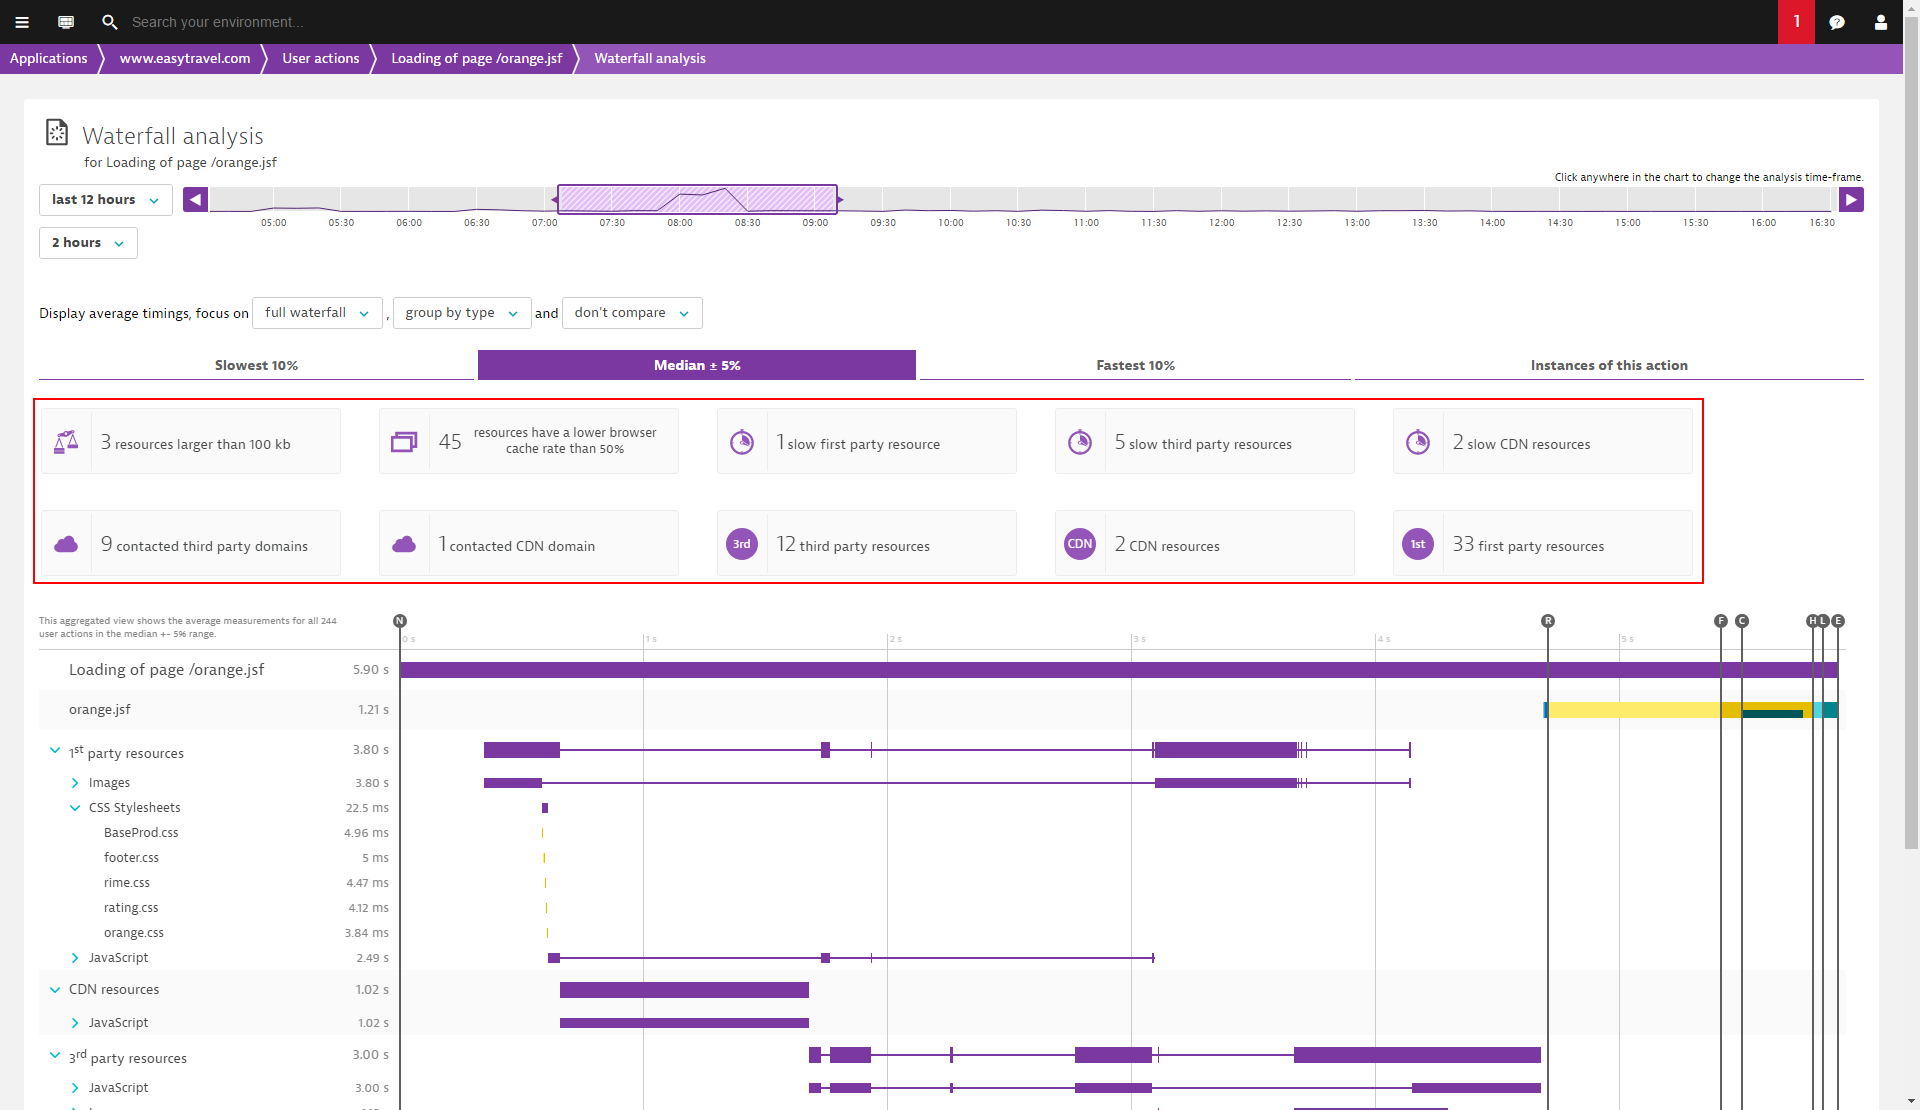
For each user action viewed in Waterfall analysis, the following findings are now automatically identified and presented (see example below):
- Uncompressed text resources
- Resources larger than 100kb
- Resources that have a browser cache rate lower than 50%
- Slow first party, third party, or CDN resources (> 200 ms)
- Contacted third party and CDN domains
- First party, third party, and CDN resources
To access waterfall analysis for a user action
- Select Applications from the navigation menu.
- Select the application that provides the user action you want to analyze.
- Scroll down to the Top 3 user actions section of the Application page.
- Select a user action (or click View full details to access additional user actions).
- On the User action page, click the View analysis in waterfall chart button to open Waterfall analysis.
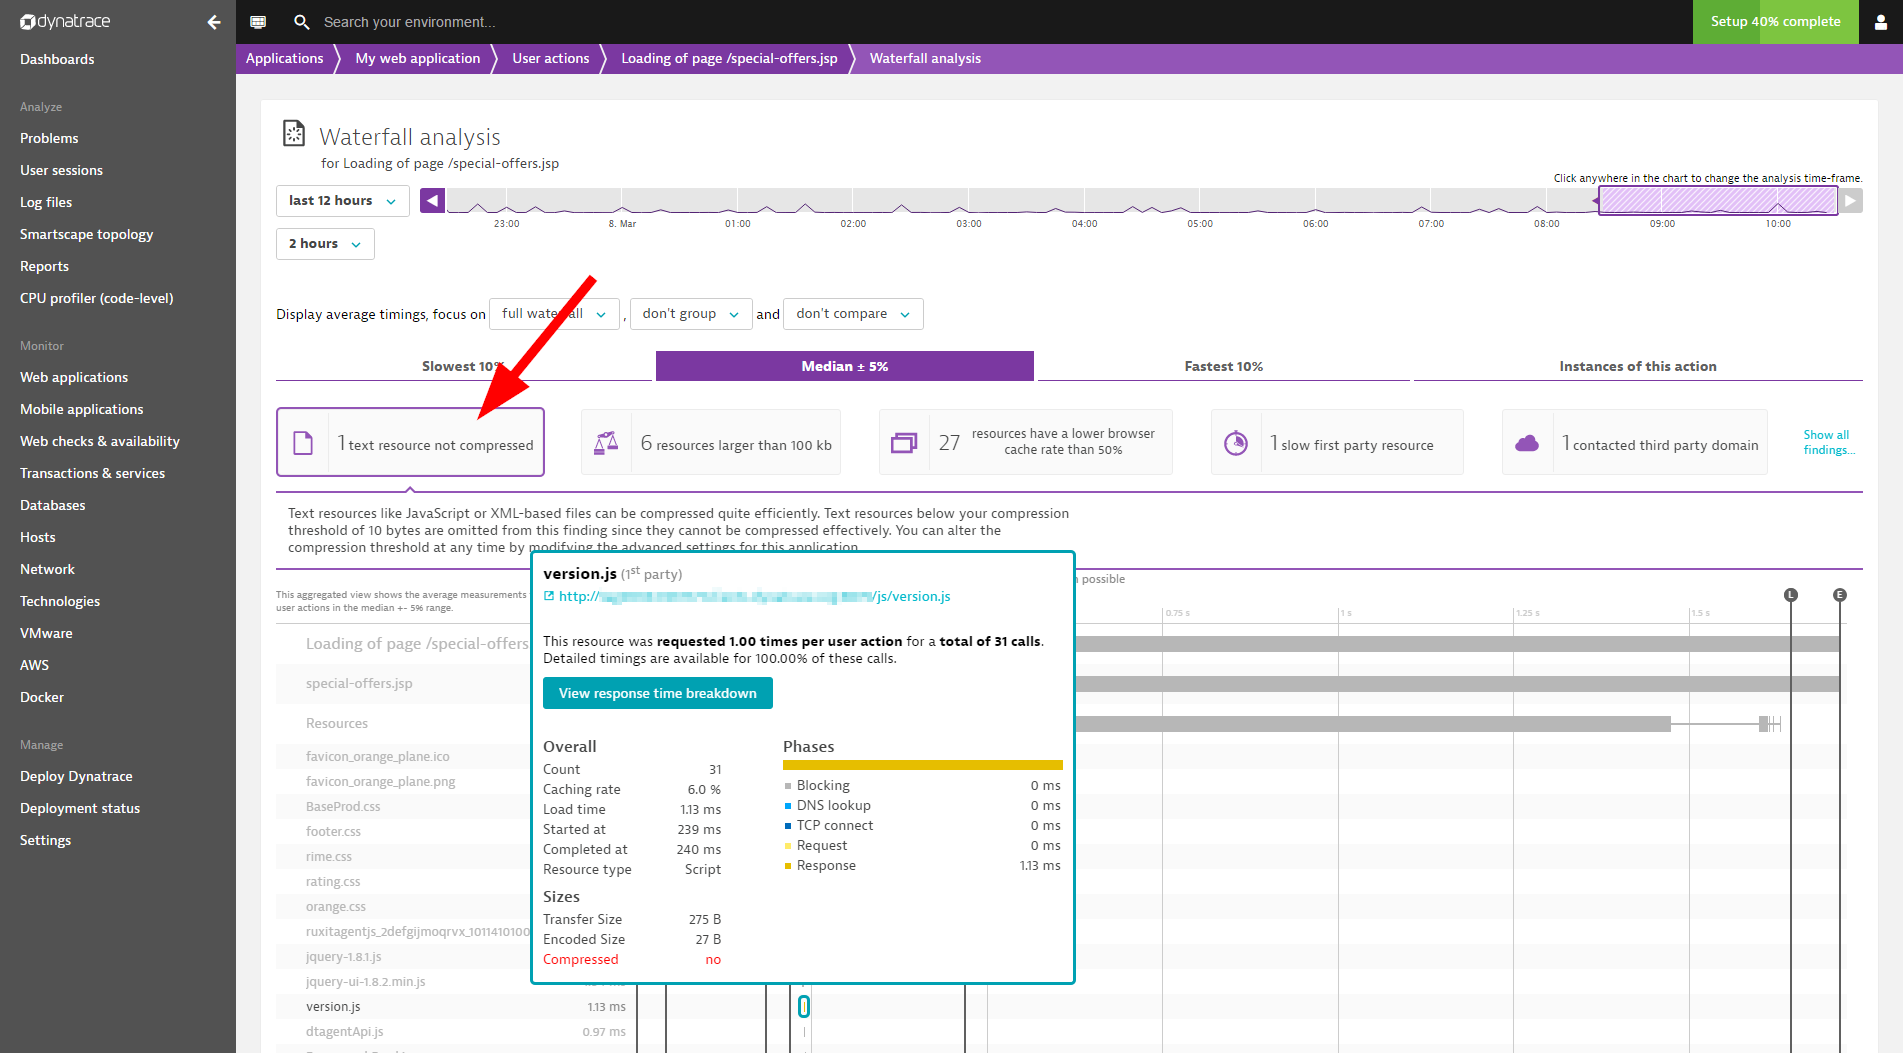
- Note in the example below that an uncompressed text resource has been detected. By selecting this finding tile, the affected resource is automatically highlighted below in the Resources list.
Single user-action instance waterfalls
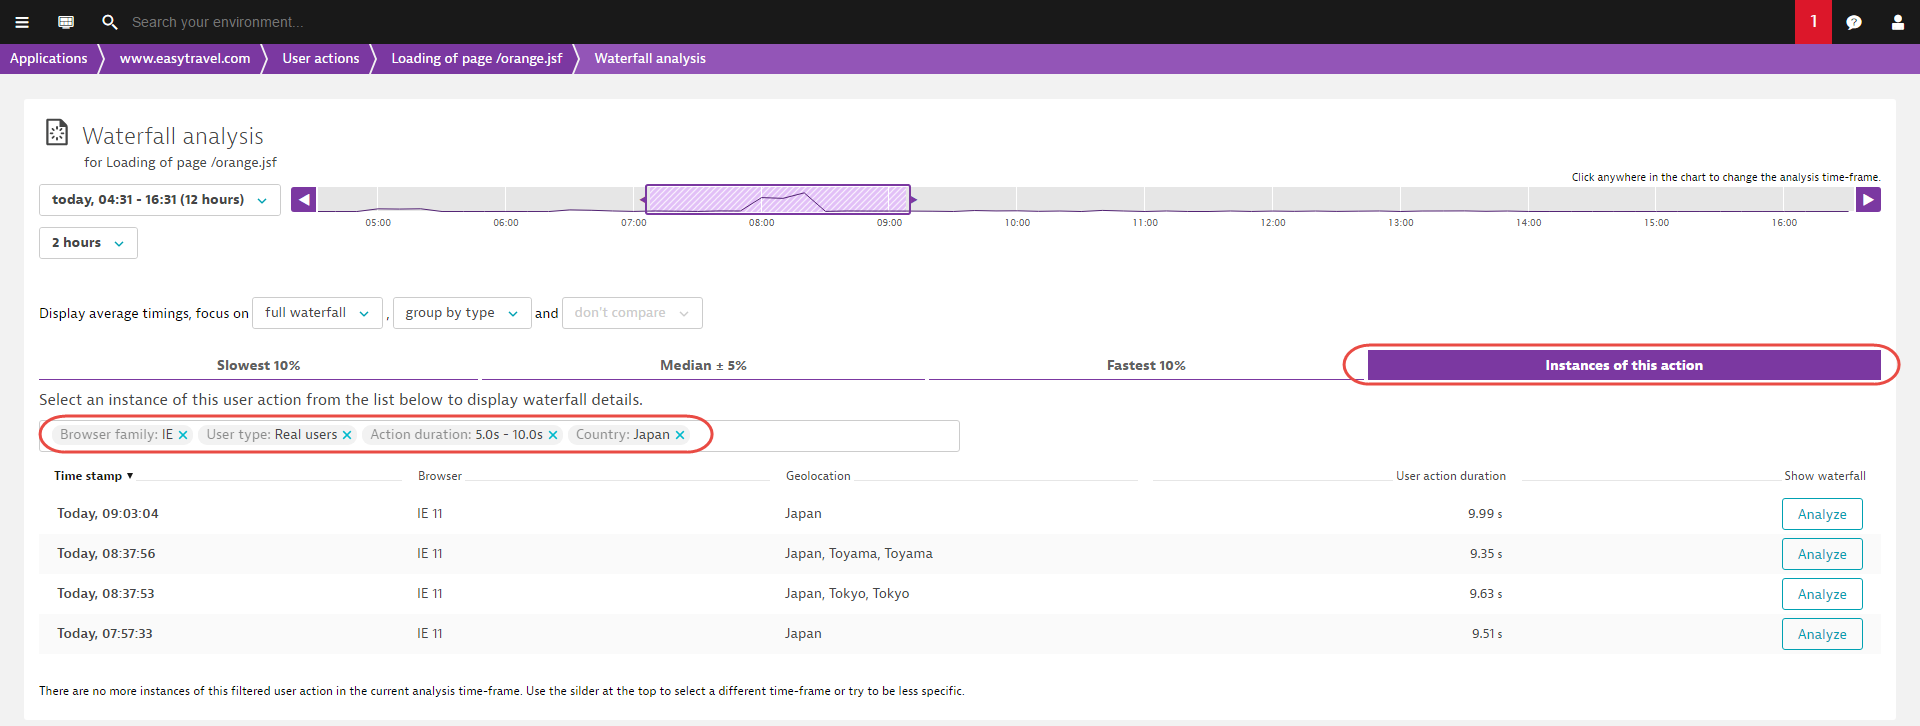
While automated findings are a great way to get started with waterfall analysis of user actions and to discover ways of improving the customer experience of your application, sometimes you need to be able to dig deeper into the performance data of your user actions. To date, Waterfall analysis displayed aggregated data pertaining to user action performance (Slowest 10%, Median +/- 5%, and Fastest 10%). While this information is helpful for gaining an overview of user action processing steps and resource usage, it’s sometimes necessary to analyze individual instances of specific user actions to understand the impact of certain browsers, geolocations, or other variables. With this in mind, and in support of our product development principle “Every user, every app, everywhere,” it’s now possible to view waterfall analysis of individual user-action instances. Individual user action instances are listed on the new Instances of this action tab (see below).
Filter user action instances
You can filter and sort user action instances based on various criteria. Note in the example below that instances of the user action Loading of page /orange.jsf are filtered based on Browser family, User type, Action duration, and Country.
Analyze individual user action instances
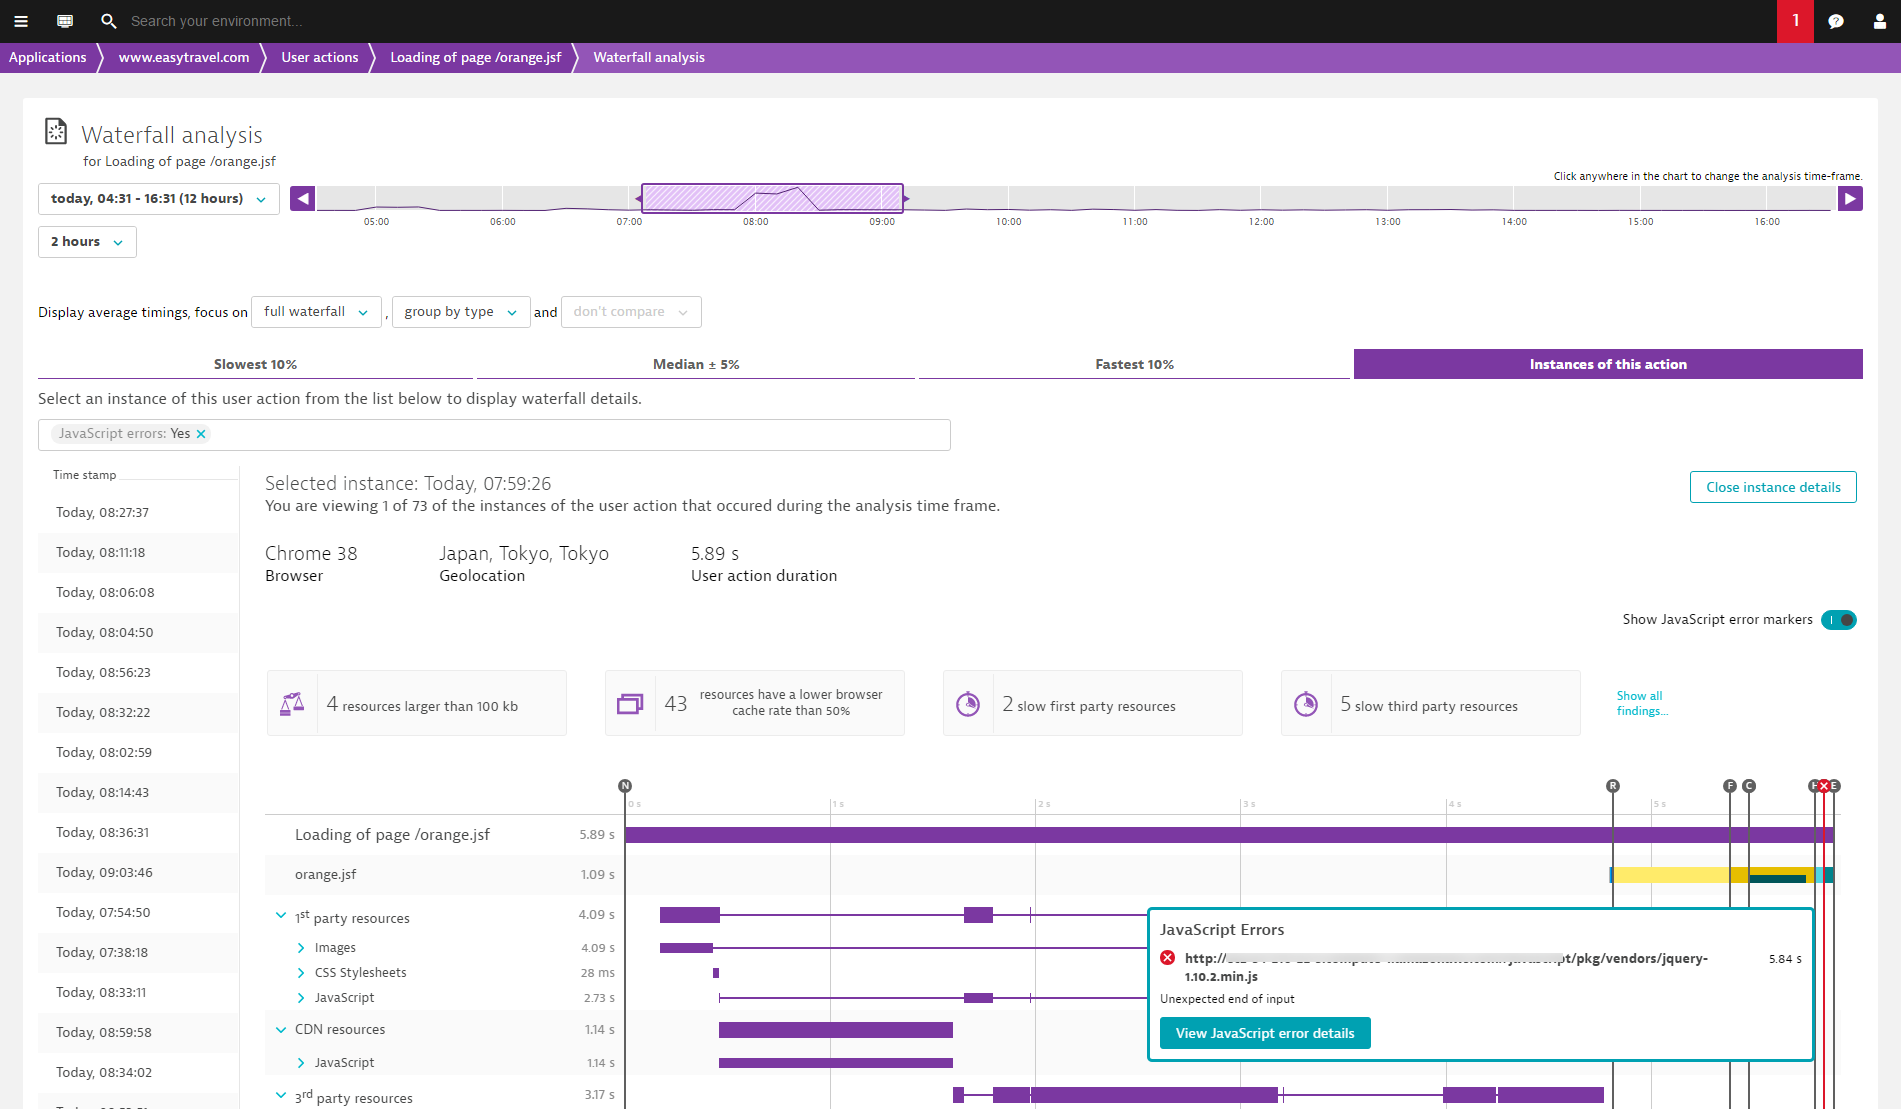
Click the Analyze button (right-hand column) of any user action instance you want to analyze. In the example below, the same user action from above is analyzed. In this case, the list of instances includes only those user actions that resulted in JavaScript errors.
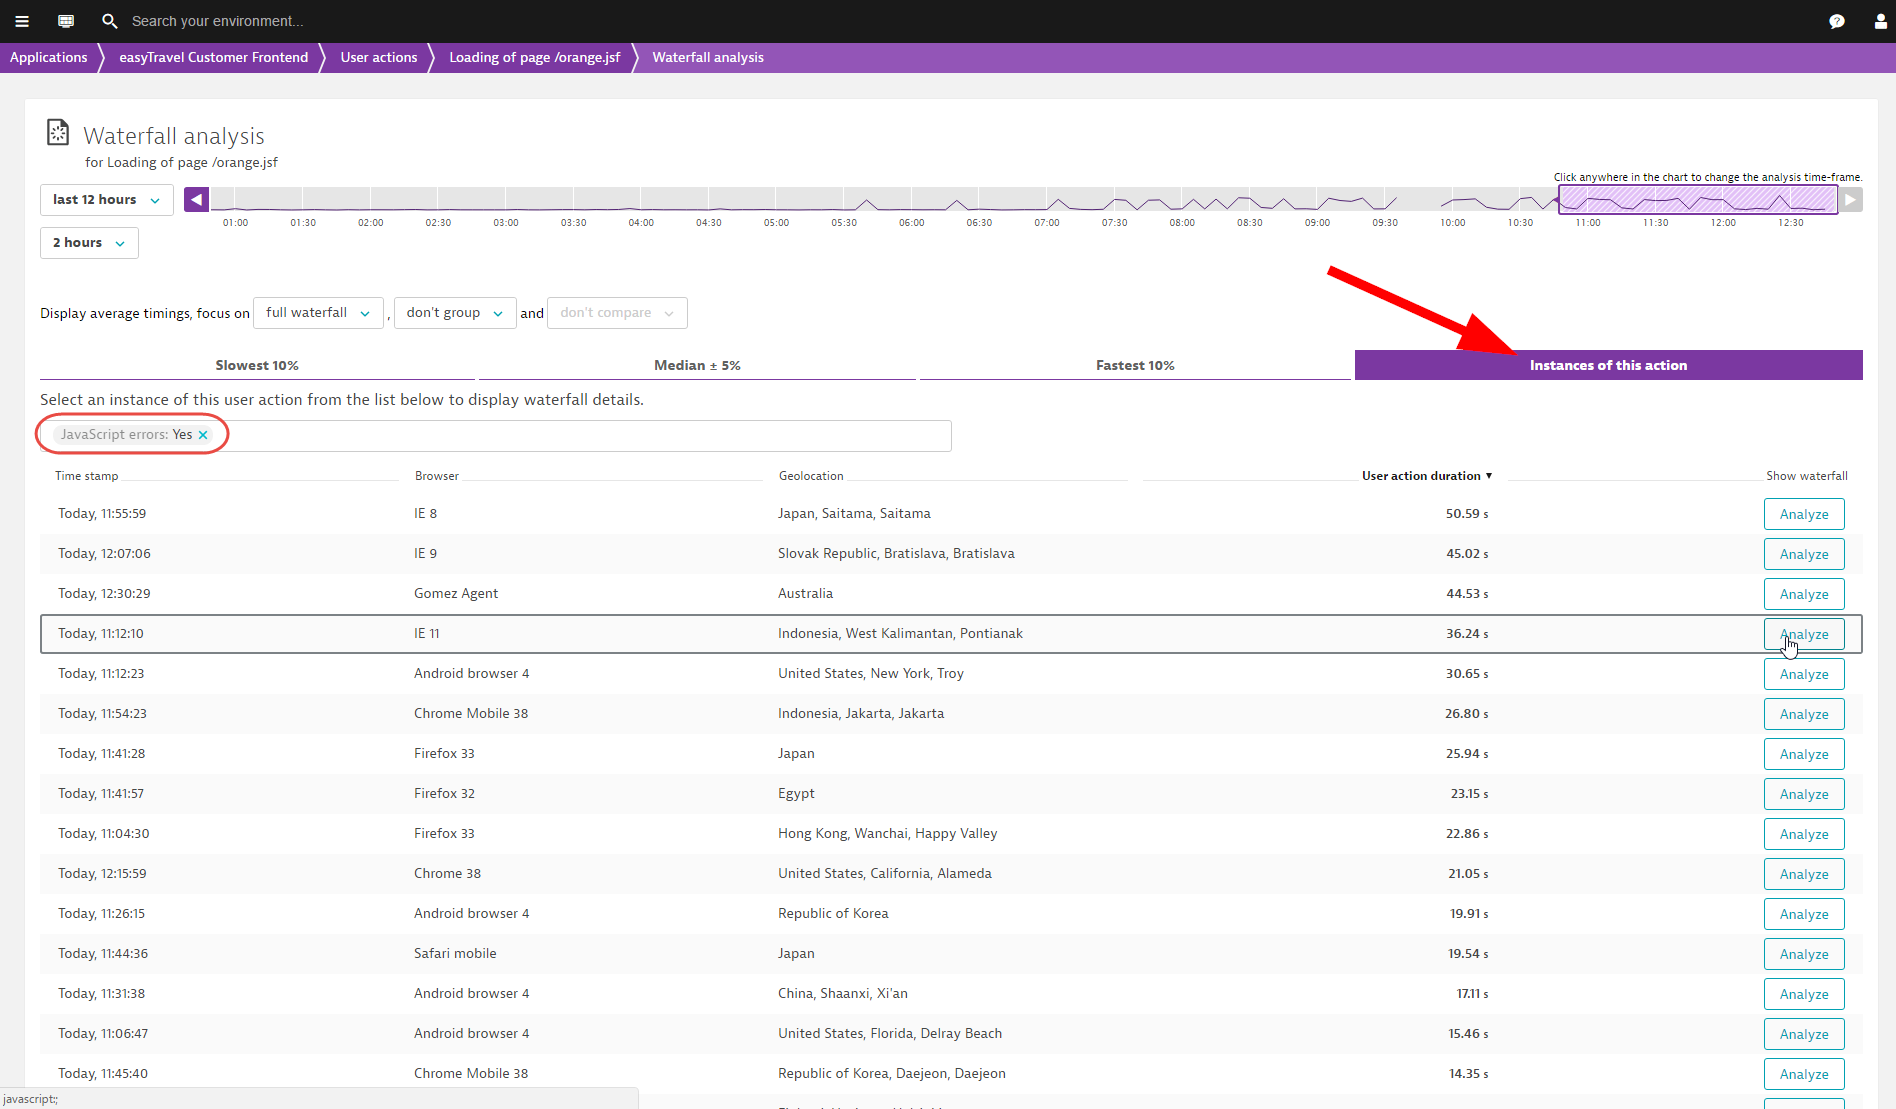
Here you can view Waterfall analysis of just the selected instance of this user action, including all resource details and timings.


Looking for answers?
Start a new discussion or ask for help in our Q&A forum.
Go to forum