I am very excited, and proud, to let you know that we brought Visually Complete and Speed Index to real user monitoring. This used to be available only in Synthetic. Whilst this was great now being able to immediately correlate Visually Complete metrics against core business metrics like bounce rates, error rates, and conversions opens a new dimension of insight.
This is great news for the industry according to, Patrick Meenan, the founder of WebpageTest.org and Principal Engineer at Google. He says:
“Most of the performance metrics do a good job of technically measuring how a page loads but they don’t necessarily translate directly into the user experience. Visually complete gives us a point-in-time metric that measures when the content has finished loading (visually). Speed Index is the best metric that we currently have that maps directly to what the user is seeing as the page loads with more credit for getting as much of the visible content in front of the user as possible. Both of these can happen substantially earlier than the typical “page load time” and are much more useful to optimize for when targeting the user experience.”
That last line is the most important and worth repeating. Together these metrics are ‘much more useful to optimize for when targeting the user experience. You don’t need me to tell you how important user experience is. It’s demanded by the billions of users that use your websites and app every day. Having the most accurate measure of page load, and being able to correlate that with critical business metrics is a game changer.
Here’s a quick demo of Visually Complete:
Focusing on above-the-fold optimization
Web performance optimization efforts focused on getting the content in the visible area of the screen as fast as possible ready for the user. This effort led us to realize “page load time” can be off due to some web development tricks, but this metric is traditionally the core of Real User Monitoring. In fact, we were optimizing for something that we could not measure for our real users. Having Visually Complete now available via Real User Monitoring is especially valuable when we think about all the mobile device types and different screen resolutions out there. Just thinking of my mobile phone and the 60 inch 4K touch screen in the office and everything in between, having all of this covered via synthetic environments. This is impossible to cover all of them but as we know each single user experience matters.
Single Page Applications timings now have a relevant measure of performance
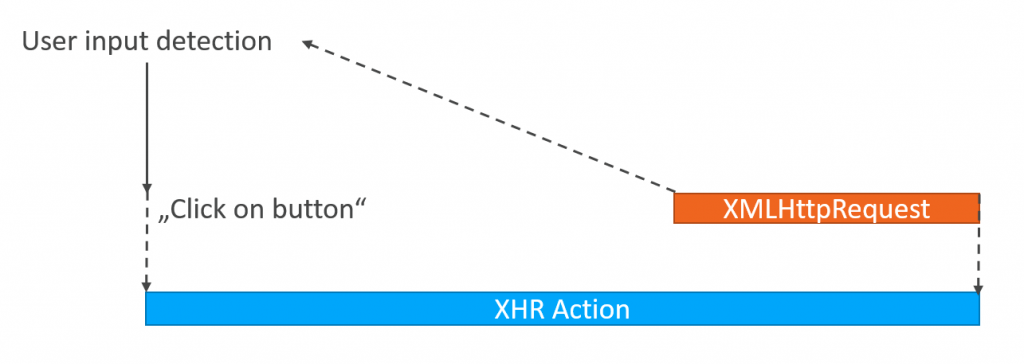
If this wasn’t complicated enough, now consider the emergence of Single Page Application frameworks like Angular, React, Ember and others. With the W3C Navigation timings we are measuring the time it takes to show the user the loading screen of the web application but not the time the user must wait till something useful appeared on the screen. After the application was loaded the next problem was that we had user interactions that we capture and we could correlate this with XHR-request being fired afterwards like shown on the picture below.

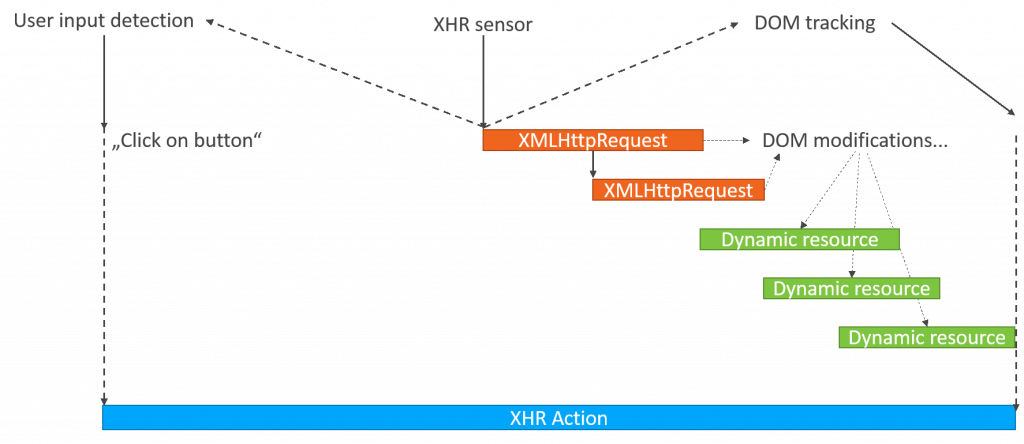
With the mechanism to capture the Visually Complete metric it is also possible to get better timings for those user actions. The timing no longer stops when the response of the XHR-request comes back but also gives us insight into the loading of dynamic resources triggered by JavaScript based DOM-element changes depending on the response of the XHR call.

Correlation of user performance with business metrics
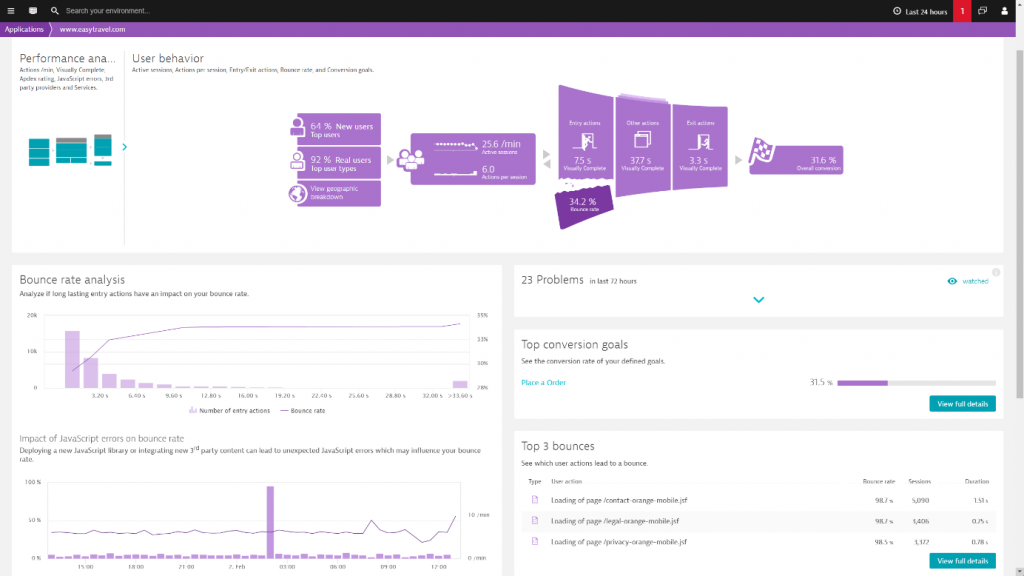
We all know that performance is beside errors one of the main drivers for user experience and in today’s digital world means impact on business outcomes. There are many case studies out there proving this impact like the Walmart example. With Dynatrace Real User Monitoring and the Visually Complete you get this analysis out of the box. The below screenshot shows you how much the bounce rate is impacted by performance or Frontend JavaScript errors.

Conclusion
With Visually Complete and Speed Index available via Real User Monitoring we are now closer to the end-user’s experience than ever. We are getting better insight into our regular web applications and Single page applications. And finally, we have automatically correlated real performance with real business outcomes. You want to try it? Click here.


Looking for answers?
Start a new discussion or ask for help in our Q&A forum.
Go to forum