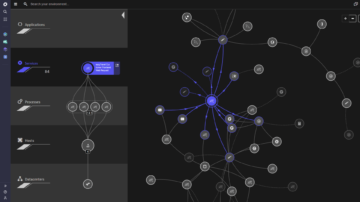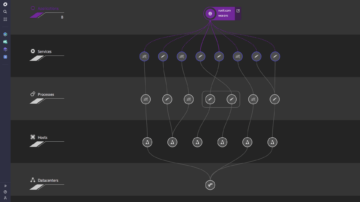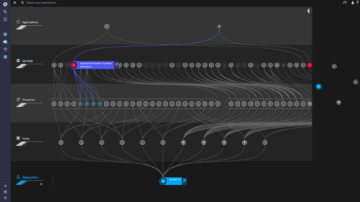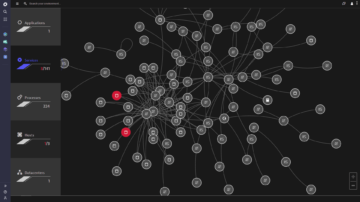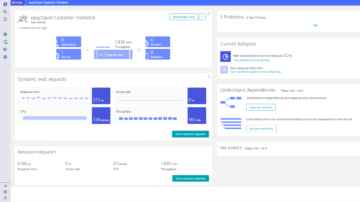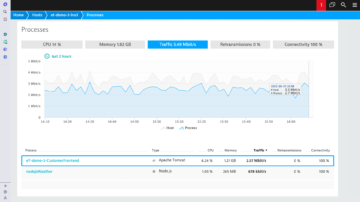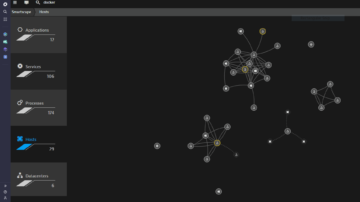


The Smartscape technology is really impressive because it shows us a visual diagram of everything it's monitoring, and that allows us to see how systems are interacting in real-time.
What is Application Mapping?
Application mapping is the process of identifying and mapping interactions and relationships between applications and the underlying infrastructure. An application, or network map, visualizes the devices on a network and how they are related – we have our own mapping visualization, which we call Smartscape.
See how everything works together—automatically
Think of Smartscape as the Google Maps for your application topology. As the Dynatrace OneAgent discovers all the components and dependencies in your application environment, our patented Smartscape technology simultaneously builds an interactive map of how everything is interconnected:
- Visualizations get built dynamically and automatically without any need for manual configuration, additional instrumentation, or scripts.
- Intuitive infographics make it easy to understand the complexities of your application stack and delivery chain.
- Smartscape provides 100% end-to-end observability into all application components and dependencies up, down, and across all tiers of your stack—no gaps or blind spots.
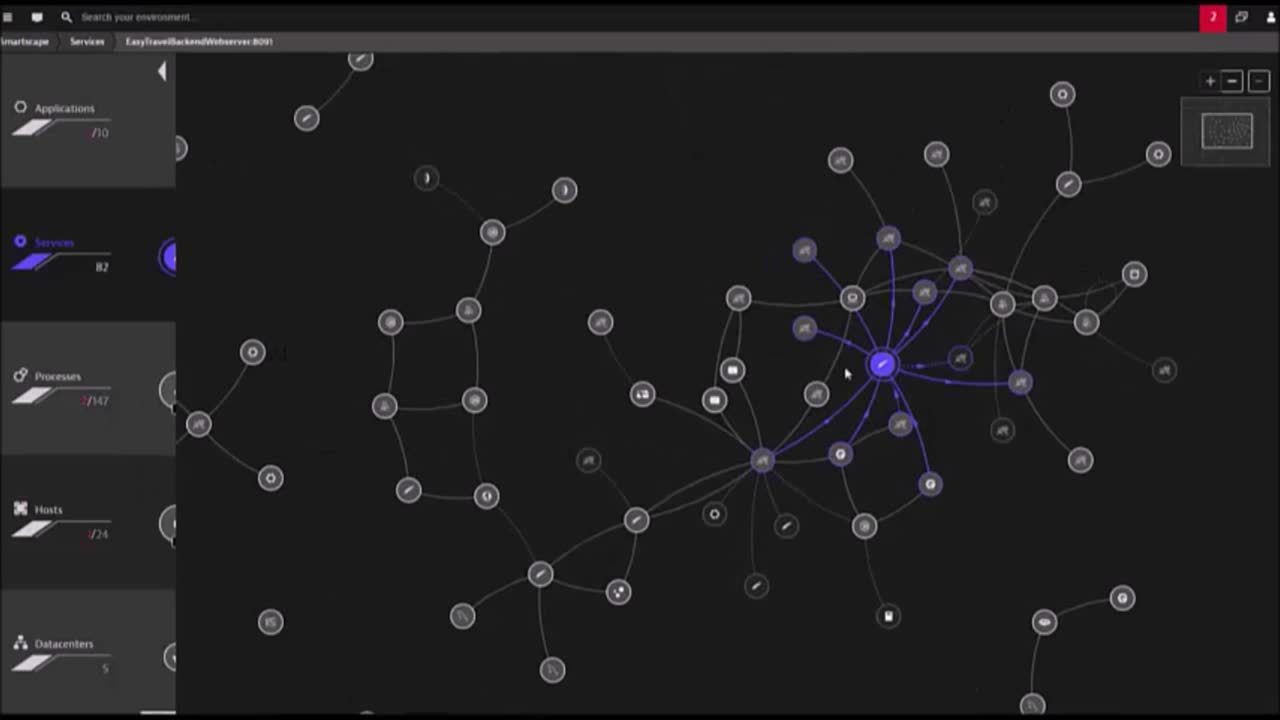
Understand dependencies across and among tiers
Smartscape maps dependencies both horizontally (between components of the same type, such as process to process, service to service, host to host) and vertically (among components of different types, such as data centers to hosts, hosts to processes, processes to services, services to applications).
Dynatrace visualizes process-to-process dependencies by capturing network communication data—usually a black hole in other APM tools.
With Smartscape you can:
- See which webpage calls which web server, which app server receives the web request, which services are then called, etc.
- Understand the call relationships between services (including third-party dependencies) as well as all services called by an application.
- Know exactly which services are supported by which processes, and which processes are running on which hosts.
Smartscape five-layer observability
See all topological dependencies
- Inter-connections between applications
- Which services are called by each application
- Dependencies between services
- Which services are hosted by each process
- Process-to-process relationships
- Which processes run on which hosts
- Infrastructure topology of hosts (physical or virtual machines, cloud)
- Interconnections between hosts
- Datacenter location of hosts (VMWare, AWS, Azure, Red Hat OpenStack Platform, etc.)


The Smartscape technology is really impressive because it shows us a visual diagram of everything it's monitoring, and that allows us to see how systems are interacting in real-time.
Keep track of your topology as it constantly changes
Smartscape visualizations are always accurate and up to date because the data is processed in real-time. Whatever your environment looks like at any given moment it’s reflected in Smartscape:
- See where, when, and how dependencies change dynamically.
- Your map updates on the fly as ephemeral microservices, containers, and cloud instances come and go.
- Smartscape grows with your environment as it scales.
Drill down into details
Click on any component—application, service, process, or host—to get a deep-dive infographic with all the relevant details for that component; availability and performance metrics, user experience insights, dependency details, links to log files, and more in one place.
- In one click, you can see all cloud instances, service flow and service backtrace, hotspot analysis, and more.
- This is no generic metrics pickup—you get real-time, context-specific metrics for each individual component.
Search your full stack instantaneously
Advanced filtering capabilities enable you to zero in on any entity or technology—say, all your Docker containers or your Red Hat OpenShift Container Platform deployments:
- Home in on where and how you have specific technologies running.
- Quickly locate individual third-party components.
- See the impact of "what if" scenarios—e.g., if you turn off a host, which applications would be affected?
Try it free

