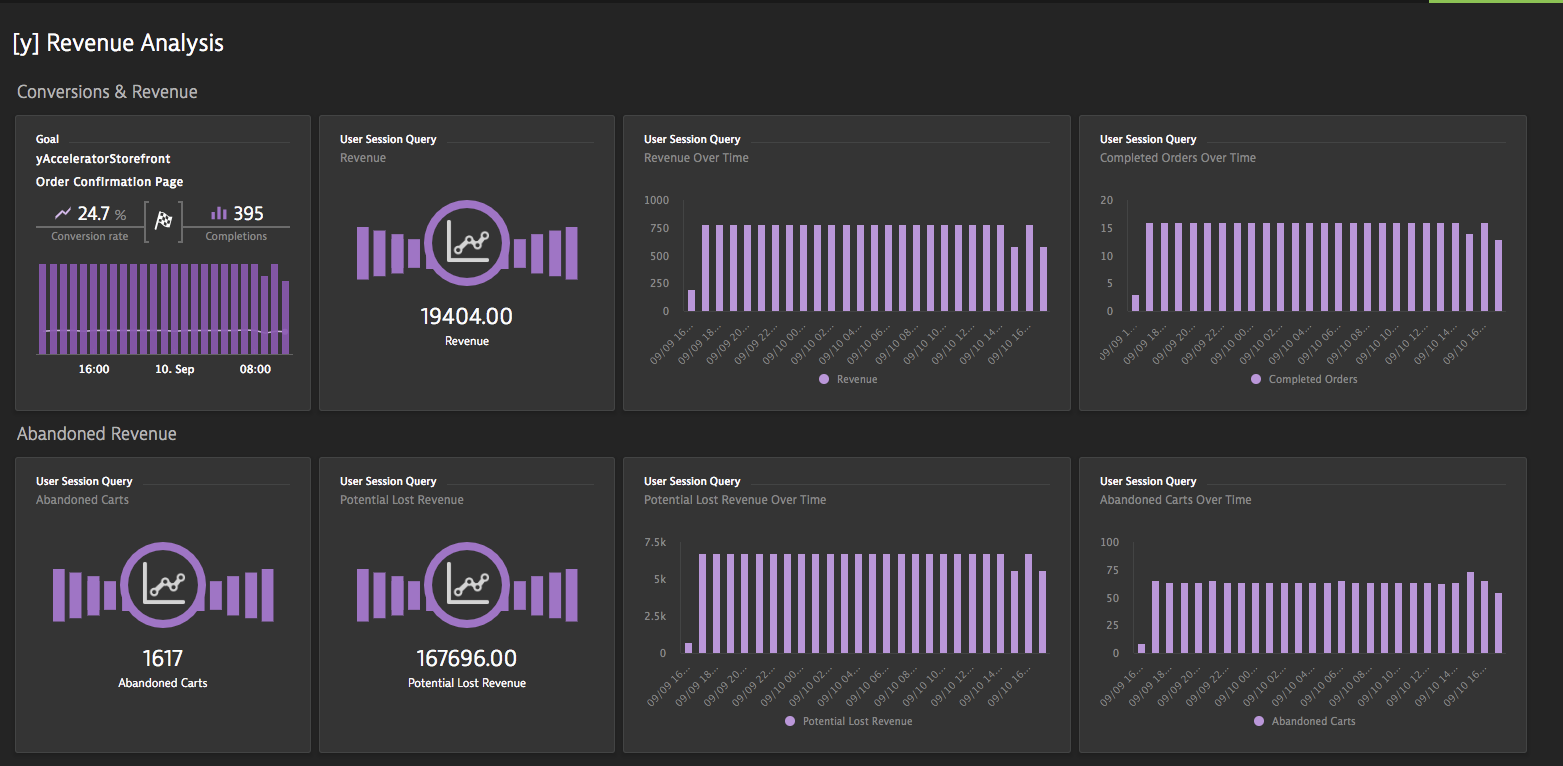
One critical success factor for any business is how effectively it bases its business decisions on data. Beyond just performance and availability statistics, end-user experience and business metrics are also required. And it’s not enough to simply capture all such critical business data—data consumers expect to have access to data in its most granular form, whenever and wherever they need it. To make business-critical decisions based on the dissection of such data, you need to be able to analyze your business data in a way that enables you to effectively draw the right conclusions from it. Therefore, the ability to slice and dice data across multiple dimensions and visualize the findings is key to the success of any data-driven business.
Proudly announcing the release of Dynatrace user sessions queries
User sessions queries is a powerful tool that increases your analytics capabilities exponentially. This multifaceted feature gives you the power to keep track of monetary values and conversion goals and view them in context with your application’s performance and error information, thereby giving you the insights you need to boost the success of your application.
User Session Query Language (USQL) makes it easy to segment, aggregate, and filter data in whatever way best meets your business requirements. As a business owner, this may mean aggregating data to keep track of KPIs and business goals, such as shopping-cart abandonment rates and conversions. As a product owner, this may mean having the functionality to easily keep track of performance improvements following a new release or segmenting out a geographical region in which your company has just started doing business.

Dynatrace customers who joined the early access program for USQL have provided us with valuable feedback that has helped us to further the development of this capability. Many customers are already using User sessions queries for the analysis of data beyond the IT organization—they’re analyzing real-user data, served straight from each individual user’s browser.
“We can now report on shopping cart abandonment, which is a big help for Sales”
–Dynatrace USQL EAP customer
User session data analytics at scale with Dynatrace
Due to its fully automatic approach and unmatched scalability, Dynatrace collects data for your web-scale applications out-of the-box. Each time a user interacts with your system, Dynatrace captures a ton of data and puts it into context.
You can use USQL to create queries based on the values of individual user session properties that have been defined for your environment. User sessions queries can be easily accessed through the Dynatrace web UI where you’ll find an array of useful features at your disposal. You can run powerful queries, segmentation, persistent and multiple filtering, and much more on all your captured data.
Easy query creation with auto-complete
All queries are written in the User Session Query Language, which is a Dynatrace-specific query language. The language relies on basic SQL concepts and the syntax is similar, which makes it easy to get started. Dynatrace has created a set of defined keywords and functions that you can use to access your user session data.
To ease your search for the exact data you’re looking for, the query field automatically prompts you with auto-completion and predictive suggestions that are based on query syntax.

A typical query looks like this:
SELECT <columns> FROM <table> WHERE <condition>
Here’s an example query that counts sessions in five-minute time blocks:
SELECT DISTINCT DATETIME(starttime, 'HH:mm', '5m'), count(*) FROM usersession
Visualize query results with custom graphs and charts
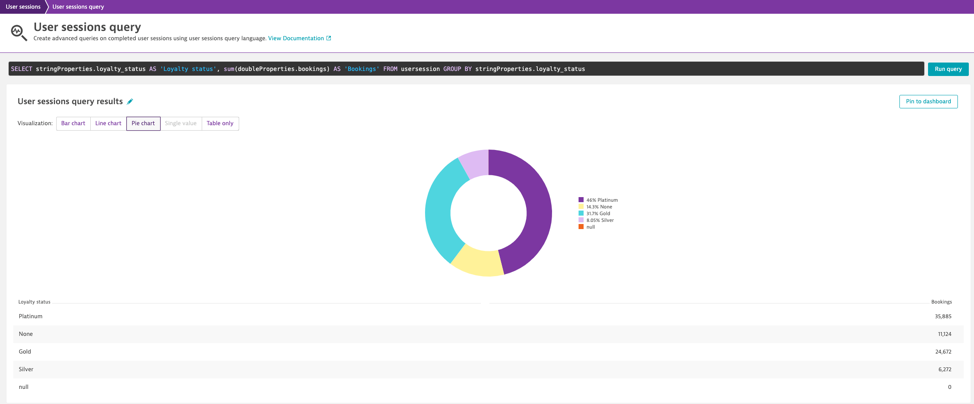
User sessions queries not only help you focus on the data you really need, they also present returned data to you in whatever way best meets your requirements. Other than its raw form, you can choose to view data in a variety of graphs and charts, such as shown in the following examples:
- A pie chart that shows the average bookings segregated by loyalty status (average bookings by loyalty status):

- The average duration of user actions indicated as a single value:

With some simple dashboarding techniques, you can easily pin the charts and visualizations you need to your dashboards, so that, at a glance, you can see all the metrics and KPIs that are critical to the success of your business.
Dynatrace user sessions queries will change how you look at data. Powerful queries coupled with functionality for segmenting, aggregating, and filtering data guarantee that you can fetch the exact information you’re looking for in just a few minutes. And the vast and sleek array of graphs and charts make it easy to present your findings to your colleagues.
Ready to give it a try?
To access Dynatrace user sessions queries:
- From the navigation menu, go to User sessions and click User sessions query.
- Type your query and click Run query.
Stay tuned for more!
Yes! We’re already on the path to improving user sessions queries. Within the next few months, you’ll see the following enhancements:
- Support for comparing several series within the same visualization
- Support for comparing two different analysis time frames within the same visualization
- Option to leverage server-side request attributes in the configuration of session property rules
- Support for user session properties for mobile apps and OpenKit for RUM applications


Looking for answers?
Start a new discussion or ask for help in our Q&A forum.
Go to forum