This post was co-authored by Jean-Louis Lormeau, Digital Performance Architect at Dynatrace.
Observability is a topic at the top of mind for all architects, Site Reliability Engineers (SREs), and more – each wanting to use observability to proactively detect issues and guarantee the best experience and availability to users. Much like in sport, we cannot improve ourselves and become the best at what we do without having well-defined goals. In software we use the concept of Service Level Objectives (SLOs) to enable us to keep track of our system versus our goals, often shown in a dashboard – like below –, to help us to reach an objective or provide an excellent service for users.
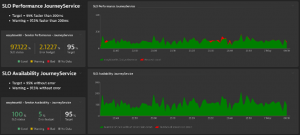
Recently inspired by a colleague of mine, who helped a Dynatrace customer define objectives for their organization by optimizing the system until reaching those objectives, this blog will guide you through those same steps. You’ll learn how to create production SLOs, to continuously improve the performance of services, and I’ll guide you on how to become a champion of your sport by:
- Creating calculated metrics with the help of multidimensional analysis
- Creating a dashboard reporting your relevant KPI
- Transform your KPI into an SLO
Often, in sports, athletes have coaches who help them achieve their objectives. At Dynatrace, our Autonomous Cloud Enablement (ACE) team are the coaches or teach and train our customers to always get the best out of Dynatrace and reach their objectives. Our expert Jean Louis Lormeau suggested a training program to help you become the champion in problem resolution. Are you ready to kick some bugs? Then let’s go!
The training program to proactively improve your services
First, by looking at the habits of new Dynatrace users, we can clearly distinguish two ways of using Dynatrace:
- Reactive: Problem management of issues detected by Dynatrace
- Proactive: Continuous improvement of the services of our application
Most of our users understand that problem management in Dynatrace means taking advantage of Davis®, our AI engine. On the other hand, however, continuous improvement of services is usually a less popular concept and one of the biggest expectations every time our ACE team delivers a training session.
Continuous improvement of services is the most efficient process for all teams that are looking to improve the performance of their applications by considering all layers of their architecture. Similar to an athlete, the objective here is to have teams always push the limits to become faster and stronger. To do this, teams must continuously measure their performance against their goal, digging deeper in the analysis of your issues to identify:
- Weak signals
- Slow degradations
- Usual exceptions raised by our system that is now considered to be normal by Davis
You might think we can easily handle this noise of problems by defining fixed thresholds or by lowering the minimum thresholds of our alerts, but doing this could have a significant consequence; your helpdesk would be spammed by alerts raised by Dynatrace. Not the optimal solution.
So how can we continuously improve our system with Dynatrace?
Let’s follow the training program, laid out by our coach Jean Louis, to become the champion of continuous improvement.
Let’s focus on the weak signals of our system
Much like a sporting athlete, it’s critical to make sure our training sessions are beneficial to our system and that we’re keeping an eye on any weak signals. For example, an athlete must be in tune with their body to know when something isn’t operating right which could impact their future performance. Similarly, we must also monitor our IT systems so closely that we know when the smallest thing isn’t working as normal. Multidimensional Analysis will be the perfect tool to detect weak signals or to slow degradation that won’t necessarily be detected by Davis®.
Let’s start with a small and simple workout to get rid of all those weak signals:
Count the number of times your request is being slow and how frequent they had exceptions, errors.
- Metric 1: number of requests > X seconds (Let’s start with X=3 seconds – we will adjust the threshold later).
- Metric 2: number of requests in error
Warm-up phase
Before any workout, we need to warm up our system. In this instance, to warm up we must visualize our metrics in diagnostic tools which will allow us to detect an important number of unpredictable behaviors.
The Multi-Dimensional analysis will allow you to extract all types of metrics to detect this.
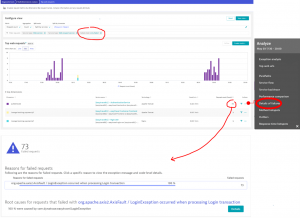
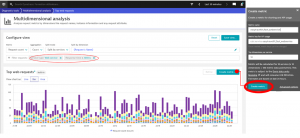
The screenshot below shows that, after applying it to our two previously mentioned metrics, the request error is automatically discovered in two clicks:
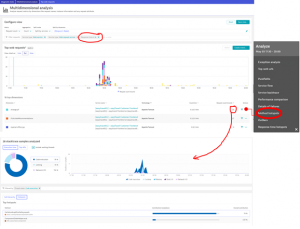
The slow requests are shown with the help of the filter “above 3 seconds”. We can now see the exact thing that is slowing down our system:
These two examples show how easy it is to highlight services that can be improved. We can now move to the training phase.
Training
Once our systems are firing and ready to go, we can switch to our planned activity. . Let’s start by creating a dashboard to follow our metrics.
Since we’re ambitious, we’re going to lower the threshold to 1 second, in comparison to our initial limit of 3 seconds:
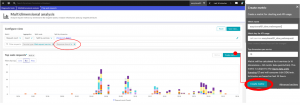
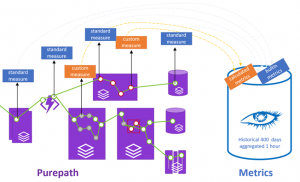
By following these steps we were able to convert a multi-dimension analysis view to a calculated metric stored in multi-dimensional metrics storage, which provides us with 400 days of history and several other advantages:
- Ability to use the metric for alerting
- Ability to add the metric in one of your dashboards
- Ability to define automatic baselining
No need for creating a calculated metric for each indicator, there are already lots of “built-in metrics”.
In our exercise:
- Metric 1 (Number of requests with a response time > 1 second): requires the creation of a calculated metric with the right filter.
- Metric 2 (Number of requests in error): It’s already available in the Dynatrace built-in metric.
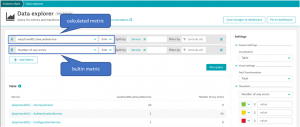
Thanks to the metric stored in Dynatrace, users can easily get a weekly or monthly table highlighting the services which are often slow and generate lots of errors. This approach allows you to quickly prioritize which services to improve (or queries if you break down the result of this table to this dimension).

To get this table, we use the Data Explorer with the following configuration:
Competitive
Once users are trained on how to follow the performance of your system, it’s time to move to the next level; competition.
To do this, you need to define a Service Level Agreement (SLA) and apply the corresponding SLO in Dynatrace to the entire IT or, better, targeted business services.
As we are in a competitive mode, the SLOs could be the following ones:
- Performance SLO: “95% of our Journey Service queries must respond in less than 200 milliseconds.”
- Availability SLO: “95% of our requests have no errors.”
In Dynatrace we have a dedicated menu to handle your SLOs, and the screenshot below explains how to configure our “Performance SLOs”:
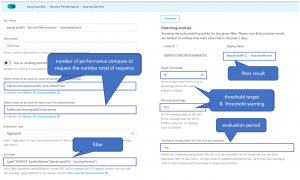
We used a calculated metric: easytravel01_fast_webservice that counts the number of requests with a response time under 200ms.
- For the “Availability SLO” we used the following configuration:
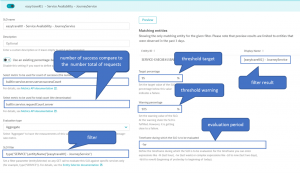
Once the SLOs are created, we then need to display them in one of our dashboards. With this proactive dashboard, we can start to improve our application.
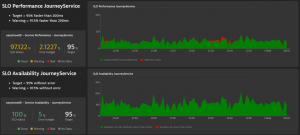
- The “SLO Performance JourneyService” graph shows in green the number of high-performance queries (less than 200ms) and in the background, in red, the total number of requests from the “Journey Service” web service.
- The “SLO Availability JourneyService” graph shows in green the number of calls without errors and in the background, in red (but there are none here), the total number of requests from the “JourneyService” web service.
Championship
That’s it! You’re ready to take on the competition and become a champion, now your services are at the top of their physical condition!
All that’s left to do is start improving your front-end services using SLOs and USQL. But that’s a story for another time. Stay tuned for more tips from our coach Jean Louis Lormeau.
Now you’re a Dynatrace optimization athlete!
If you want to learn more on SLI/SLO, here are few resources I recommend looking at:
- SLO beyond production reporting – automate delivery & operations resilience ( by Andreas Grabner)
- SLOs for quality gates in your delivery pipeline ( by Andreas Grabner)
- Performance Clinic: Getting Started with SLOs in Dynatrace | Dynatrace
While SLOs are a great concept, there are many option questions we receive from our community such as:
- What are good indicators, and who should define them?
- How do I define SLOs in Dynatrace and act upon them?
- Are SLOs just something for production, or also delivery?
Wolfgang Heider and Kristof Renders recently presented a topic at the SLOconf 2021, answering most of this question. Check out their session to get fully onboarded on SLO.
And, if you’re new to Dynatrace you can see the magic yourself by taking the Dynatrace Trial
Or, if you’d prefer to have an old school conversation, you can find me on:




Looking for answers?
Start a new discussion or ask for help in our Q&A forum.
Go to forum