Although many companies adopt solutions such as OpenTelemetry, Prometheus, and Grafana as part of their observability strategy, they often confront a common data analysis problem: data silos.
According to Dynatrace research, 49% of CIOs report that their business and IT teams work in silos. When teams, tools, and data are siloed, it’s harder for organizations to succeed.
As a solution, teams often adopt open source observability tools like OpenTelemetry to gain situational awareness of their cloud-native environments. However, adding more tools can add yet another silo.
According to Michael Kopp, Senior Principal Product Manager at Dynatrace, companies can extend their AI-powered cloud observability efforts to include open source tools and data in a way that eliminates data silos. In a session at Dynatrace Perform 2022, Kopp joins Tim Gerlach, Product Owner of APM at SAP Business Platform to describe how.
Open source observability tools help address cloud complexity
Companies face many challenges as they deploy modern IT architectures. As environments become more complex, organizations are turning to open-source tools to observe their services and respond to issues.
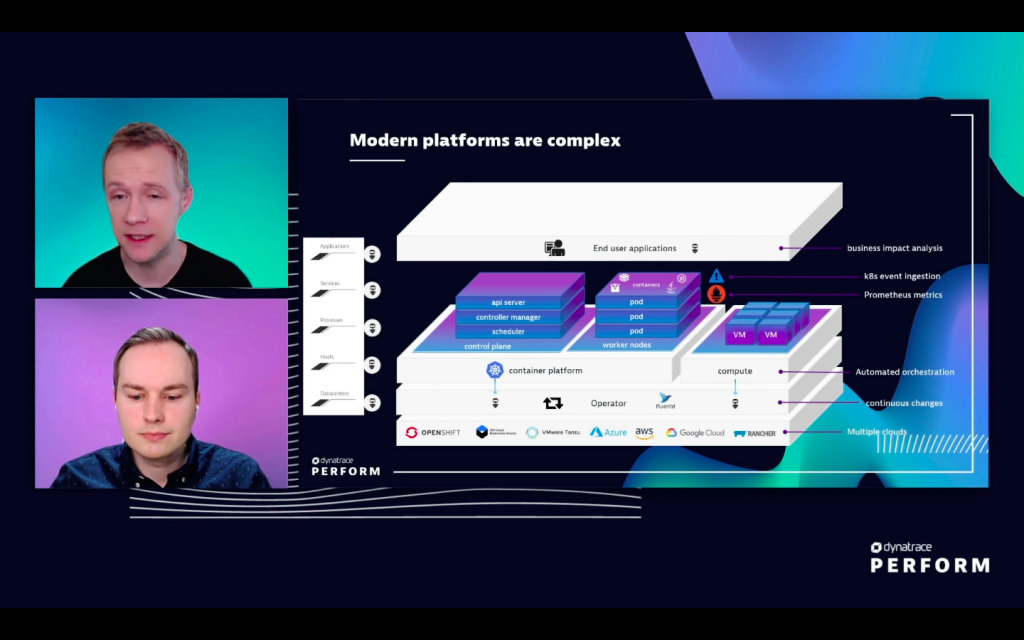
Kopp explains that many tools are becoming de facto for particular observability tasks. For example, OpenTelemetry for instrumenting microservices, Fluentd for collecting logs, and Prometheus for collecting metrics.
While adding these tools can solve specific problems, they also add more voices to the choir. Sometimes these resources send conflicting messages. Organizations need to integrate these and other open-source tools to maximize observability and get all voices singing in harmony.
Turning silos into an open source observability ecosystem
Although open-source tools are well designed for their specific roles, they generate data in their own siloed data stores. This leads to multiple tool-specific dashboards. Maintaining multiple dashboards from different tools can increase operations overhead. Moreover, a more important problem arises when the dashboards are providing inconsistent views of the same issue.
A new view
To address this problem, companies need to bring these different data sources into a single data store. To close the gap between disparate systems, organizations need context for observability. They also need the ability to scale that context in a single platform. In addition, applying AI across a variety of data helps users understand the root causes of problems — as well as how to address them — while providing consistent views of data.
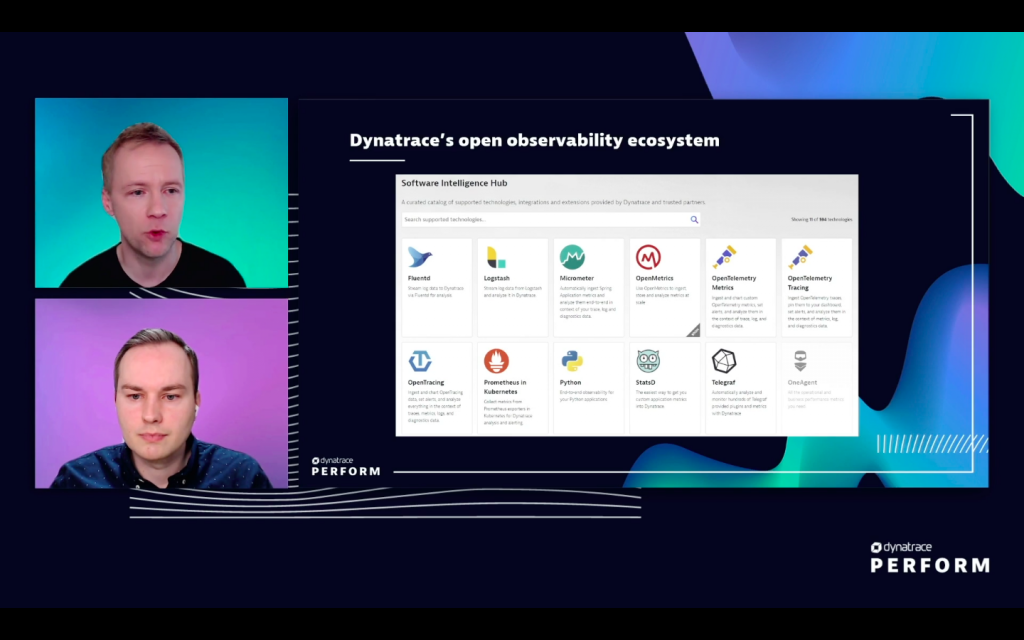
The Dynatrace Hub provides direct access to open source tools that Dynatrace supports, as well as instrumentation guides to help with customizations.
As Kopp points out, a distinguishing feature of the Dynatrace solution is that it brings data into context. This context comes from a common topology of the monitored environment based on data from metrics, logs, and traces. For example, Kubernetes dashboards can incorporate data on pods, nodes, and workloads along with custom metrics collected by other agents running on the cluster.
SAP meets OpenTelemetry
To illustrate how open observability works in practice, Gerlach provided an overview of how his team uses Dynatrace at SAP. The SAP environment includes 200,000 reporting agents, 1,000 Dynatrace environments, and over 25 production clusters. As with any environment of its size and complexity, automation is key for SAP. Automation helps them accommodate new data sources for telemetry. In many cases, they cannot install a monitoring agent because they are using a managed service. Nonetheless, they still want to collect metrics, traces, and logs.
The solution was to adopt OpenTelemetry, a vendor-neutral approach to collecting telemetry data. OpenTelemetry is an open-source project backed by the Cloud Native Computing Foundation (CNCF). One of its components is the OpenTelemetry Collector.
Seeing the benefits of OpenTelemetry
The OpenTelemetry Collector has three high-level components: receivers, processors, and exporters. Receivers define where to get telemetry data, such as specific endpoints of a service. Processors are the second component that modify and filter telemetry data — teams can use them to batch data in some cases. The final component, exporters, write data to backend data stores. Dynatrace created an OpenTelemetry Collector Exporter to allow customers to collect data from virtually any source and integrate it into their Dynatrace platform.
Gerlach describes how his team uses the Dynatrace OpenTelemetry Collector and the Dynatrace Exporter with SAP HANA, a hosted, in-memory database that exposes metrics using SQL. SAP has combined a HANA receiver and processor with the Dynatrace Exporter to capture and integrate SAP HANA metrics, logs, and traces into the Dynatrace platform.
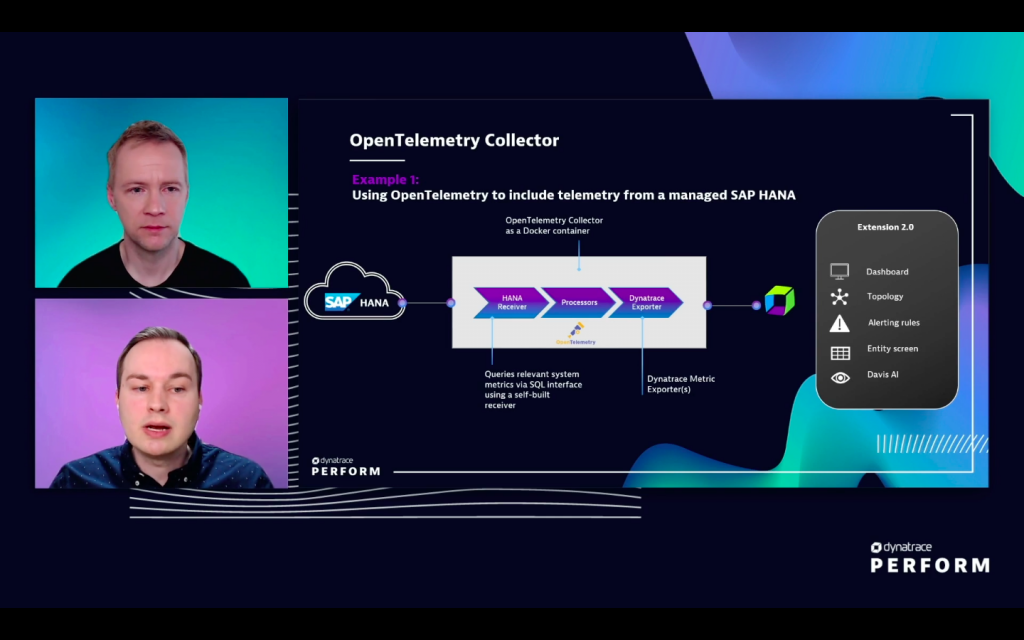
Once the data is in Dynatrace, users can define dashboards and understand how SAP HANA databases are functioning relative to the overall infrastructure. Because the data is in Dynatrace, the Davis AI engine can analyze it automatically.
Another example of integration is the Kyma open-source cloud-native runtime based on Kubernetes. Kyma emits telemetry data in addition to Kubernetes telemetry, which is captured by Dynatrace OneAgent. To capture the additional telemetry, SAP configured existing components of an OpenTelemetry connector to get data from Kyma runtime.
Connecting the dots—and the data silos
Data silos make observability efforts challenging. By integrating disparate open-source tools and dashboards on a single platform and applying AI-powered observability, organizations can achieve critical insight across the board. Extending AI across open source data helps users understand the root causes of problems—and how to address them. A single platform also provides consistent views of data.
Stay tuned for more advancements from Dynatrace, enabling the viewing of both Dynatrace and custom data side by side on all screens, additional integrations to other open source tools, and more specialized use of AIOps.
To learn more about extending AI-powered observability to open source data, you can view the session on-demand: Extend AI-powered observability to open source data to get better insights.


Looking for answers?
Start a new discussion or ask for help in our Q&A forum.
Go to forum