In the ever-evolving landscape of IT operations and software development, logs are a critical data source for understanding system behavior, diagnosing issues, and maximizing business value. However, different teams often rely on a variety of monitoring and troubleshooting tools that use different data types, leading to fragmented data and inconsistent analytics. Dynatrace addresses this challenge by providing unified analytics and automation for logs, integrating them with all other observability, security, and business data types.
Dynatrace enables various teams, such as developers, threat hunters, business analysts, and DevOps, to effortlessly consume advanced log insights within a single platform. Dynatrace Grail™ and Davis® AI act as the foundation, eliminating the need for manual log correlation or analysis while enabling you to take proactive action.
Dynatrace unified observability and security help enterprises, like our customer, BMO, save time and money, fostering collaboration across business, development, and operations teams.
In this blog post, we’ll provide an overview of the following log-related topics:
- Logs in the context of applications
- Easy yet powerful access to any log with the all-new Logs app
- How logs are ingested
- Dynatrace Application Security with logs
- Dynatrace Davis CoPilot™ integration and AI-powered Application Security
- Schemaless: Instantly gain business event insights from logs
Simplicity is key to success
As IT responsibilities shift left and expand, such as when developers take on application security duties, simplicity in toolsets becomes essential. Existing siloed tools lead to inefficient workflows, fragmented data, and increased troubleshooting times.
Tool consolidation is becoming a priority for C-level decision-makers in 2025. Enterprises are turning to Dynatrace for its unified observability approach for cloud-native, on-premises, and hybrid resources.
Rather than relying on disparate tools for each environment and team, Dynatrace integrates all data into one cohesive platform. Davis AI contextually aligns all relevant data points—such as logs, traces, and metrics—enabling teams to act quickly and accurately while still providing power users with the flexibility and depth they desire and need.
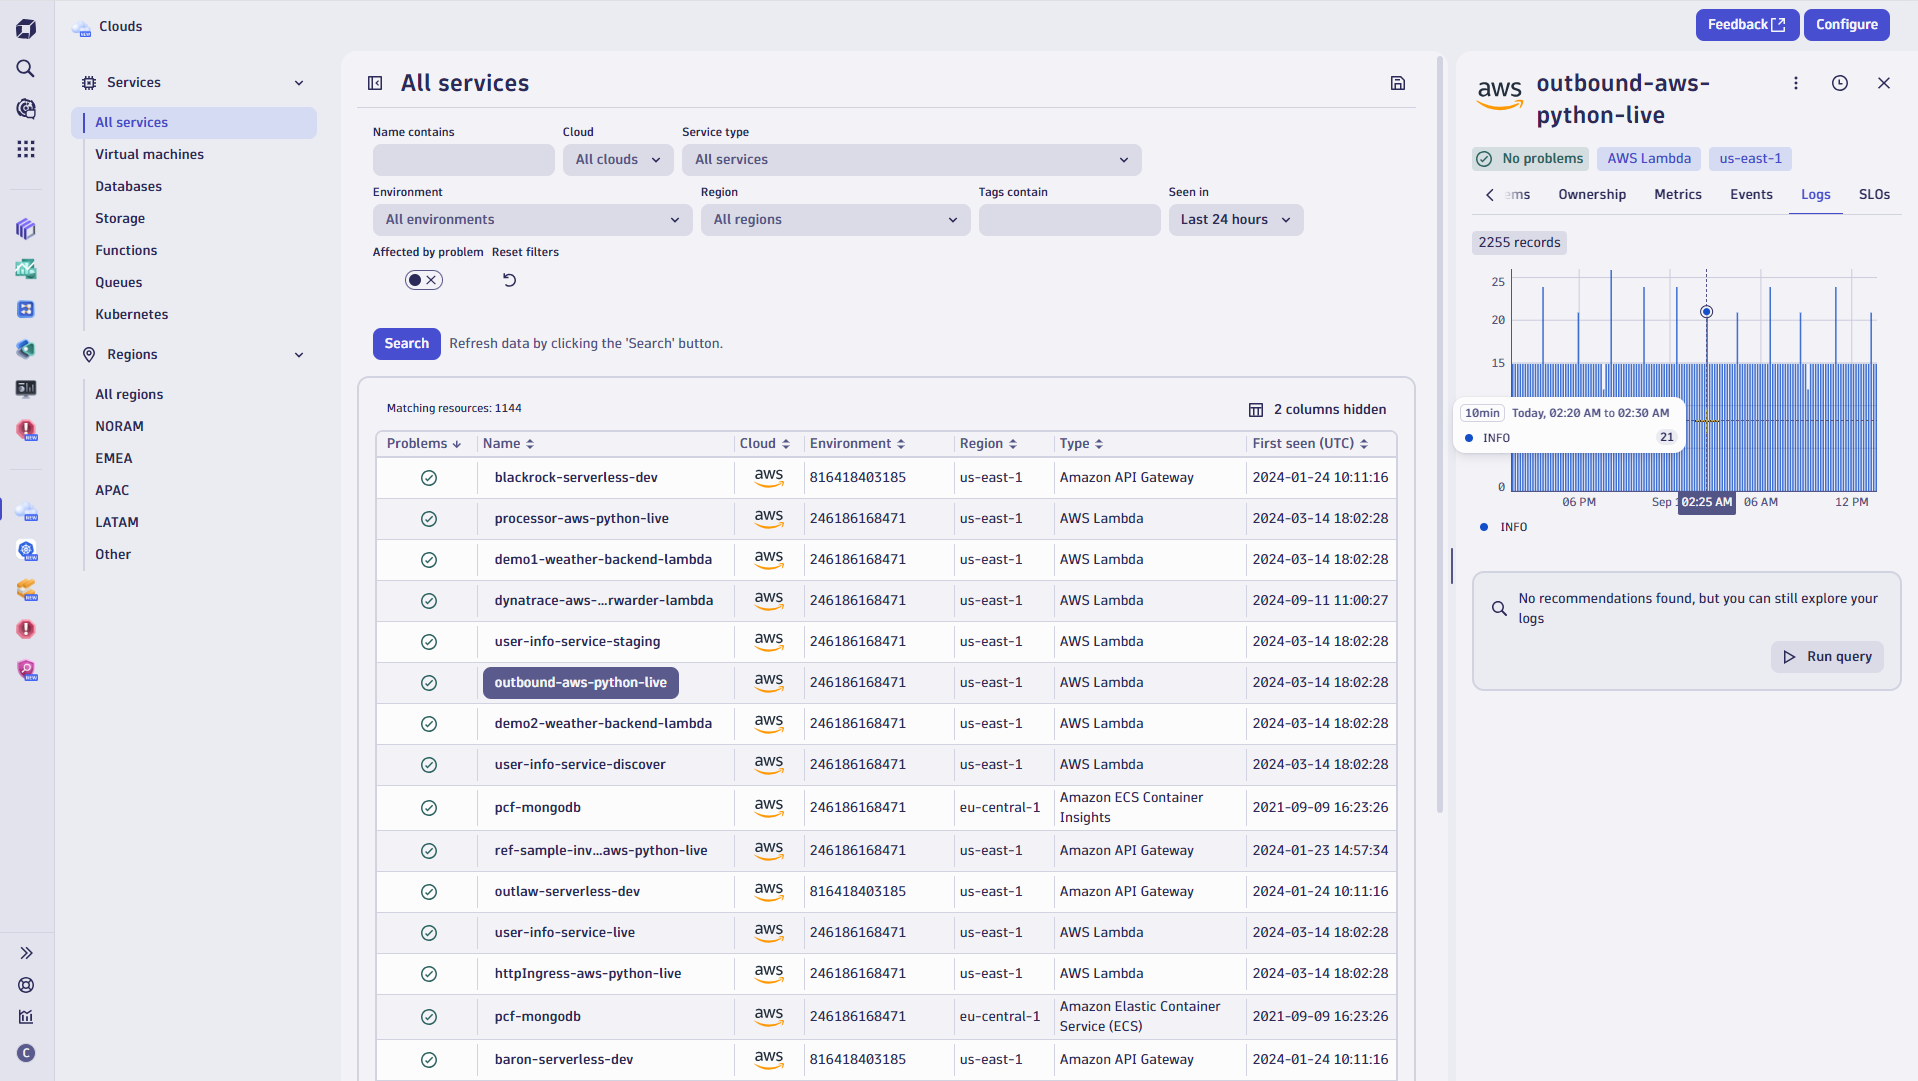
Logs in context with applications
Applications are provided within the Dynatrace platform to address the various needs of different teams and specific use cases. DevOps teams operating, maintaining, and troubleshooting Azure, AWS, GCP, or other cloud environments are provided with an app focused on their daily routines and tasks.
For instance, in a Kubernetes environment, if an application fails, logs in context not only highlight the error alongside corresponding log entries but also provide correlated logs from surrounding services and infrastructure components. This shortens root cause analysis dramatically, as explained in our recent blog post Full Kubernetes logging in context from Fluent Bit to Dynatrace.
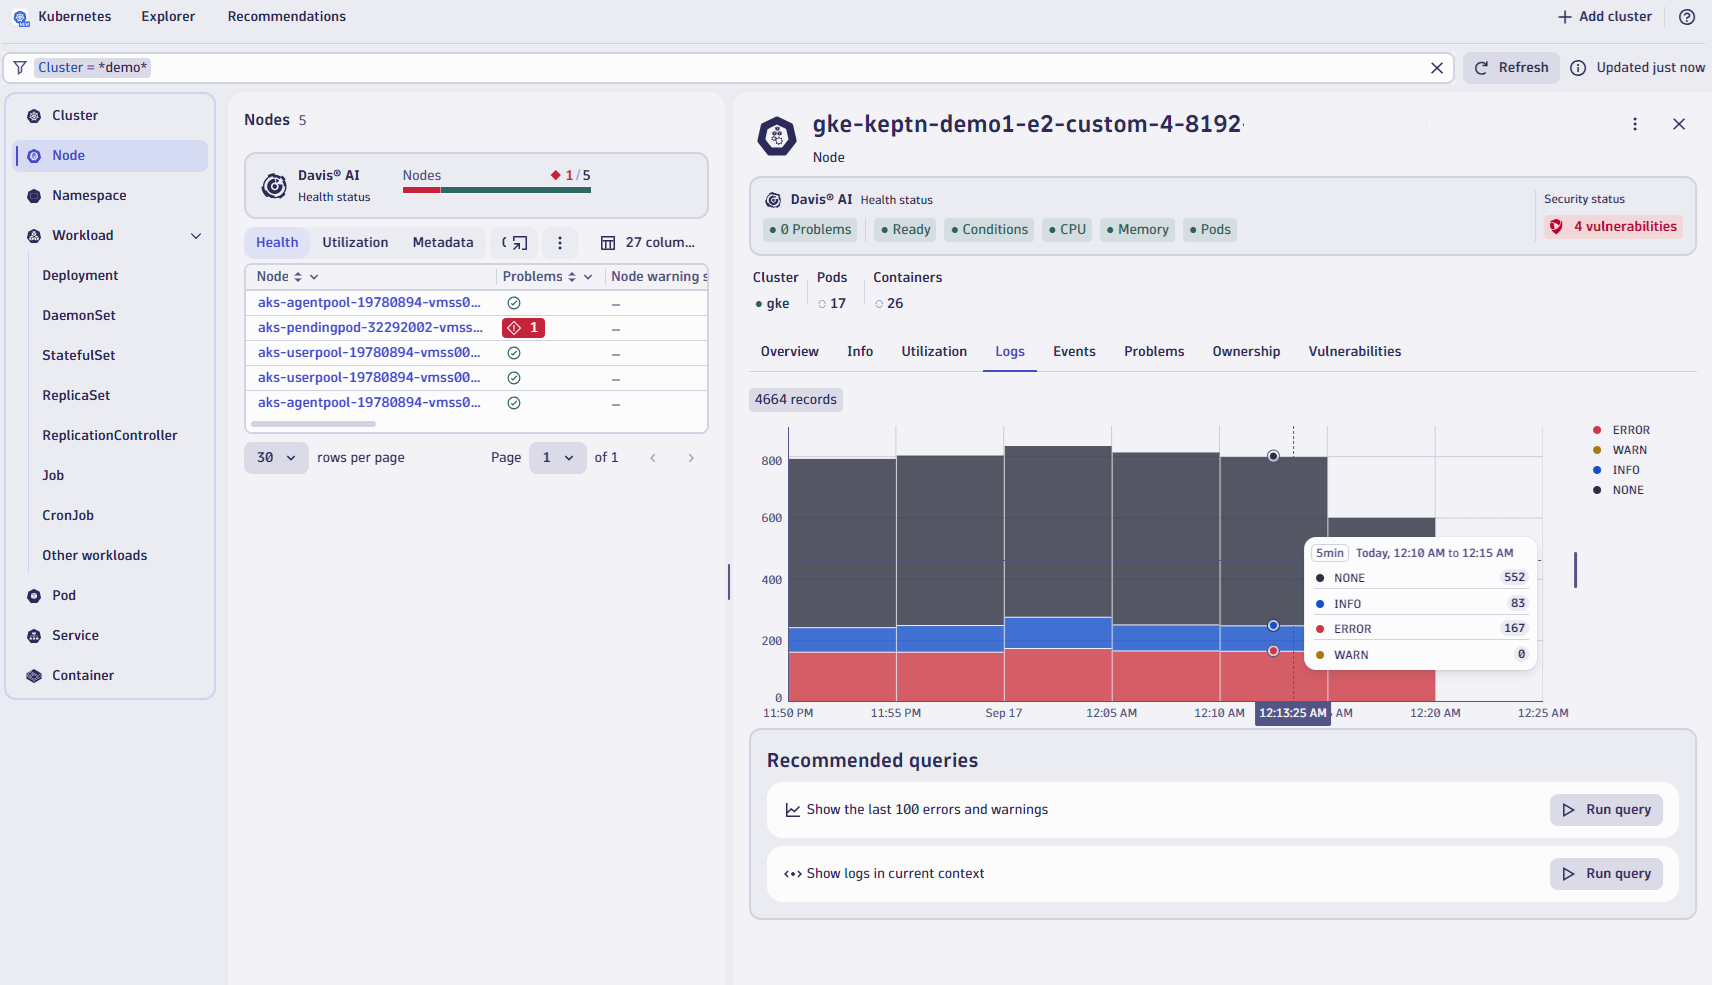
The show surrounding logs function provides Dynatrace users with the ability to dive deeper and surface context-specific log lines of the components and services linked to the problem—all without a single line of code or complex query language knowledge. This is explained in detail in our blog post, Unlock log analytics: Seamless insights without writing queries.
For advanced analysis, there is a direct “open with” path, allowing you to load the current view in Notebooks for manual analysis, the Logs app, or other apps capable of visualizing context-specific log lines.

While the way that logs in context are interconnected and provided by Dynatrace is unique, as also Gartner® recognized for the 14th consecutive time in their Magic Quadrant™, there are use cases where this is not sufficient and raw access to the logs is required.
Easy yet powerful access to any log with the all-new Logs app
Developers love Dynatrace, without a doubt, and are one of the many teams next to DevOps or SREs making use of our all-new Logs app. The reasons are easy to find, looking at the latest improvements that went live along with the general availability of the Logs app.
In our product news blog post, Simplicity meets power: Introducing the all-new Dynatrace Logs app, we examine these features, which make life easy for new Dynatrace users, along with the newly introduced DQL Editor for power users.
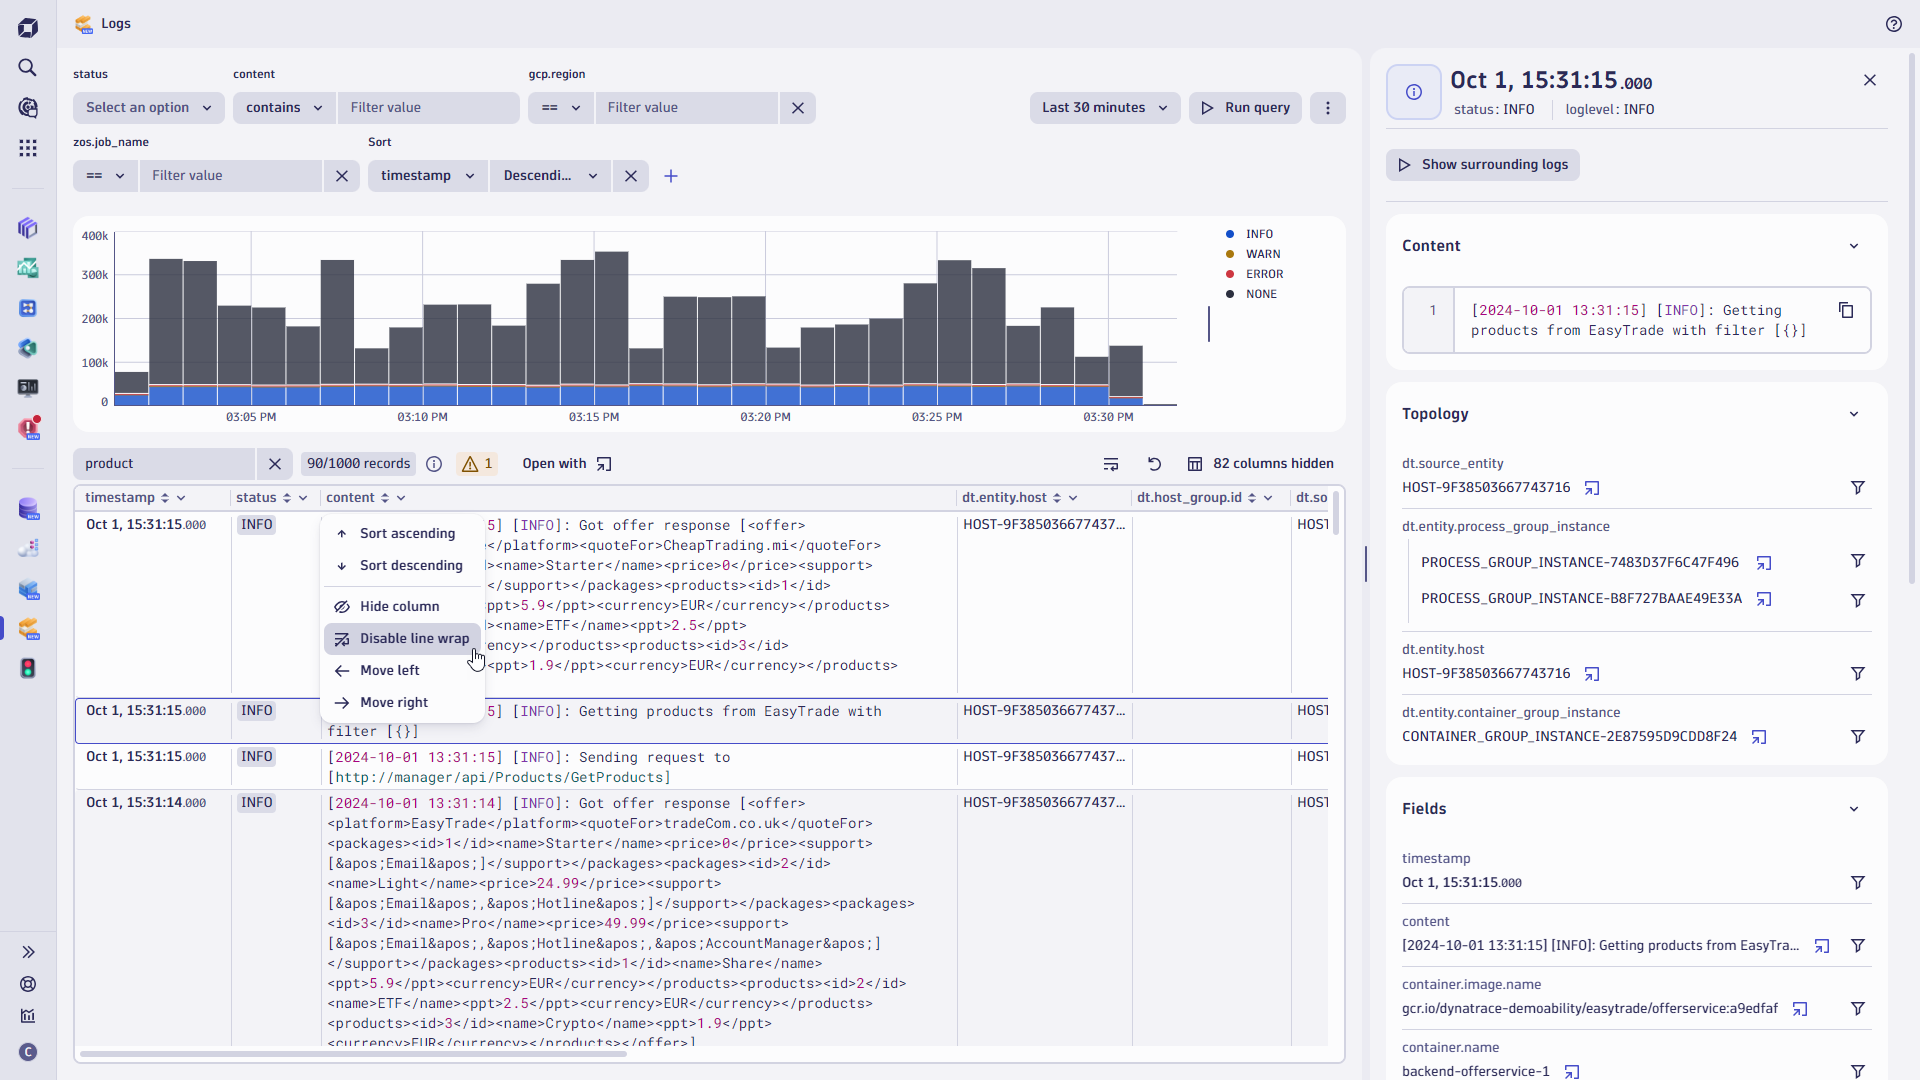
Directly from individual log line results, you can filter simply by selecting corresponding items in the details pane or by loading the surrounding logs when selecting Show surrounding logs.
Keep in mind that Dynatrace Grail is schema-on-read and indexless, built with scaling in mind. There is no need to think about schema and indexes, re-hydration, or hot/cold storage. This architecture also means you are not required to determine your log data use cases beforehand or while analyzing logs within the new logs app.
How logs are ingested
Dynatrace offers OpenPipeline to ingest, process, and persist any data from any source at any scale. OpenPipeline ensures data security and privacy—data is collected and processed securely and compliantly, with high-performance filtering, masking, routing, and encryption—and contextualizes incoming data in real time. Using patent-pending high ingest stream-processing technologies, OpenPipeline currently optimizes data for Dynatrace analytics and AI at 0.5 Petabyte per day and tenant; this will soon increase to one Petabyte per day and tenant.
OpenPipeline’s high-performance filtering and preprocessing provide full ingest and storage control for the Dynatrace platform. As a result, dedicated data pipeline tools are unnecessary for preprocessing data before ingestion.
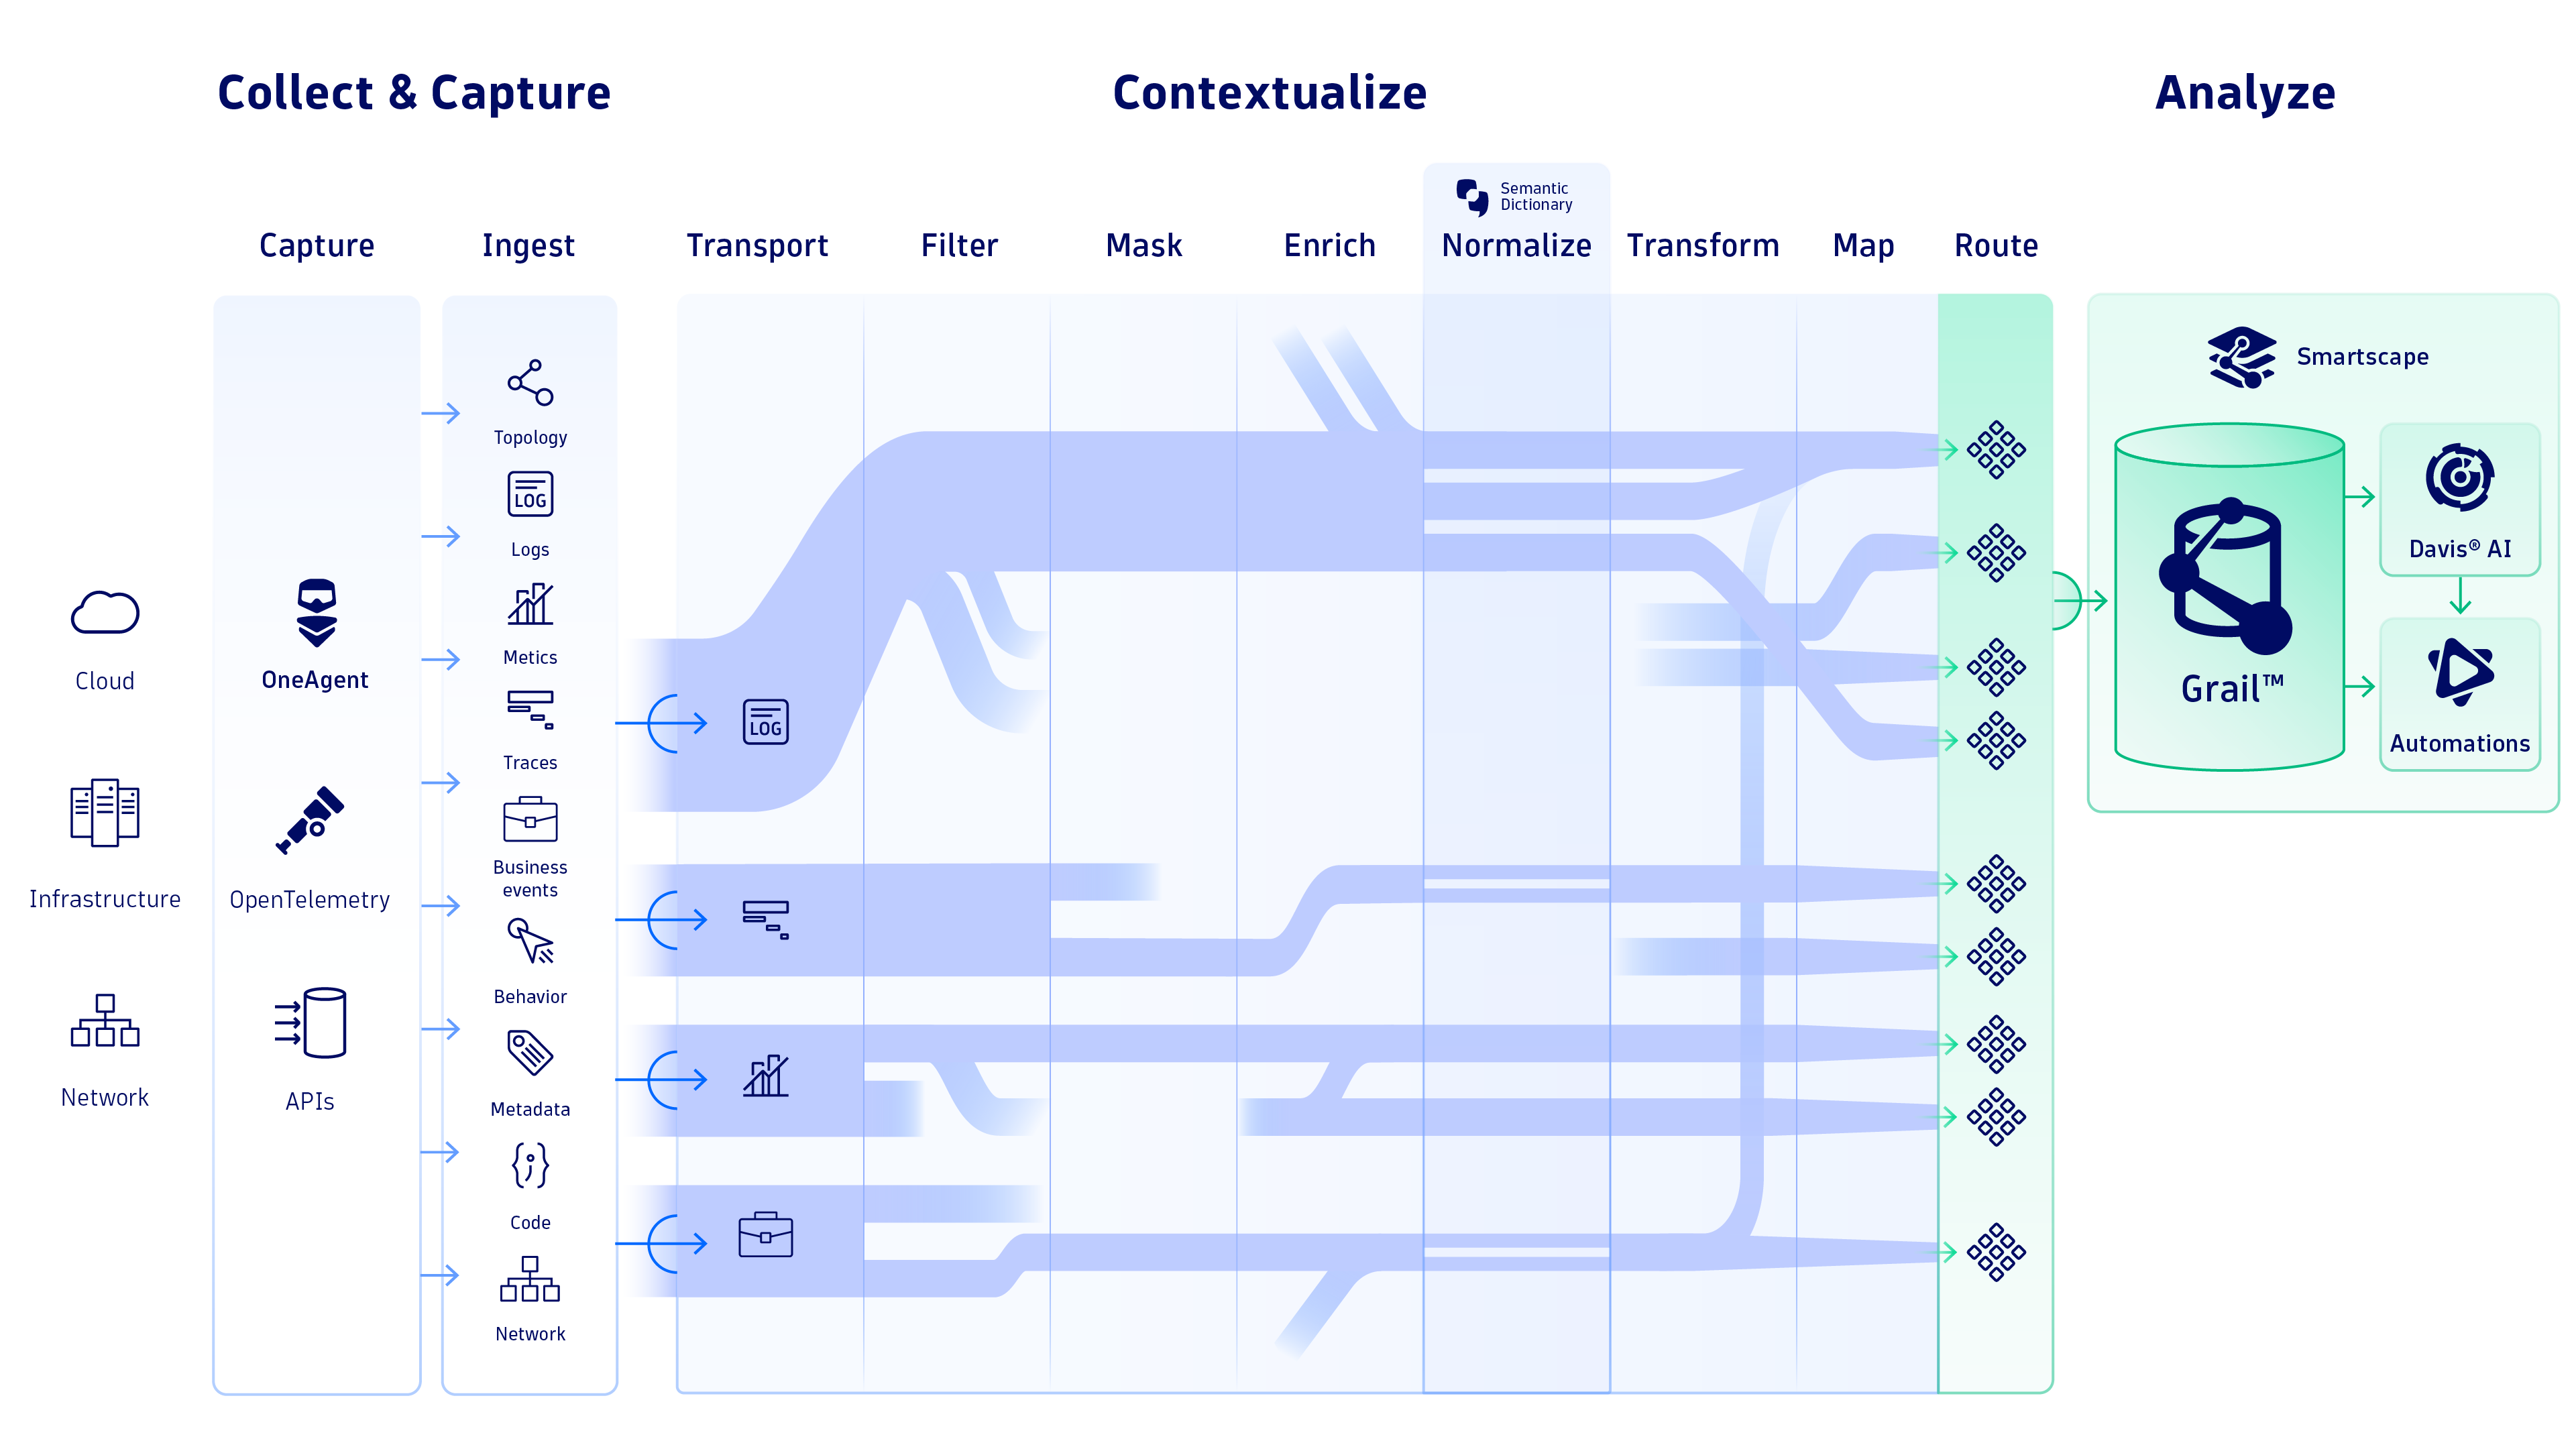
Dynatrace meets your teams where they are, with your preferred ingest routes and methods—be they Fluent Bit, OpenTelemetry, SysLog, or automatic log collection leveraging OneAgent, to name a few options.
If your team deploys applications cloud-natively, we meet you there, too, as we recently covered in our blog post, Dynatrace log management innovations: Syslog, AWS Firehose. We covered in rich detail how Dynatrace supports log ingestion for cloud-native workloads and simplified log ingestion also for hybrid environments.
In any case, at the heart of the Dynatrace Platform, Grail enables contextual analytics across unified observability, security, and business data. Grail is built for exabyte scale and leverages massively parallel processing (MPP) as well as advanced automated cold/hot data management to ensure that data remains fully accessible at all times, with zero latency, and full hydration.
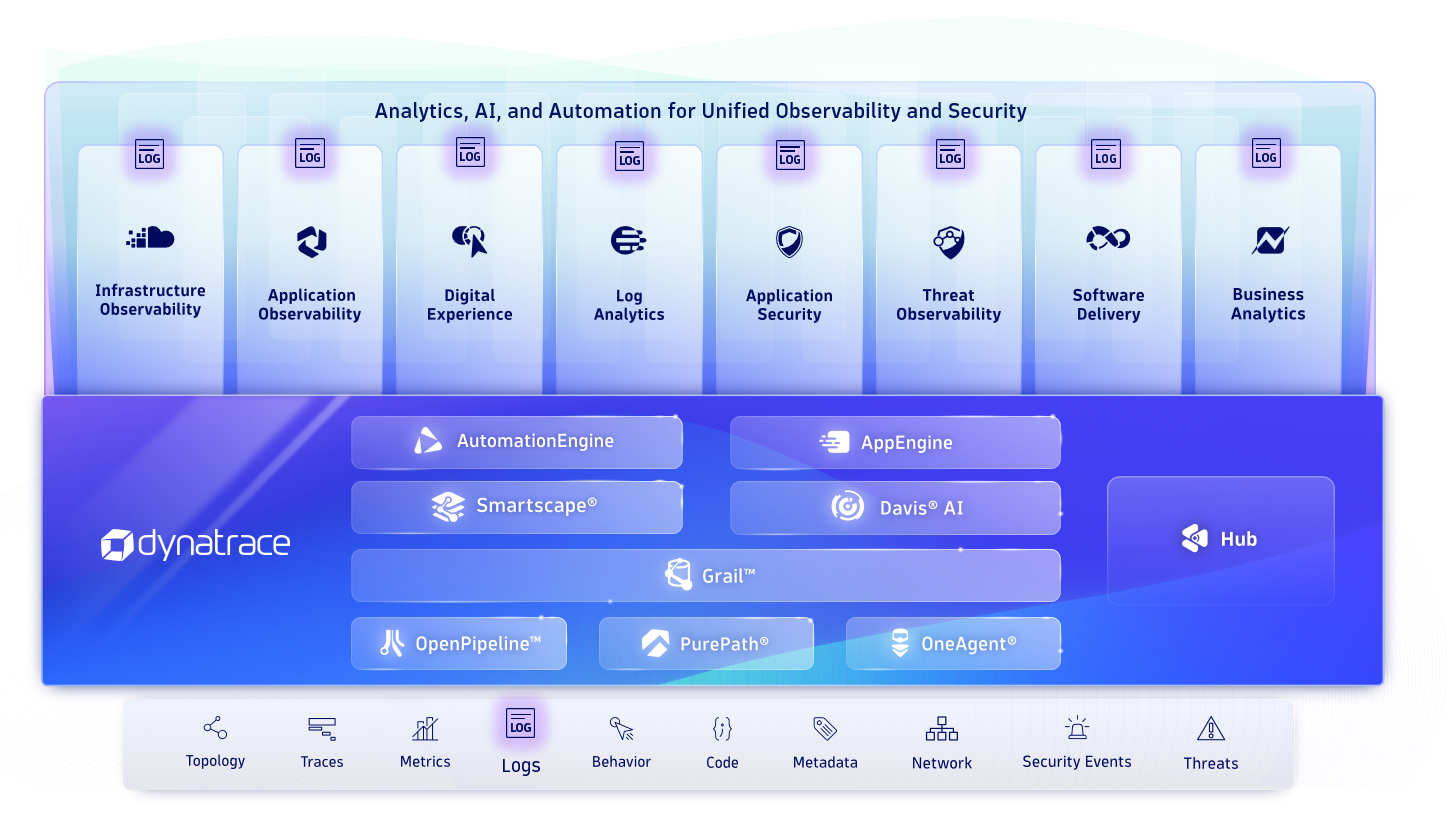
With no index or schema boundaries in place, paired with long-term data retention ranging from 1 day up to 10 years, you can leverage metrics, logs, and traces for a variety of additional use cases, such as business analytics or security analytics.
Dynatrace Application Security with logs
While most enterprises have Application Firewalls (AppFW), Intrusion Detection Solutions (IDS), and Static Code Analysis (SCA) in place for applications that will be deployed to production, it’s still relevant to understand if anomalies occur during runtime. Monitoring known vulnerabilities within the service hosting the application itself is just another puzzle piece to be considered for full end-to-end observability.
Instead of relying on static patterns, Dynatrace Causal AI understands the desired outcome of the triggered action and the context of the environment hosting the service. For example, deleting the database is not an expected outcome when the function provided is to update a user profile.
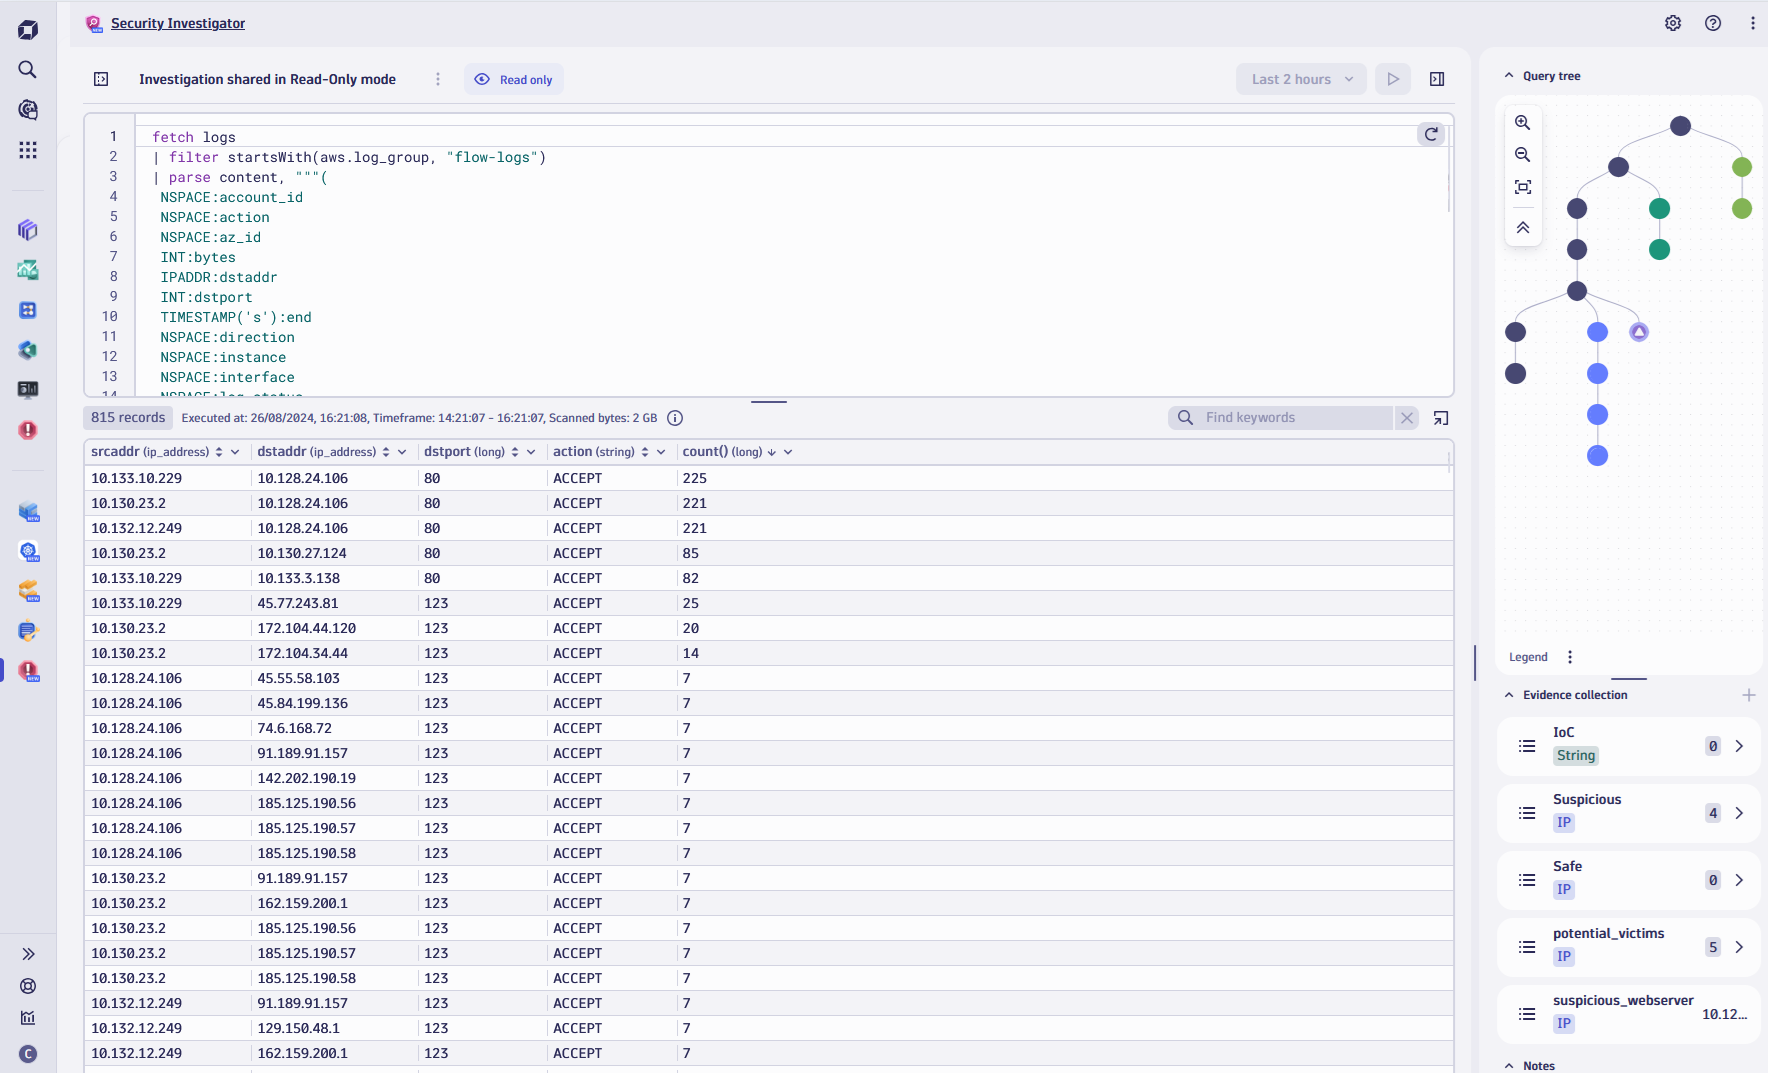
With these sophisticated security analytics, simple use cases such as authentication failure anomalies or password spraying attacks, along with more technical HTTP RST statistics, can be visualized in simple and sharable views in Security Investigator, leveraging logs.
Advanced analytics are not limited to use-case-specific apps. Dynatrace offers Notebooks and Dashboards to build views and reports—without the need to write a single line of code or Dynatrace Query Language, all supported by Dynatrace Davis CoPilot™ integration.
Dynatrace Davis CoPilot integration and AI-powered Application Security
Davis CoPilot™ assists occasionally visiting Dynatrace operators throughout the platform in a variety of applications, including Dynatrace Notebooks.
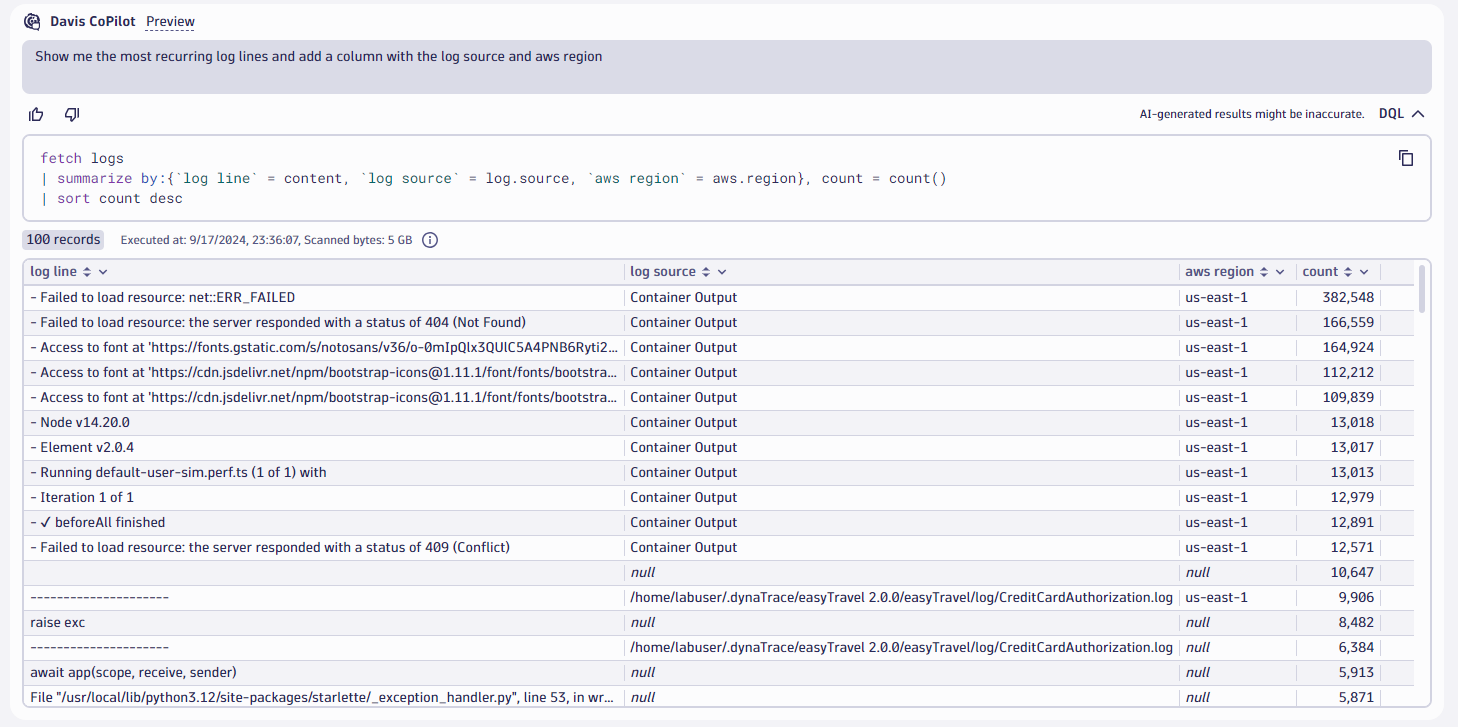
With natural language input in the example displayed in the screenshot below, “Show me the most recurring log lines and add a column with the log source and AWS region,” Davis CoPilot will evaluate the input, translate it into a corresponding DQL Query, and fetch the results accordingly.
Guardrails are in place and can be altered to prevent a high volume of unwanted material from being scanned or returned to Notebooks.
In the same way, Davis CoPilot can recommend remediation strategies and simplify security analysis across all data by translating natural language into the Dynatrace Query Language (DQL) to drive attack protection, security investigations, and forensics.
As mentioned, when ingesting relevant logs into Grail, including firewall and authentication gateway logs, Davis AI can provide end-to-end security insights. At the same time,
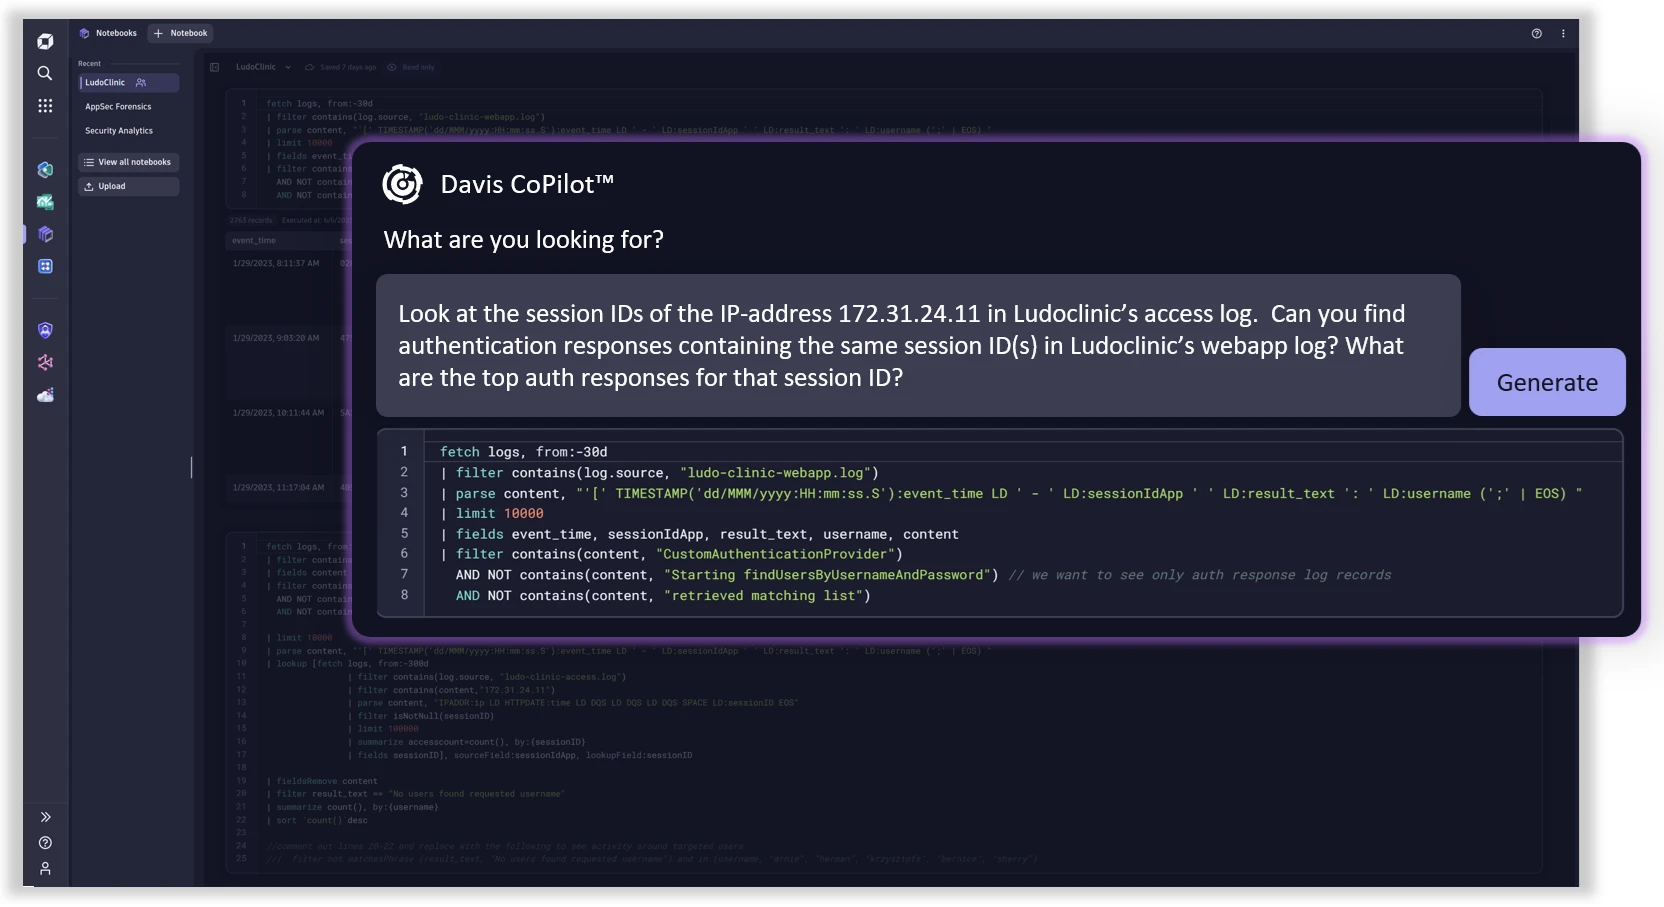
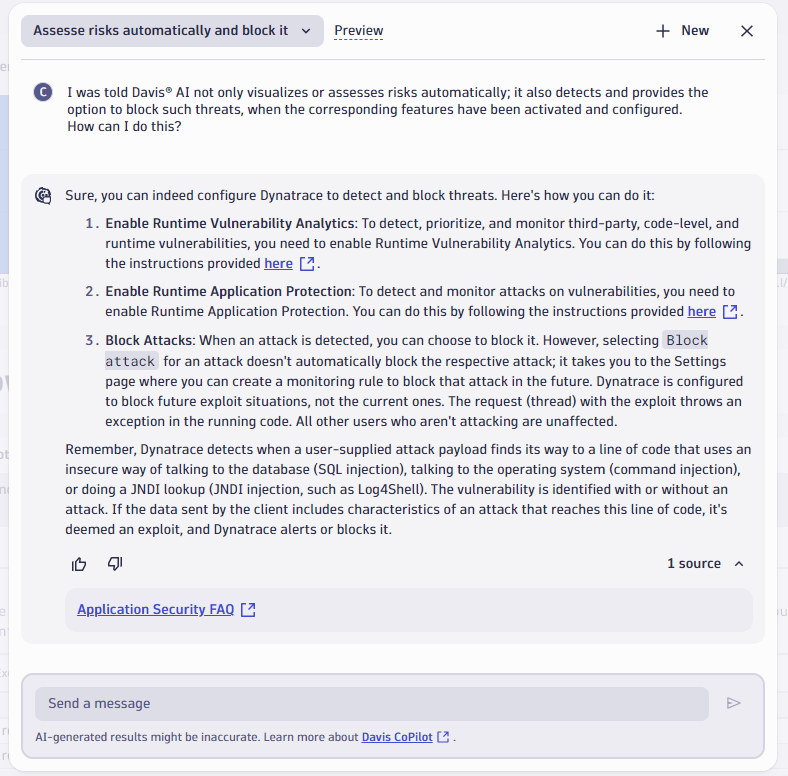
Davis CoPilot is integrated into the Dynatrace platform as an intelligent assistant to ease the effort of configuring and finding relevant details and options. By simply asking CoPilot the question stated above, you’re provided with the required configuration steps and product documentation references.
Schemaless: Instantly gain business event insights from logs
A unique picture can be drawn when logs from business-critical LoB applications are collected, which is an underestimated value that can be gained when using Dynatrace.
There are many customer examples and use cases, like room bookings in hotel portals, shopping cart statistics from online shops, or customer metrics from finance platforms, where customers can gain additional business value by translating logs to metrics within Dynatrace.
A pipeline health dashboard showing growth, paired with security-related information, is just one of the many examples of what you can build, either on your own or with the help of the Dynatrace Services team.
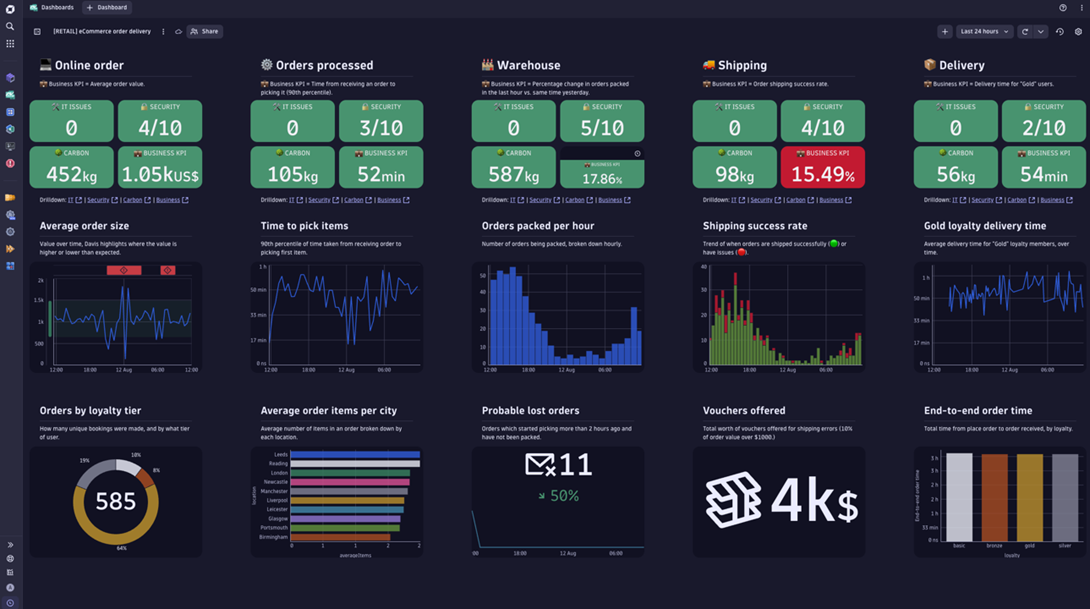
In our blog post, Leverage logs for an end-to-end view of your business processes via Dynatrace OpenPipeline, we demonstrated the retail company dashboard example above at a higher granularity, including the necessary steps for JSON log ingestion via Dynatrace OpenPipeline.
Conclusion
It’s simple, fast, and easy to ingest and gain multi-purpose value from logs—all without the need to be an expert or the requirement to first learn a complex query language.
Davis AI and CoPilot make it easy for casual contributors and power users to gain meaningful insights and build notebooks or dashboards while simultaneously increasing application security and reliability.
Learn how Dynatrace can address your specific needs with a custom live demo. Our observability experts will walk you through our solutions and show you how to deliver excellent customer experiences, foster your application security, and simplify IT operations.
If you’re not yet a Dynatrace customer, start your 15-day free trial.


Looking for answers?
Start a new discussion or ask for help in our Q&A forum.
Go to forum