AI and fully automated root-cause detection of performance issues are superior to any manual approach to analyzing highly dynamic software service architectures. It’s simply impossible for a human operator to manually follow the highly dynamic nature of transactions within microservices and serverless functions.
Dynatrace was the first monitoring platform that introduced an AI causation engine that fully automates the detection of anomalies, and more importantly, the identification of root causes.
Even though the Dynatrace AI supports the complete analysis process for critical situations, it’s still a challenge to present all Dynatrace findings within the root cause section of each problem details page.
Dynatrace identifies the causes, not just the symptoms
All the critical situations that Dynatrace detects pertain to the relationship between software services and malfunctions at the code level that negatively influence the stability or performance of underlying infrastructure. By automatically analyzing the dependencies between components, Dynatrace identifies not just whether a problematic service is the root cause, but its dependency on other services that run on different groups of processes within your data center.
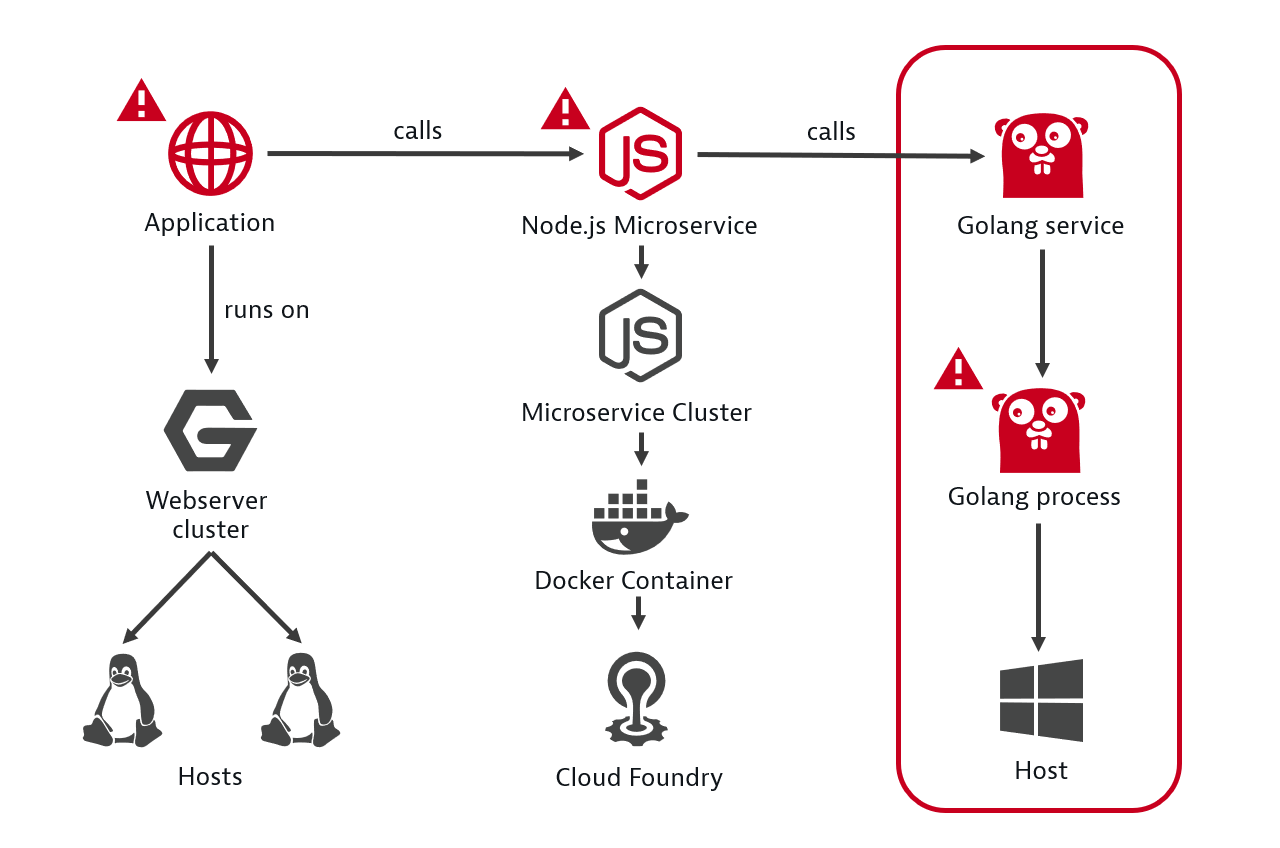
In the example below, Dynatrace AI automatically follows and evaluates the health of each relevant backend service within the transaction and finally identifies a Golang service as the root cause.

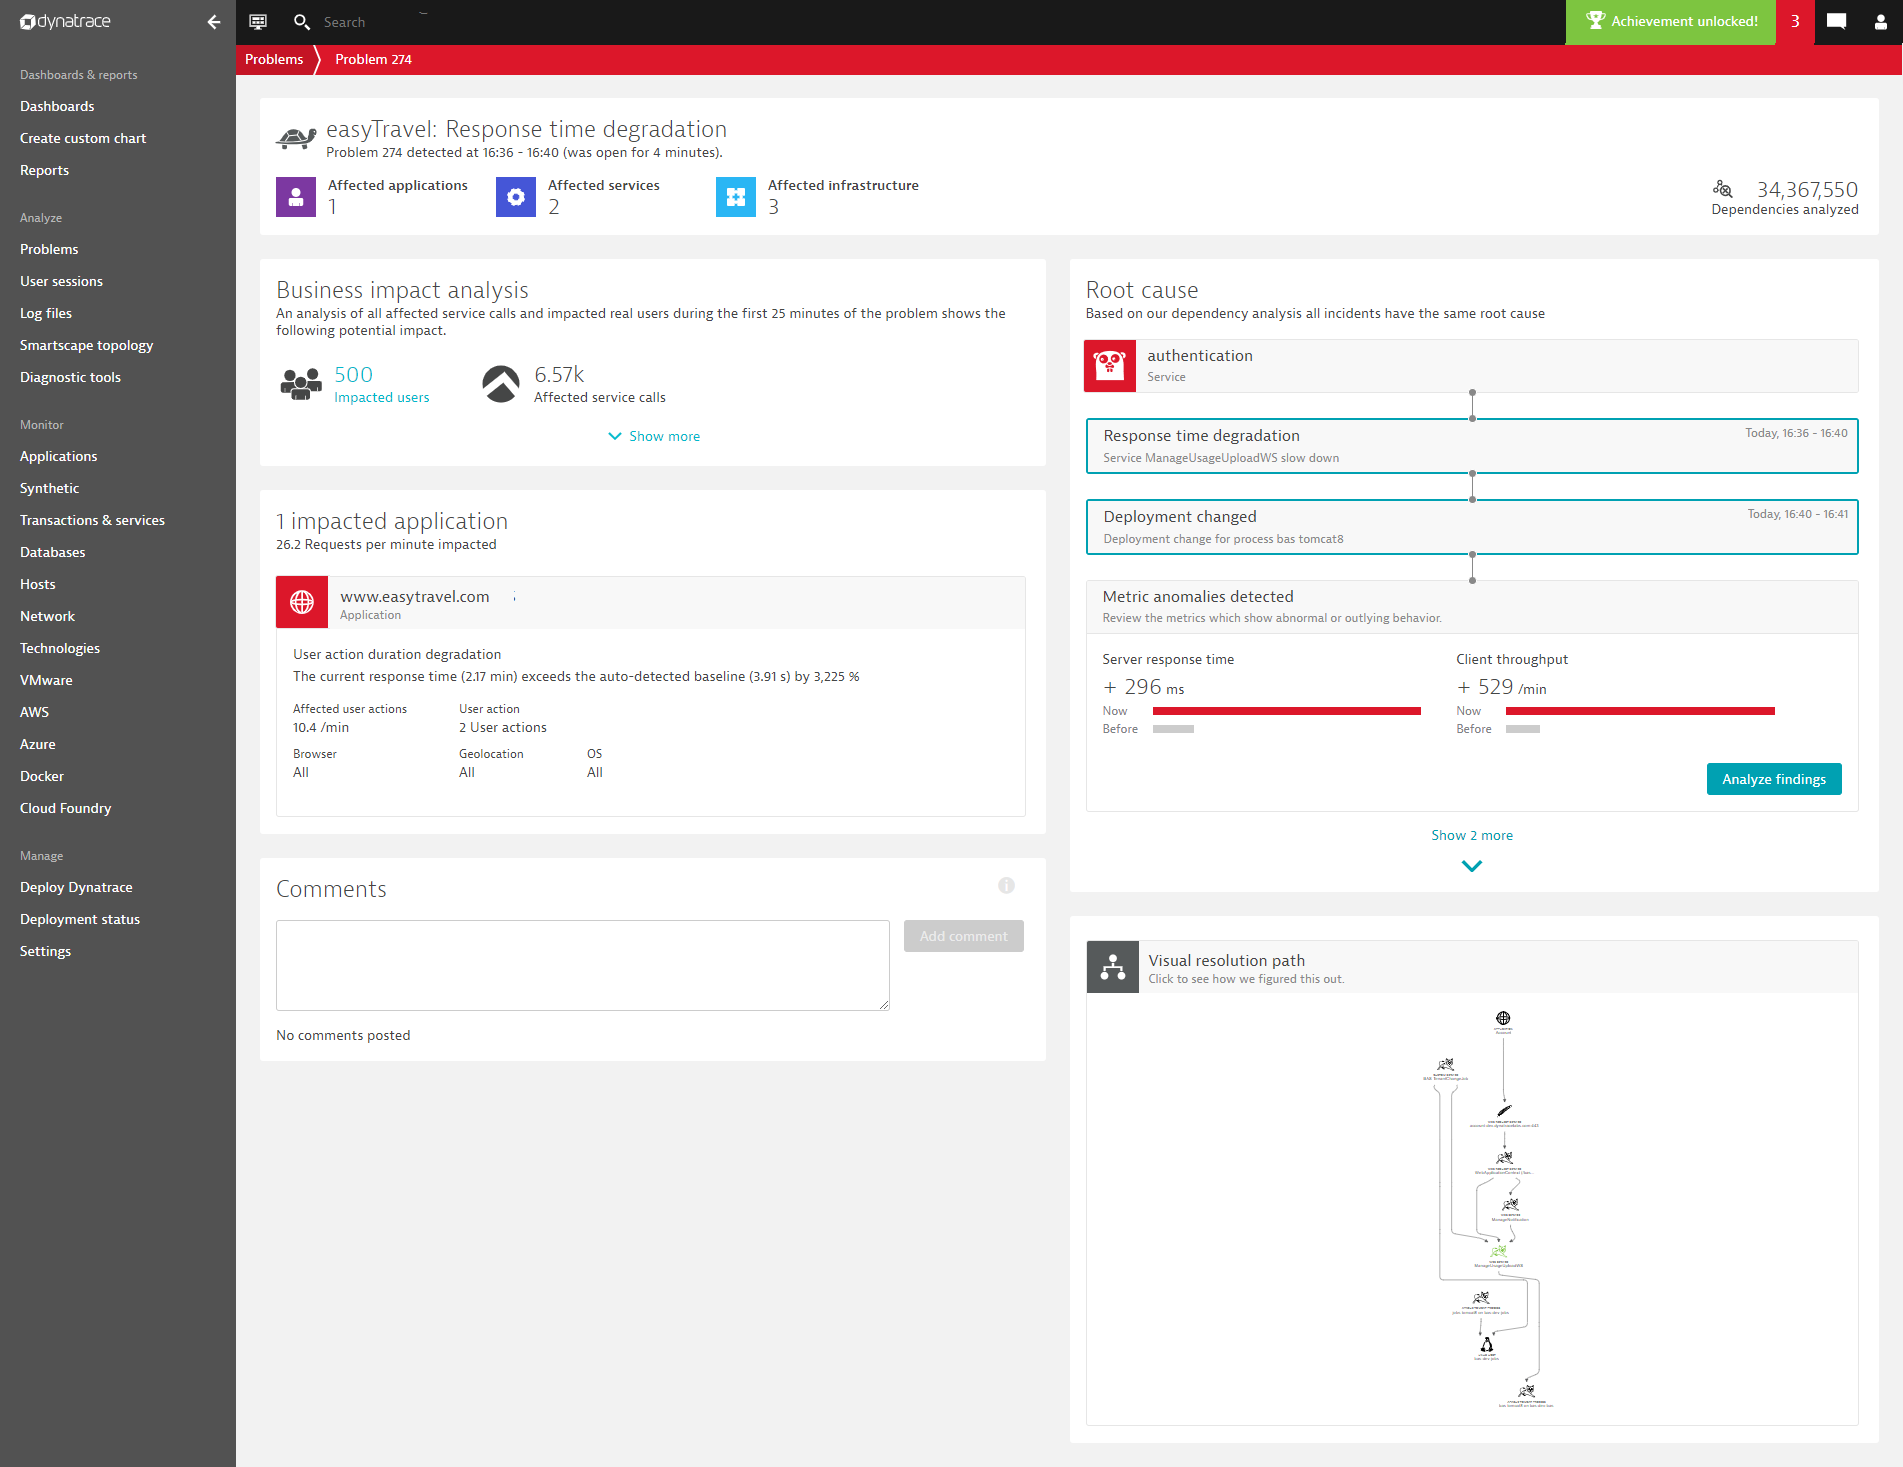
Understand the business impact and root causes of problems at a glance
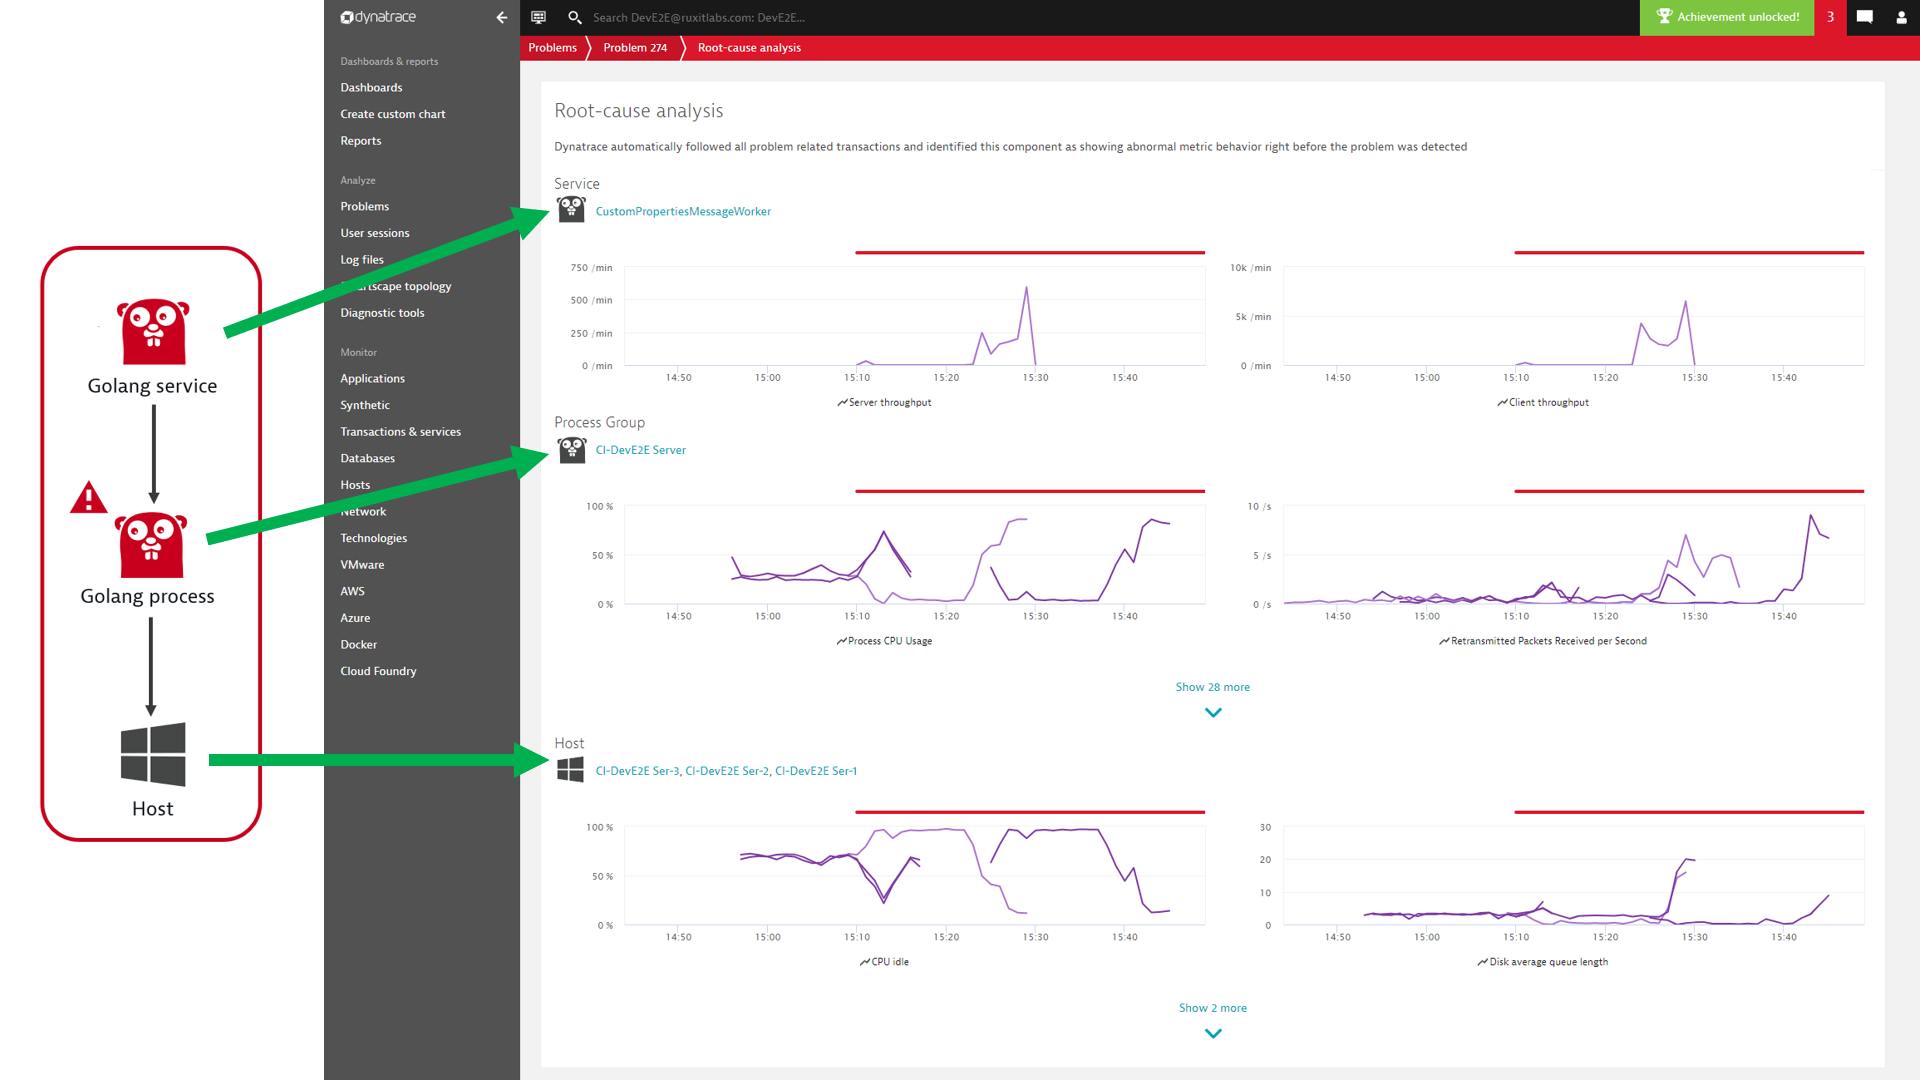
As a result, Dynatrace AI presents the complete, vertical technology stack of the Golang service within the Root cause section of the problem details page (see example below) and highlights all the relevant findings.
The new analysis identifies the root cause on the vertical service stack to explain the overall situation, such as a set of outliers within a large cluster of service instances.

Instantly get details on all affected service instances with the new Root-cause analysis view
While the problem details page shows a quick summary of the top contributors, click the Analyze findings button to drill down into a detailed analysis view.
This newly introduced grouped presentation of the root cause summarizes all the findings on the unhealthy service stack. It charts all affected service instances together along with all the identified abnormal metrics.
The ability to review all findings on the root-cause technology stack in one view saves a lot of clicks and allows you to visually correlate all the metric findings from top to bottom.
The analysis view shows all abnormal metric findings, stacked according to the service infrastructure. The top section contains all the unhealthy services, the middle section shows all findings on the underlying processes, and the bottom section shows the hosts.
As shown within the screenshot below, each vertical stack layer is shown as a tile containing all the metrics where abnormal behavior was detected.
If more than one service instance, process group instance, or Docker image is affected, the metric chart automatically groups instances into a combined chart that shows all metric findings on the vertical stack, as shown below:

Combined charts group clustered services
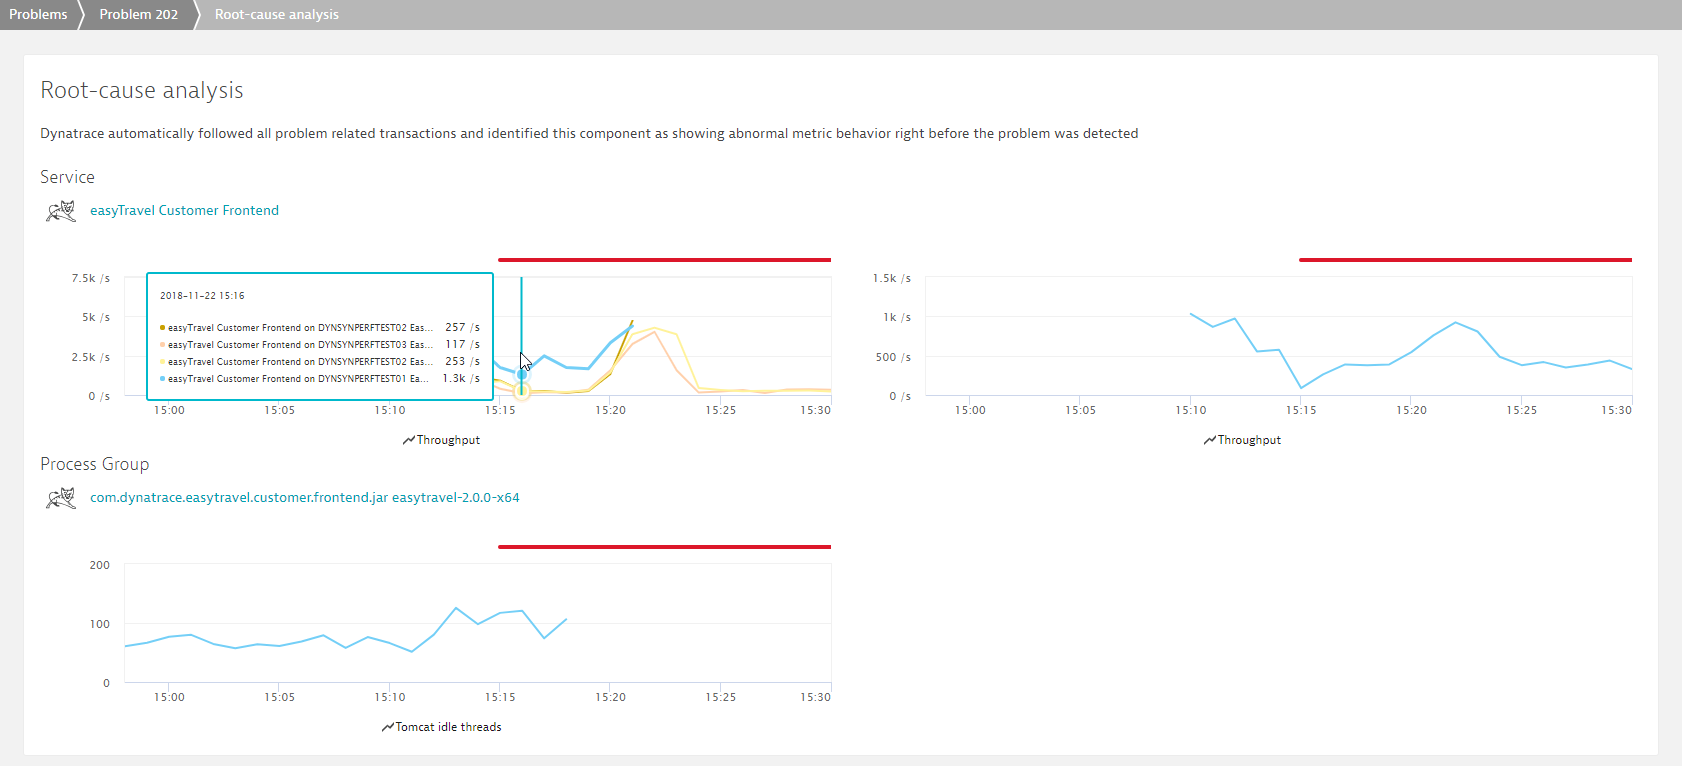
To further simplify the analysis of microservice cluster anomalies such as outliers or general degradation of multiple instances, all instances of the affected service are also summarized within a combined chart.
As shown below, in the case of a clustered service, all service instances that show abnormal behavior are charted:

The technology stack root causes capability has been available since Dynatrace version 1.160. They should save you a lot of clicks during the analysis of complex situations.
Read more about the detailed capabilities within our help on Next Generation root cause analysis.


Looking for answers?
Start a new discussion or ask for help in our Q&A forum.
Go to forum