In my current work, I spend a lot of time with keptn – an Open Source Control Plane for Continuous Deployment and Automated Operations. I deployed keptn on a GKE cluster and it’s been running there for the past couple of weeks. I have been using it at my current tour through different conferences (Devoxx, Confitura) and meetups, (Cloud Native, KraQA, Trojmiasto Java UG) where I’ve promoted keptn. If you want to know more about keptn, I encourage you to check out www.keptn.sh, “What is keptn and how to get started” (blog), “Getting started with keptn” (YouTube) or my slides on Shipping Code like a keptn.
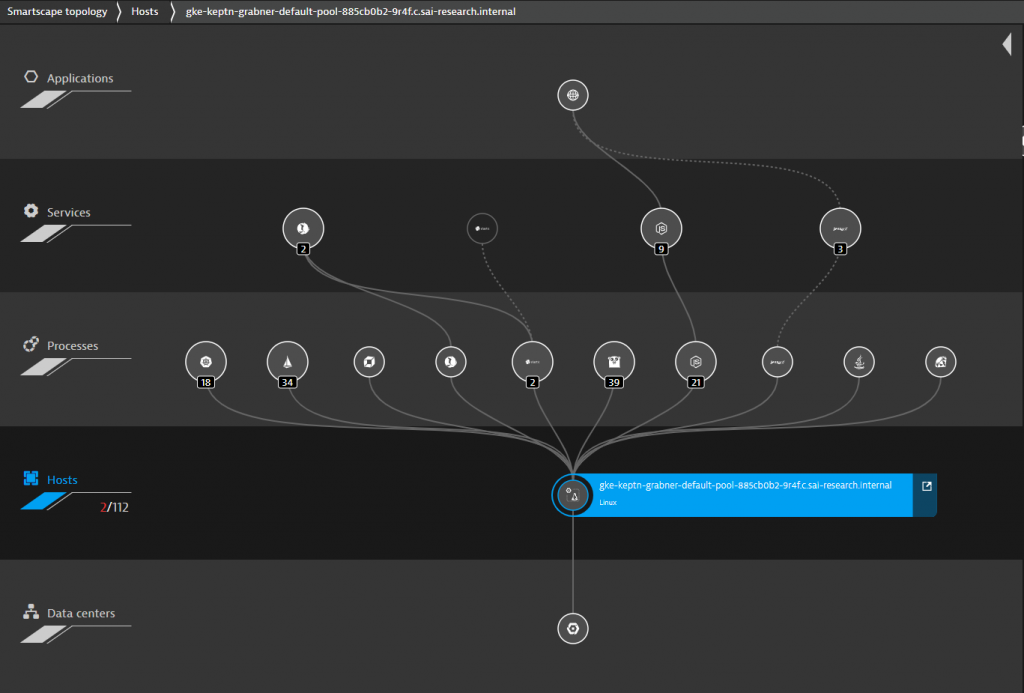
Keptn is currently leveraging Knative and installs Knative as well as other depending components such as Prometheus during the default keptn installation process. As I highlight the keptn integration with Dynatrace during my demos, I have rolled out a Dynatrace OneAgent using the OneAgent Operator into my GKE cluster. The following is the Smartscape view from my single node cluster:

So far so good.
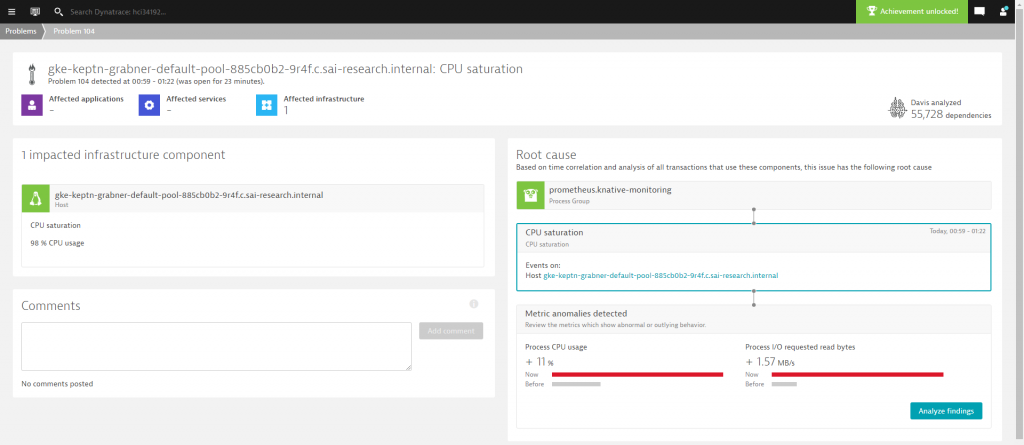
My environment worked well the first couple of days until I started receiving unexpected alerts from Dynatrace about CPU issues in my k8s cluster. Initially, I ignored these errors as I assumed them to be a side effect of my demos where I deploy a faulty application and expect Dynatrace to alert keptn in order to kick-off the auto-remediation use cases. During my demo at KraQA, I realized that things were taking much longer than expected, which is why after my presentation I finally took a closer look into what Dynatrace had been alerting me on for a couple of days:

Alerting on high CPU is not special – but – I am really only running a small node.js based sample service in a staging and production namespace, a Jenkins instance and execute some moderate load to “simulate constant production traffic”.
Automated Metric Anomaly Detection
Well – I should have paid more attention to the Dynatrace problem. Thanks to the automated dependency information (=Dynatrace Smartscape), Dynatrace’s AI Davis® automatically analyzes every single metric along the dependency tree. That happens for both vertical dependencies (host, processes, services, applications) as well as horizontal dependencies (process to process through network monitoring, service to service through automated tracing).
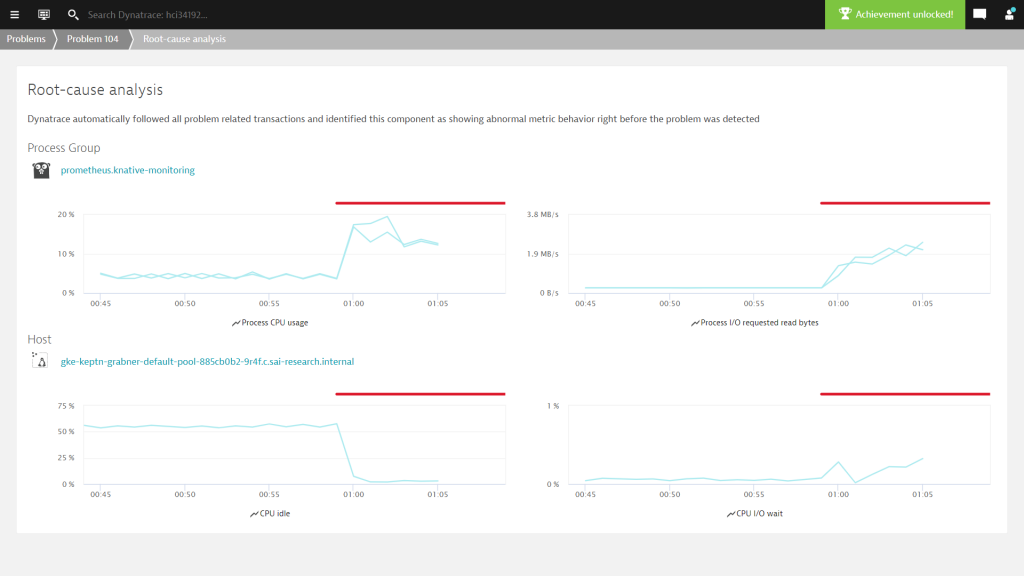
When clicking on “analyze findings” in the problem screen I get to see which of the metrics along the dependency model shows an abnormal behavior and is most likely the root cause. In my case, both prometheus.knative-monitoring pods jumped in Process CPU and I/O request bytes. The GKE node on the other side sees a drop in CPU idle (that’s obvious) and an increase in CPU I/O wait:

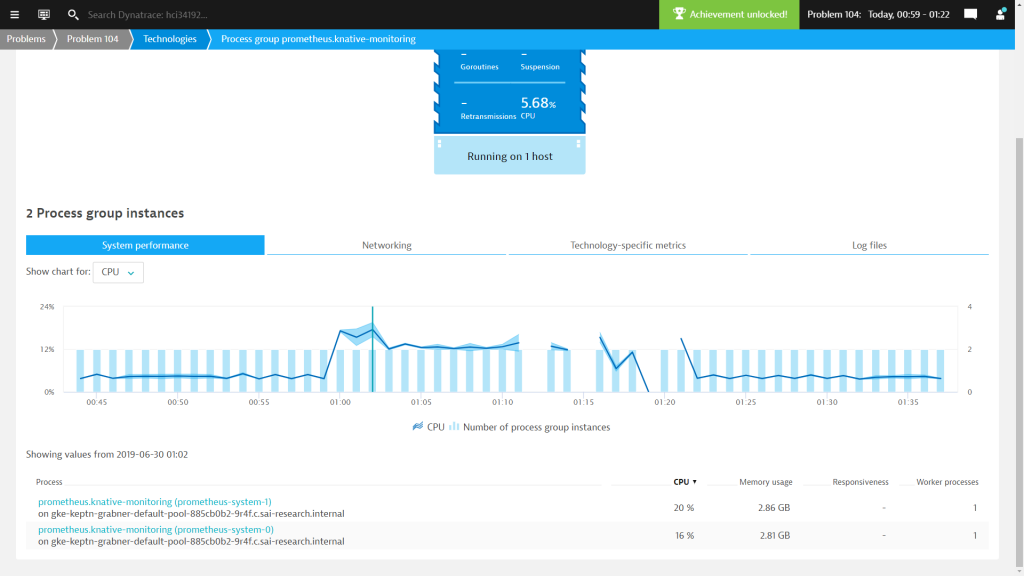
A click on the Prometheus process group link brings me to more data about these two pods.
Automated Container Log Access
The last tab in that screen gives me direct access to the log files written by these pods as the Dynatrace OneAgent provides automated access and analysis of container logs:


A click allows me to view all logs or query for interesting log entries:

Seems there is some massive WAL (Write Ahead Log) activity going on. A quick google search reveals several articles on Prometheus performance optimizations we should look into.
Historical Data and Frequent Error Detection
Remember that I told you I initially ignored these errors as I thought they are just part of my demo? Well – looking back at historical data shows me that there was a clear pattern of the Prometheus GC CPU spike:

The following is focusing on the 72h range of when I did most of my demos in Warsaw:

If you look at the CPU chart with the red dots on top that indicate a Dynatrace detected issue when I can correlate that with the demos I gave.
- On Thursday, June 27th in the evening, I was presenting at the Cloud Native Meetup in Warsaw where I showed several keptn deployment pipeline runs.
- On Friday, June 28th was quiet, as I actually took most of the day off to explore Warsaw with my wife who joined me on my recent trip
- On Saturday, June 29th I was at Confitura where I started to prep for my talk around lunchtime until my talk finished at 6pm. After 6pm I was done with work – but – it seems that the CPU problem kept going on for quite a while longer.
I did some further digging – such as looking at all the other processes and containers as all this data is available in Dynatrace. There was no other process that showed any abnormal resource consumption. BUT – I kind of already knew this because Dynatrace would have otherwise included this information in the problem ticket:

Lessons Learned, Action Taken & Next Steps
Prometheus is a great open source monitoring solution in the cloud-native space that gives me a lot of metrics. But it seems the keptn team needs to invest more time in optimizing it – especially when it gets introduced through other depending frameworks such as Knative.
Dynatrace on the other hand – easily deployed through the OneAgent Operator – gives me automated full stack visibility, all metrics I could ask for and, thanks to the deterministic AI algorithms, not only leaves me with metrics but provides impact and root cause analysis out of the box. And it even monitors Prometheus and tells me what’s wrong with that deployment!
The immediate actions taken were that we deleted a couple of deployments in our knative-monitoring namespace that are not essential for keptn operation – especially because I use Dynatrace for monitoring anyway. Here are the commands I executed in case you run into similar issues:
$ kubectl delete deployment grafana -n knative-monitoring
$ kubectl delete deployment kube-state-metrics -n knative-monitoring
$ kubectl delete statefulset prometheus-system -n knative-monitoring
That drastically reduced my CPU consumption, as you can see here:

In an exchange with the keptn development team, we agreed that keptn needs to become more lightweight overall and the team is, therefore, doing research aimed at reducing overall resource consumption as well as optimizing settings that will improve overall stability and performance.
Looking forward to the next versions, weeks and months to come!


Looking for answers?
Start a new discussion or ask for help in our Q&A forum.
Go to forum