New support for the IBM z/OS operating system automates log discovery and enables collection at scale. Get better hybrid cloud observability with the Dynatrace platform by including automatically enriched log data and faster issue troubleshooting.
Logs become an integrated part of observability
Organizations face daily challenges in delivering integrated digital services essential to meeting their business goals. This is particularly true in hybrid cloud architectures, where system complexity, security, and performance are difficult to manage across cloud providers and the IBM Z mainframe platform.
A prerequisite for a successful hybrid cloud is maintaining observability, including all telemetry signals: logs, metrics, and traces. Without combining these signals in a unified AI-powered observability platform, the effectiveness of AIOps workflows in remediating problems is diminished, leading to wasted investment.
The Dynatrace® software intelligence platform can help you manage the complexity of digital services and hybrid clouds by providing holistic end-to-end visibility from the frontend, where your customers interact with your application, to the backend, where business transactions are processed.
Extend root cause analysis to logs on IBM z/OS
Dynatrace provides a platform for observing hybrid clouds and introduces support for log collection of the IBM z/OS operating system. This includes IBM CICS regions and IBM IMS subsystems.
You can now extend root cause analysis for any issue identified by Davis® AI with logs that are automatically linked to z/OS applications, transactions, or other identifiers specific to the environment hosting the resources.
Dynatrace offers log management and collection in a single place for public and private clouds and mainframe platforms such as IBM Z or LinuxONE. This makes log collection policies much more effective and transparent.
For example, you can apply a filter change to ignore certain logs from your central Dynatrace environment on all your monitored platforms without making any manual adjustments.
Centralized data masking rules allow administrators to easily configure the masking of sensitive data. This allows customers to address local or industry-specific regulatory or privacy requirements. The configured rulesets are directly deployed to the OneAgents, where the logs are collected.
Speed up your troubleshooting processes
Log analysis is typically one of the first steps in troubleshooting frontend problems. When a critical issue arises, it’s essential to have the right logs available to quickly and easily understand the full scope of what’s happening within your applications on the backend.
Dynatrace automatically discovers and collects logs from monitored IBM CICS regions and IBM IMS subsystems. All collected logs are enriched with metadata to map them to the entity model of z/OS hosts (logical partitions) and z/OS processes (regions and subsystems).
Dynatrace dramatically shortens Mean Time To Identify (MTTI) and Remediate (MTTR) times for incidents, as relevant log lines are provided in the context of detected problems.
Incidents are often not tied to a single component, as surrounding components and services can cause disruptions. With a single click, Dynatrace provides a surrounding logs view, showing the log lines of related components.
The newly released Dynatrace Logs app offers broad insights for manual investigation. Easy click-to-filter elements and a newly introduced DQL editor capable of translating these selected filters into Dynatrace Query Language (DQL) improve the experience for novice users.
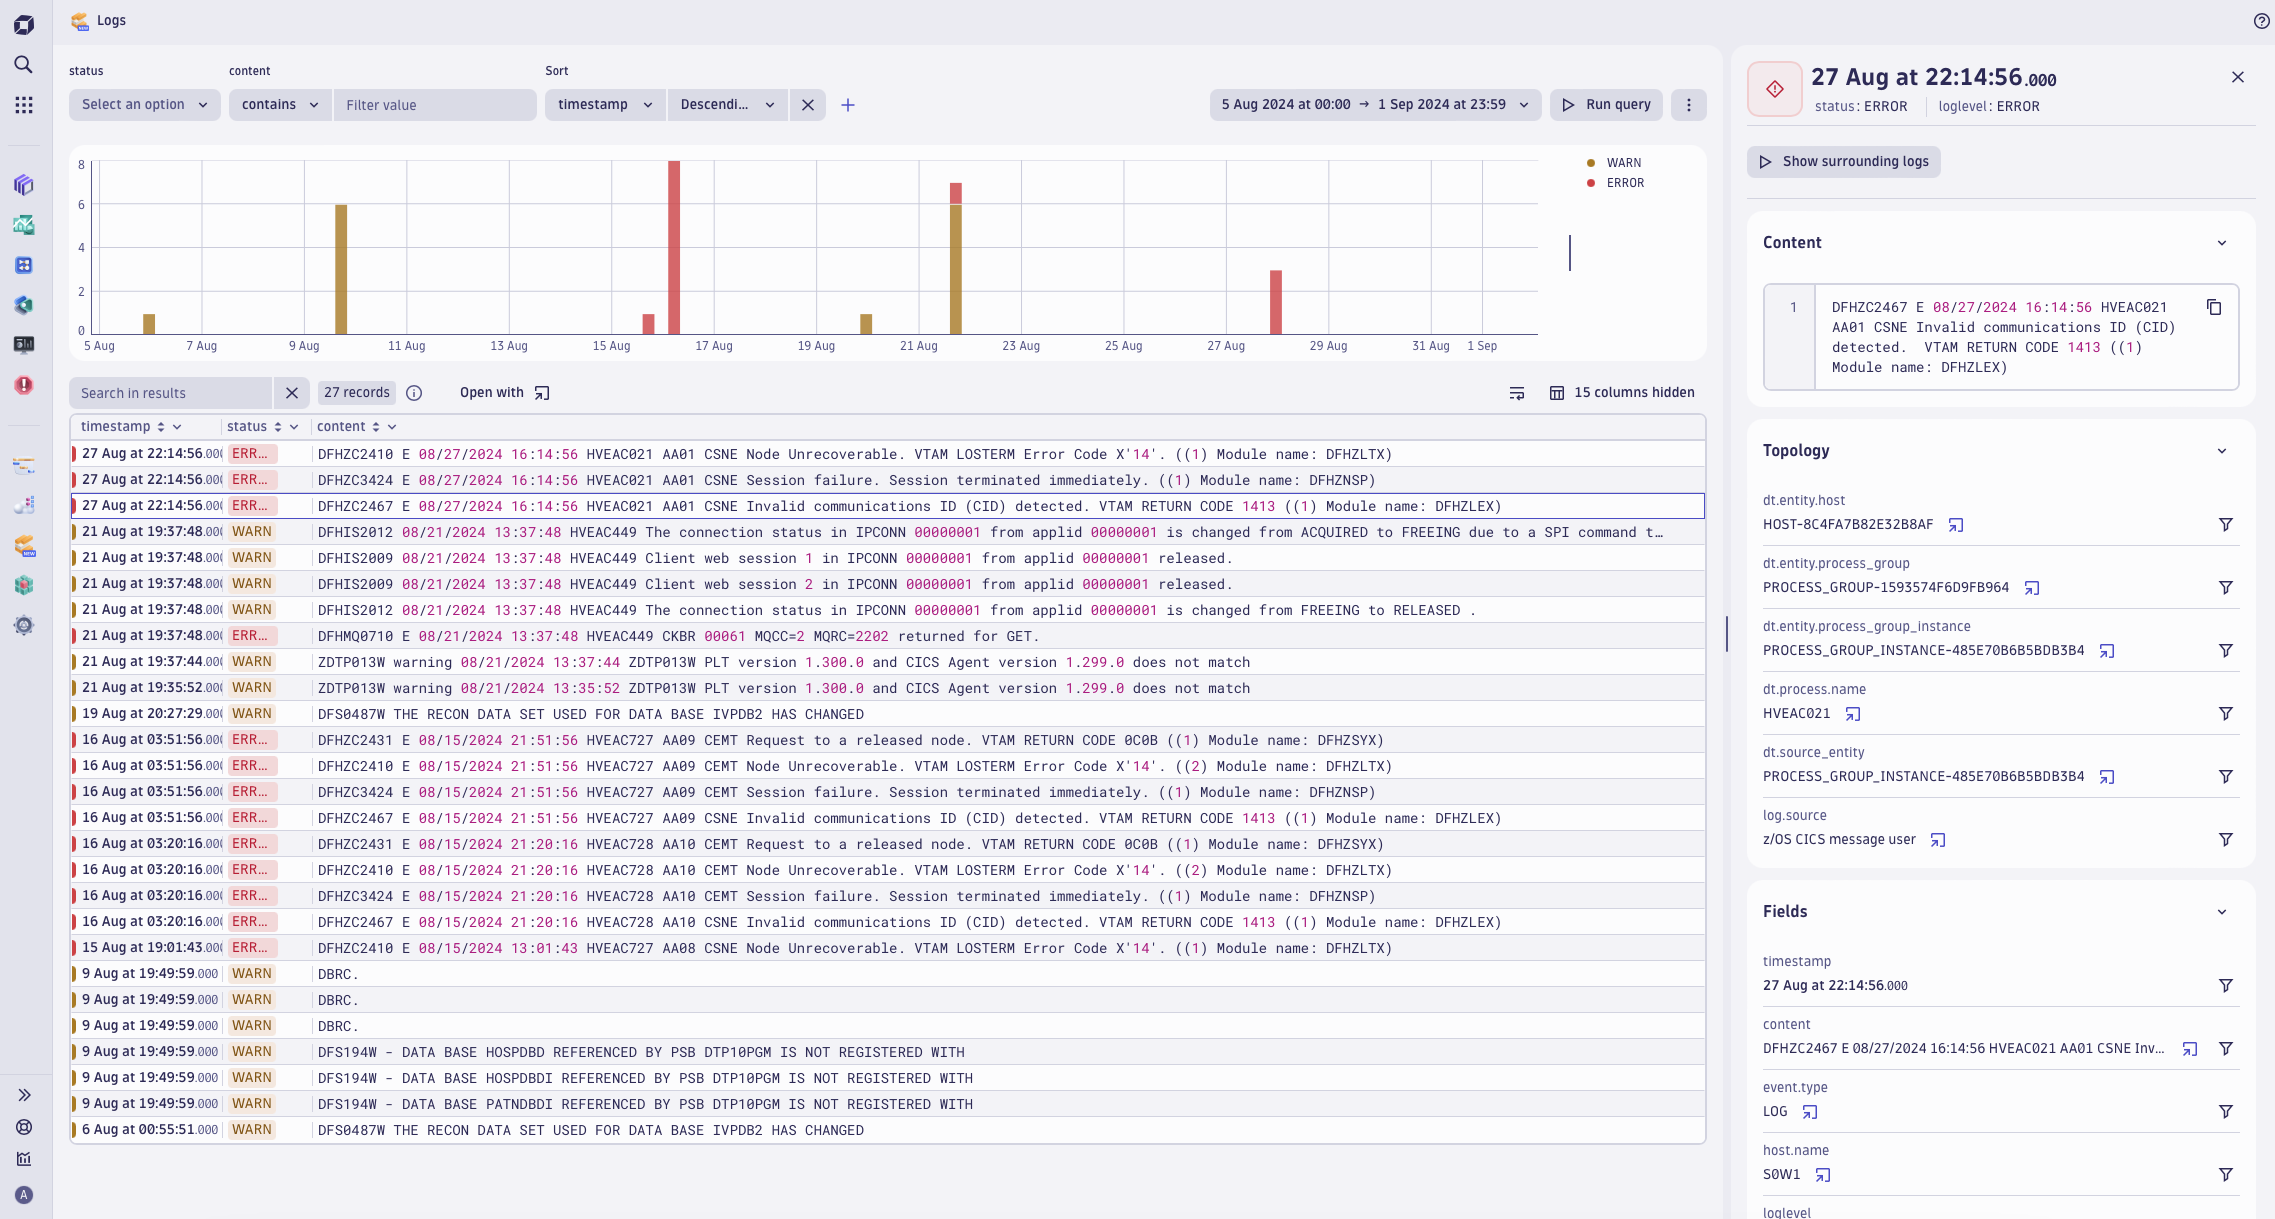
Thanks to the enriched log data, log lines are connected to the respective z/OS Host pages.
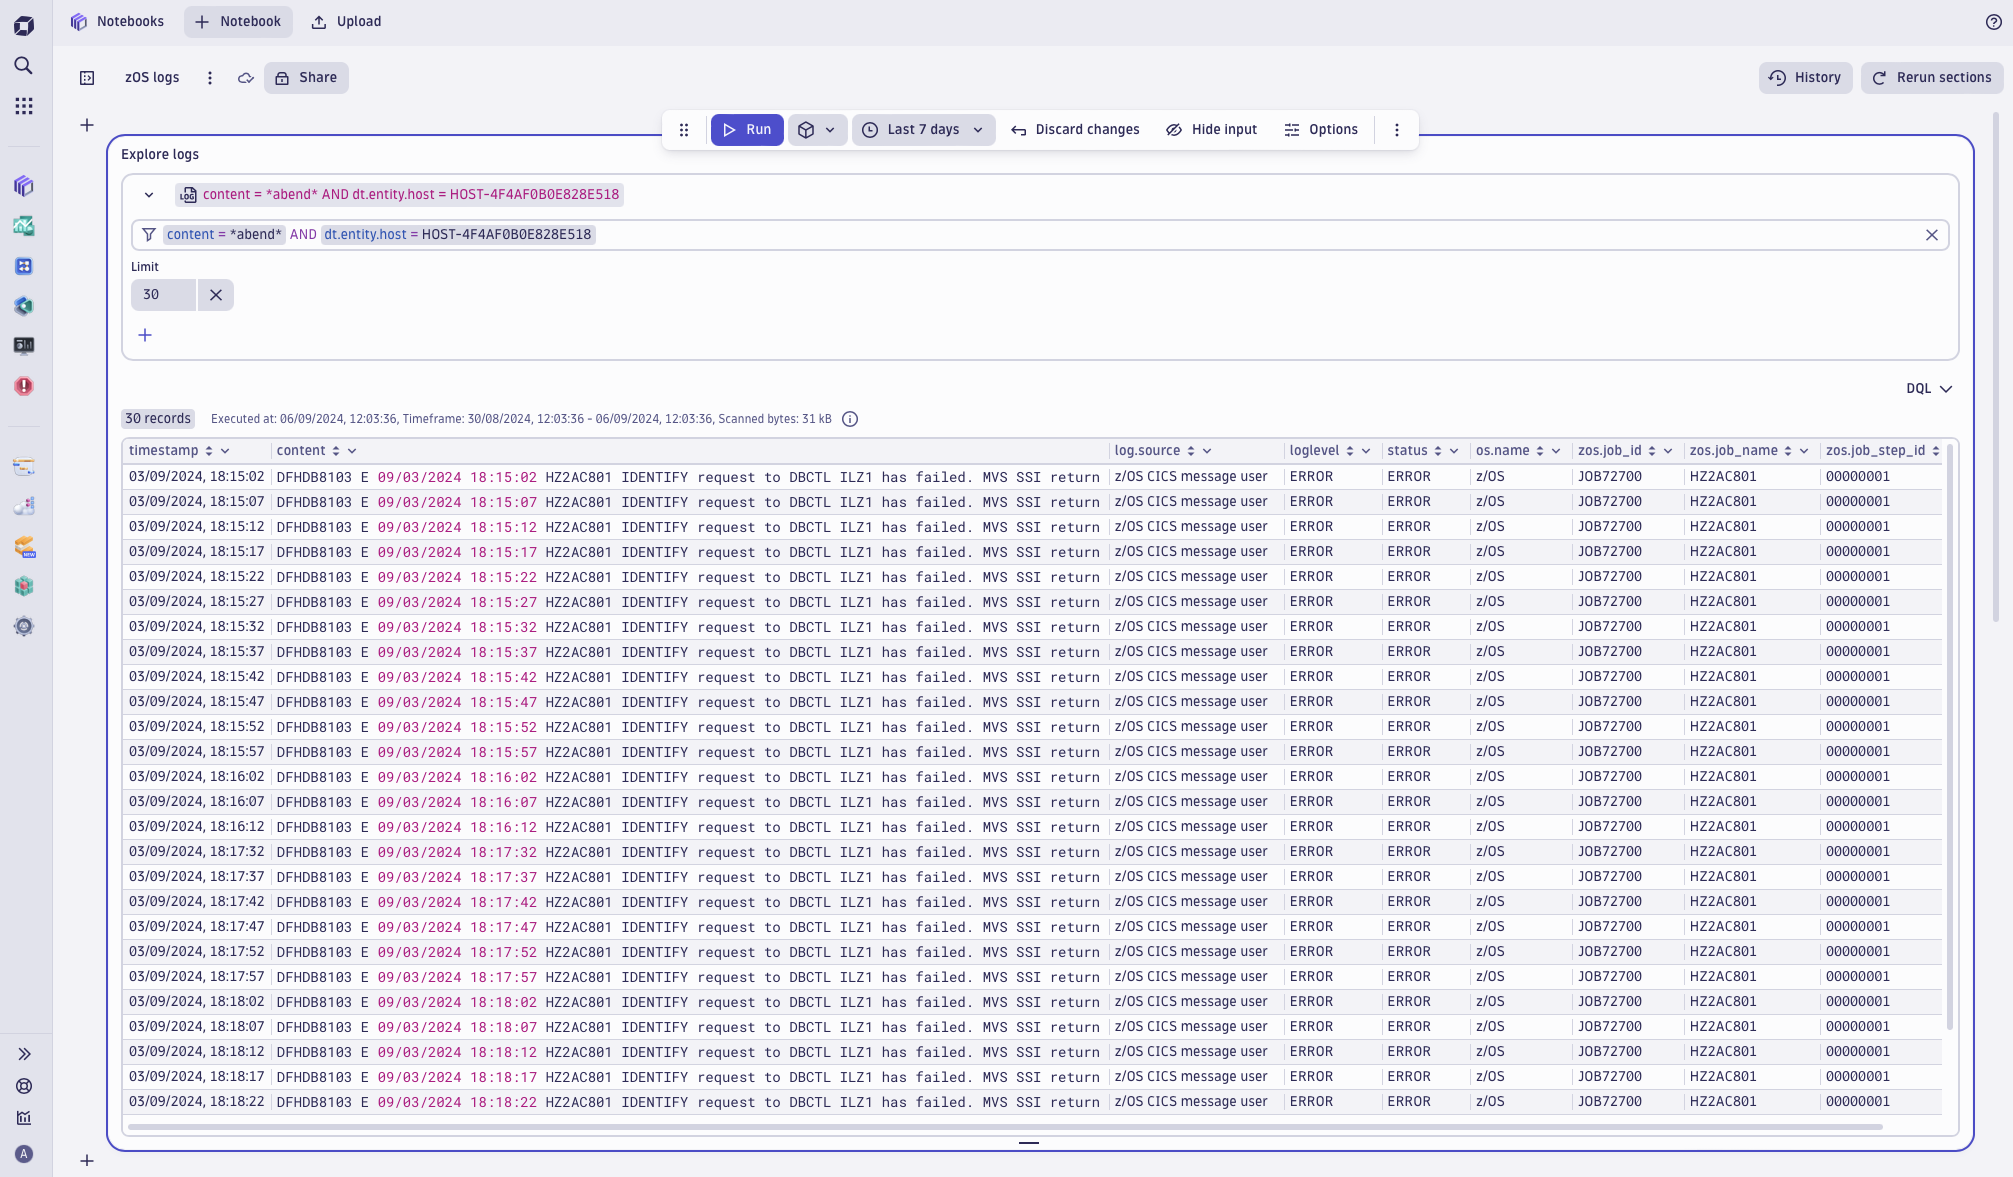
Monitoring logs with Dynatrace facilitates novel ways to analyze telemetry data, significantly expanding the observability use cases for IBM Z mainframes. For example, with DQL queries, operators can quickly access all abends or drill down into specific job statistics.
Dynatrace Notebooks allows deep analysis by leveraging the Dynatrace Query Language within notebooks along with the newly introduced Davis CoPilot™ integration, a natural text-to-DQL builder.
Get started with logs on Dynatrace
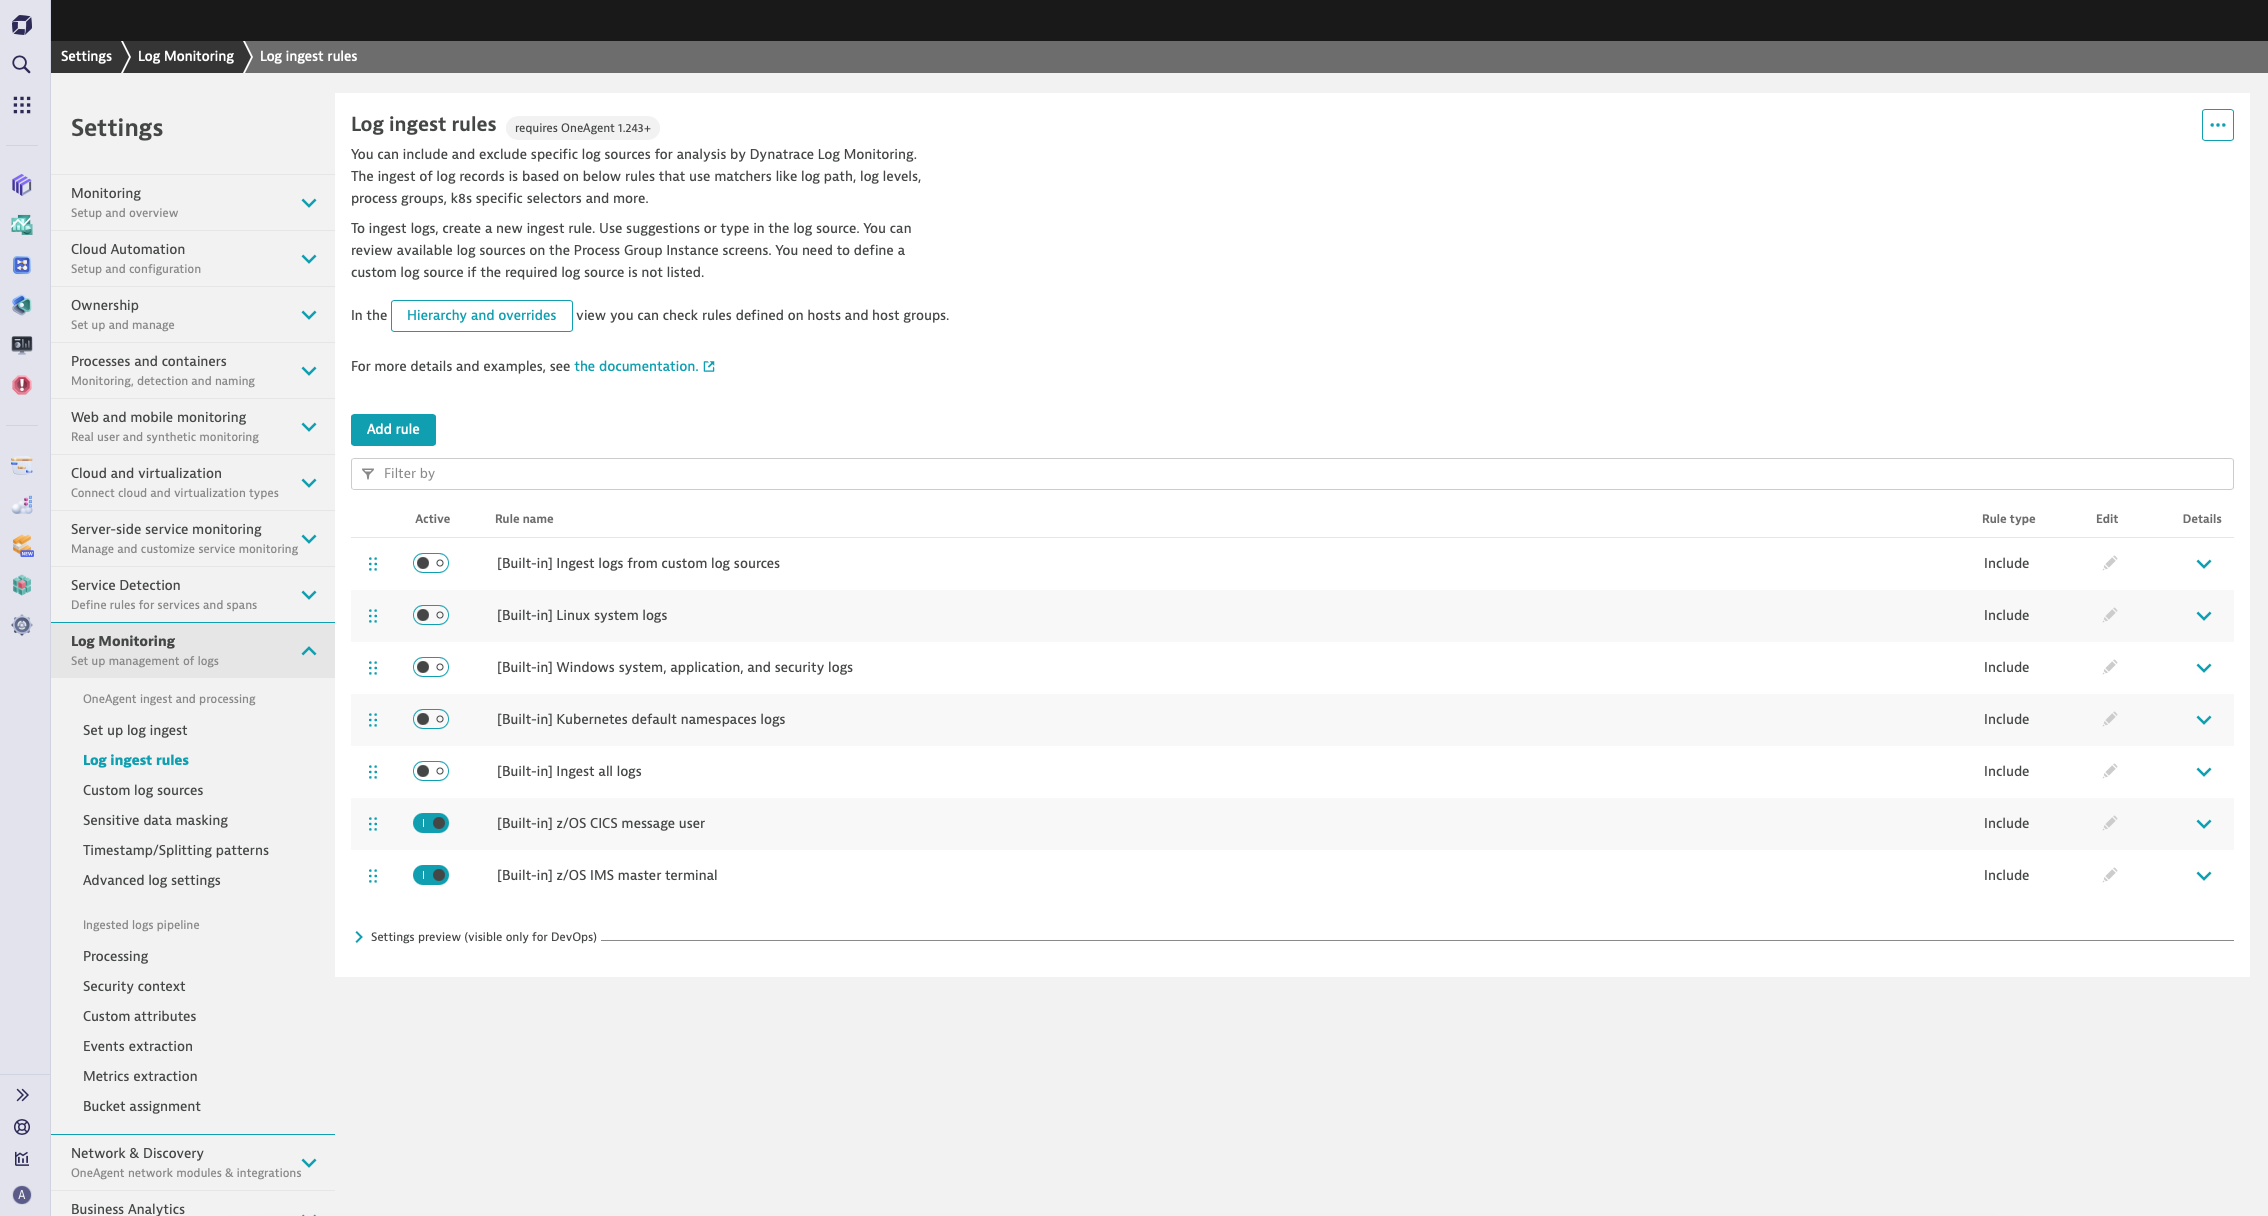
Get started with Log Management and Analytics powered by Dynatrace Grail™ or Log Monitoring Classic (for Dynatrace Managed deployments). To start, deploy Dynatrace on your IBM z/OS operating system and set up log collection. You can easily set up log collection by turning on the provided z/OS log ingest rules globally or for a specific host.
Go to Settings > Log Monitoring > Log ingest rules and turn on z/OS CICS message user and z/OS IMS master terminal to start collecting logs.
- Log monitoring on IBM z/OS is available with the release of Dynatrace OneAgent version 1.297 and ActiveGate version 1.297 (with the zRemote module) for Dynatrace SaaS and Dynatrace Managed.
- For details about advanced log configurations, such as sensitive data masking, see our Monitoring z/OS logs documentation.
- Dynatrace log monitoring is also available for Linux on IBM Z and LinuxONE. For more details, see the blog post, Enable full observability for Linux on IBM Z mainframe now with logs.




Looking for answers?
Start a new discussion or ask for help in our Q&A forum.
Go to forum