Complexity is ever-increasing in today’s fast-paced world of software deployments and cloud infrastructure. This is why Davis® AI root cause analysis is an indispensable tool for Operations, Site Reliability, and DevOps teams.
Without AI-assisted observability tooling, the productivity of operations teams drops, leading to a dramatic increase in Mean Time to Repair (MTTR) and a significant rise in the personnel needed to manage critical incidents. In an era dominated by automated, code-driven software deployments through Kubernetes and cloud services, human operators simply can’t keep up without intelligent observability and root cause analysis tools.
Modern observability has evolved from simple metric telemetry monitoring to encompass a wide range of data, including logs, traces, events, alerts, and resource attributes. Dynatrace Root Cause Analysis (RCA) seamlessly integrates all this information, providing crucial analysis to remediate incidents in real time.

By offering root cause analysis on top of the highly flexible Grail™ data lakehouse, Dynatrace empowers SRE and operations teams to further reduce MTTR. Direct access to the underlying data allows the automatic RCA analysis to eliminate data silos and to dive deep into every aspect of the collected incident data.
Unlike generic DIY query frontends, the Dynatrace Problems app is a tailor-made solution for efficiently supporting operations use cases. This approach ensures that your operation teams have all the tools they need to manage modern software deployments.
Transform your operations today with the new Problems app and stay ahead in the ever-evolving software and cloud infrastructure landscape.
Rapid response to critical incidents
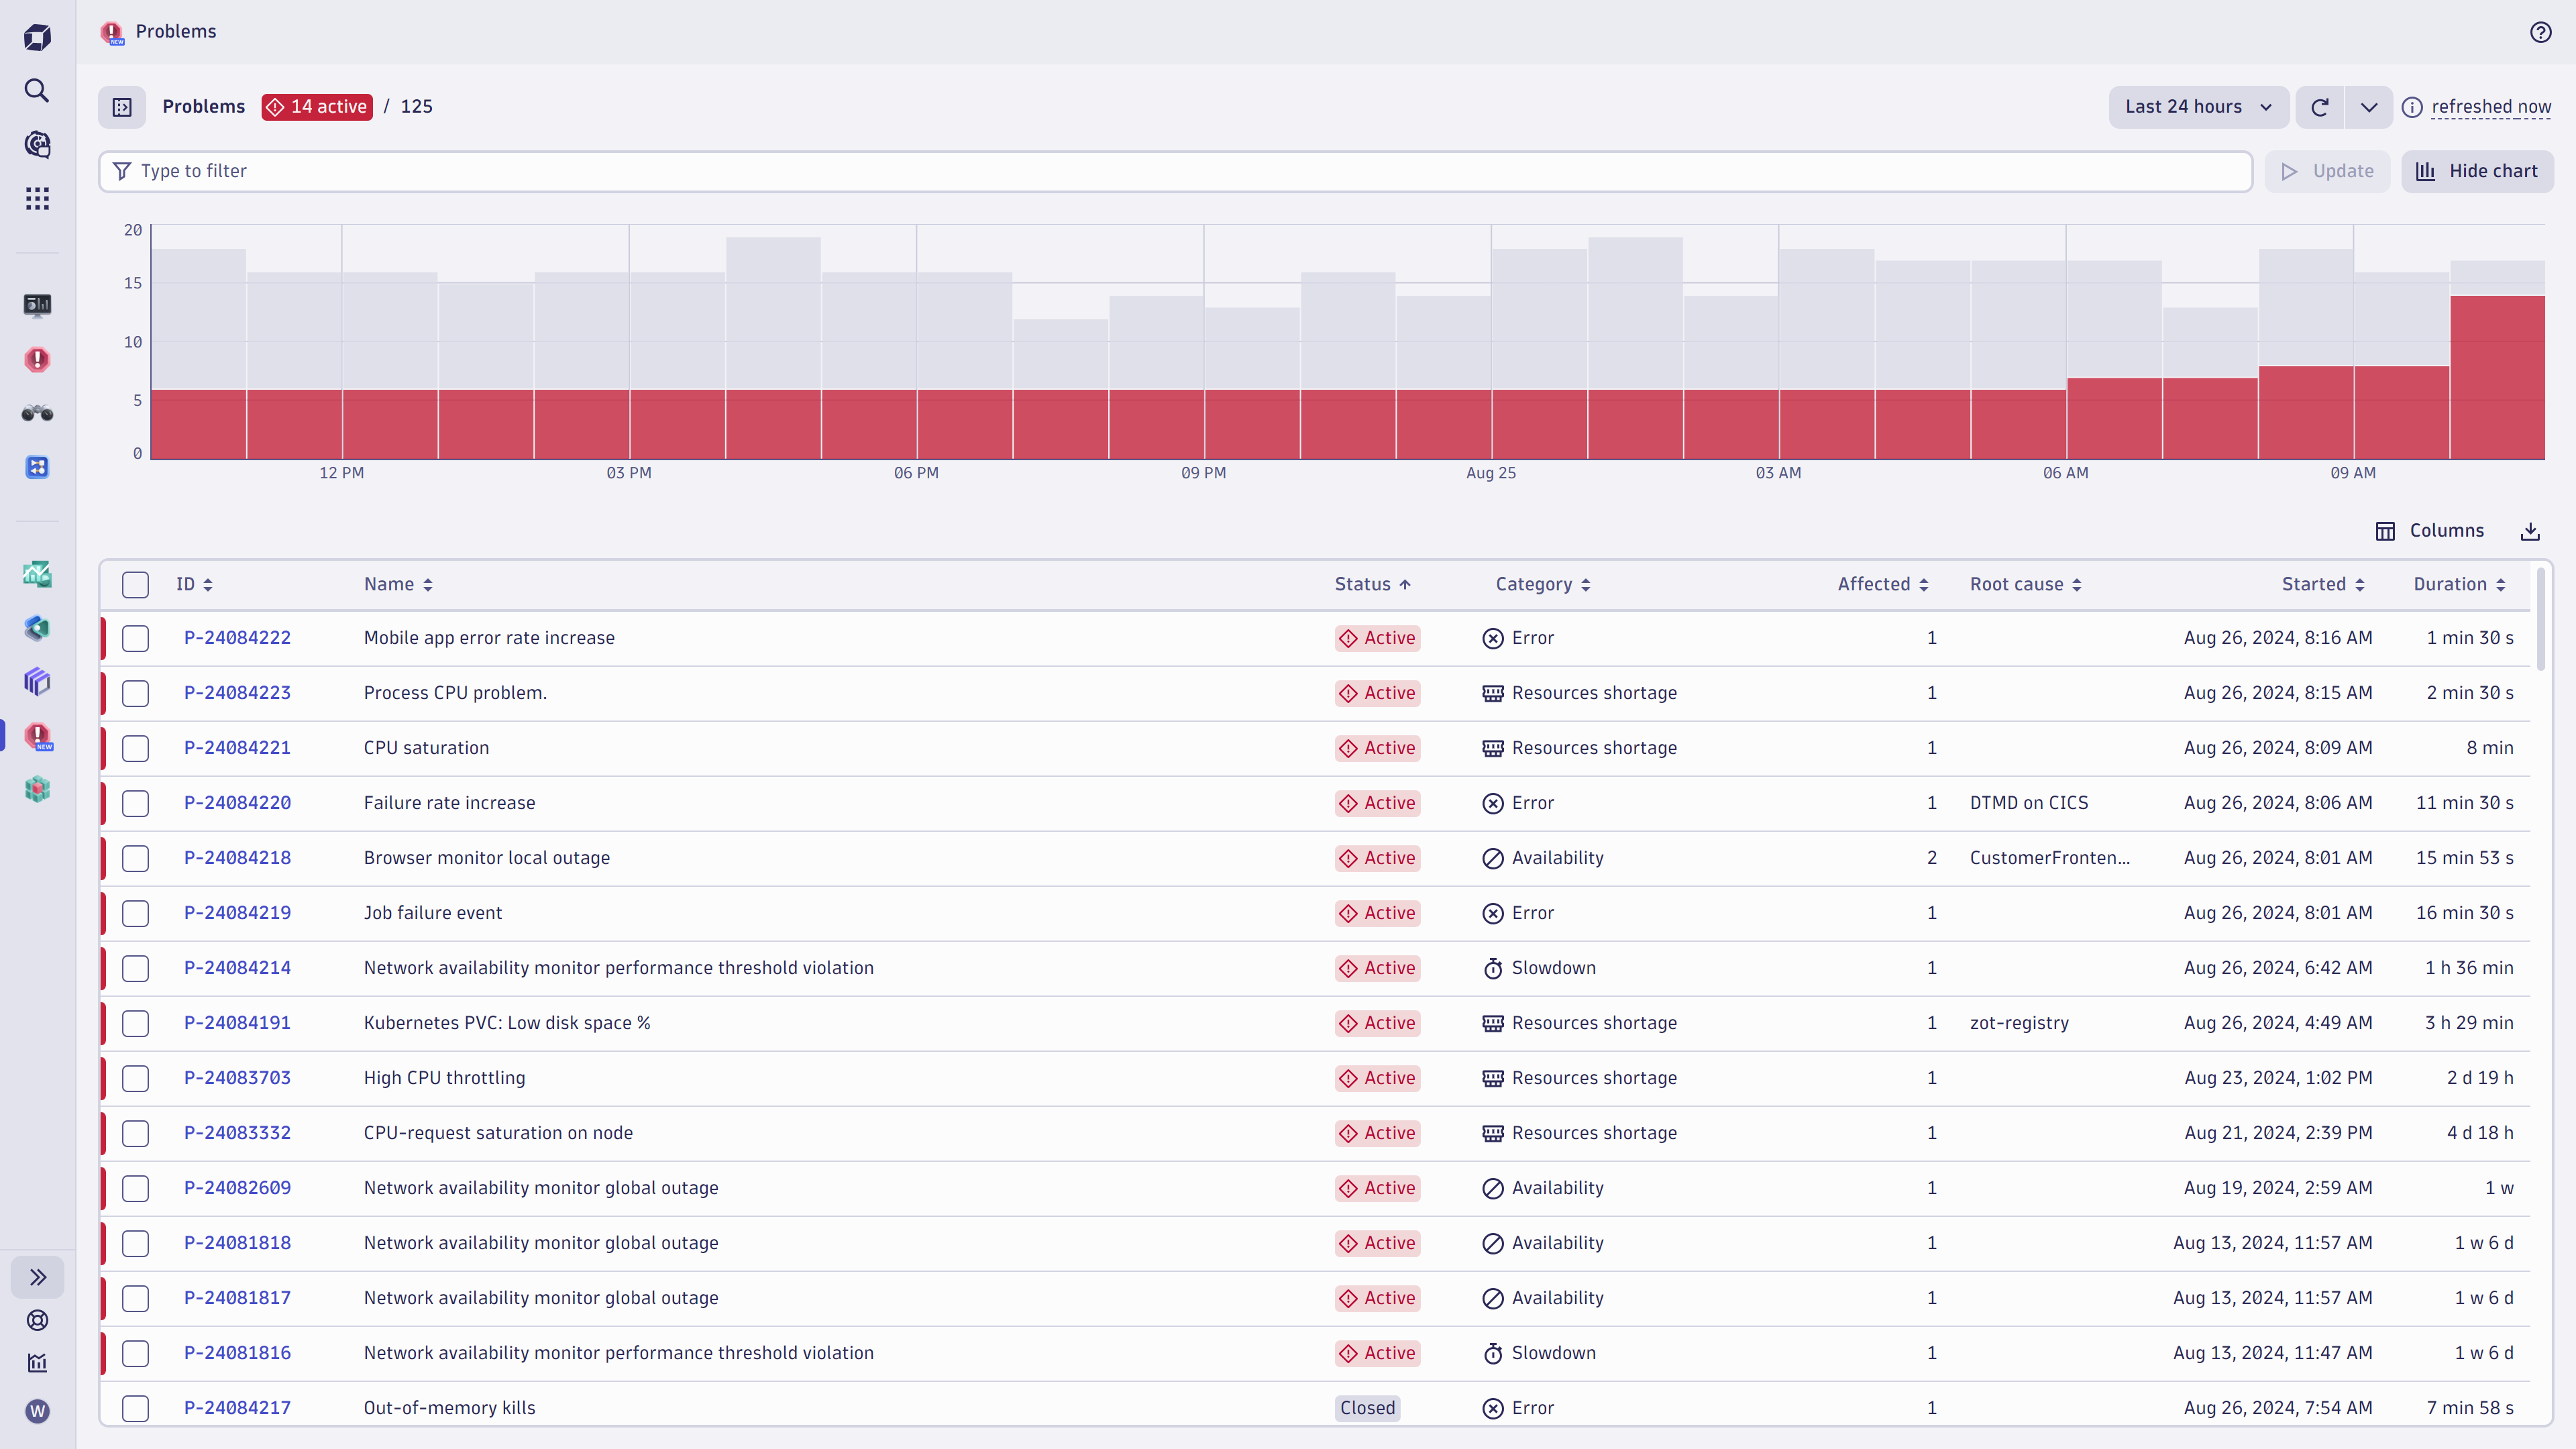
Operations teams can quickly focus on incoming Davis AI-detected and -analyzed problems by referring to the problems feed.
The problem feed is designed to prioritize active issues, ensuring they always appear at the top, regardless of how long they’ve been ongoing. This default sorting strategy, which uses time as a secondary criterion, guarantees that Operations teams never overlook an active problem, no matter which primary filter is applied.
You can focus on your domain using the filter bar at the top, the quick filters on the side, or both. The chart feature allows for quick analysis of problem peaks at specific times.
Operations teams will appreciate the ability to sort problems by duration and the number of affected entities. This aids in assessing Davis-detected root causes and prioritizing remediation efforts. The native multi-select feature lets users open a filtered group of problems simultaneously, facilitating quick comparisons and detailed analysis.
Streamline deployment insights with AI-generated summaries
Every second counts during wide-scale incidents affecting large parts of your production systems. This is why precisely showing the root cause ultimately helps to speed up problem resolution.
You can multi-select a cohort of active problems, select Show detail, and review all critical problem details, including preview charts and event details, without losing the context of your problem feed.
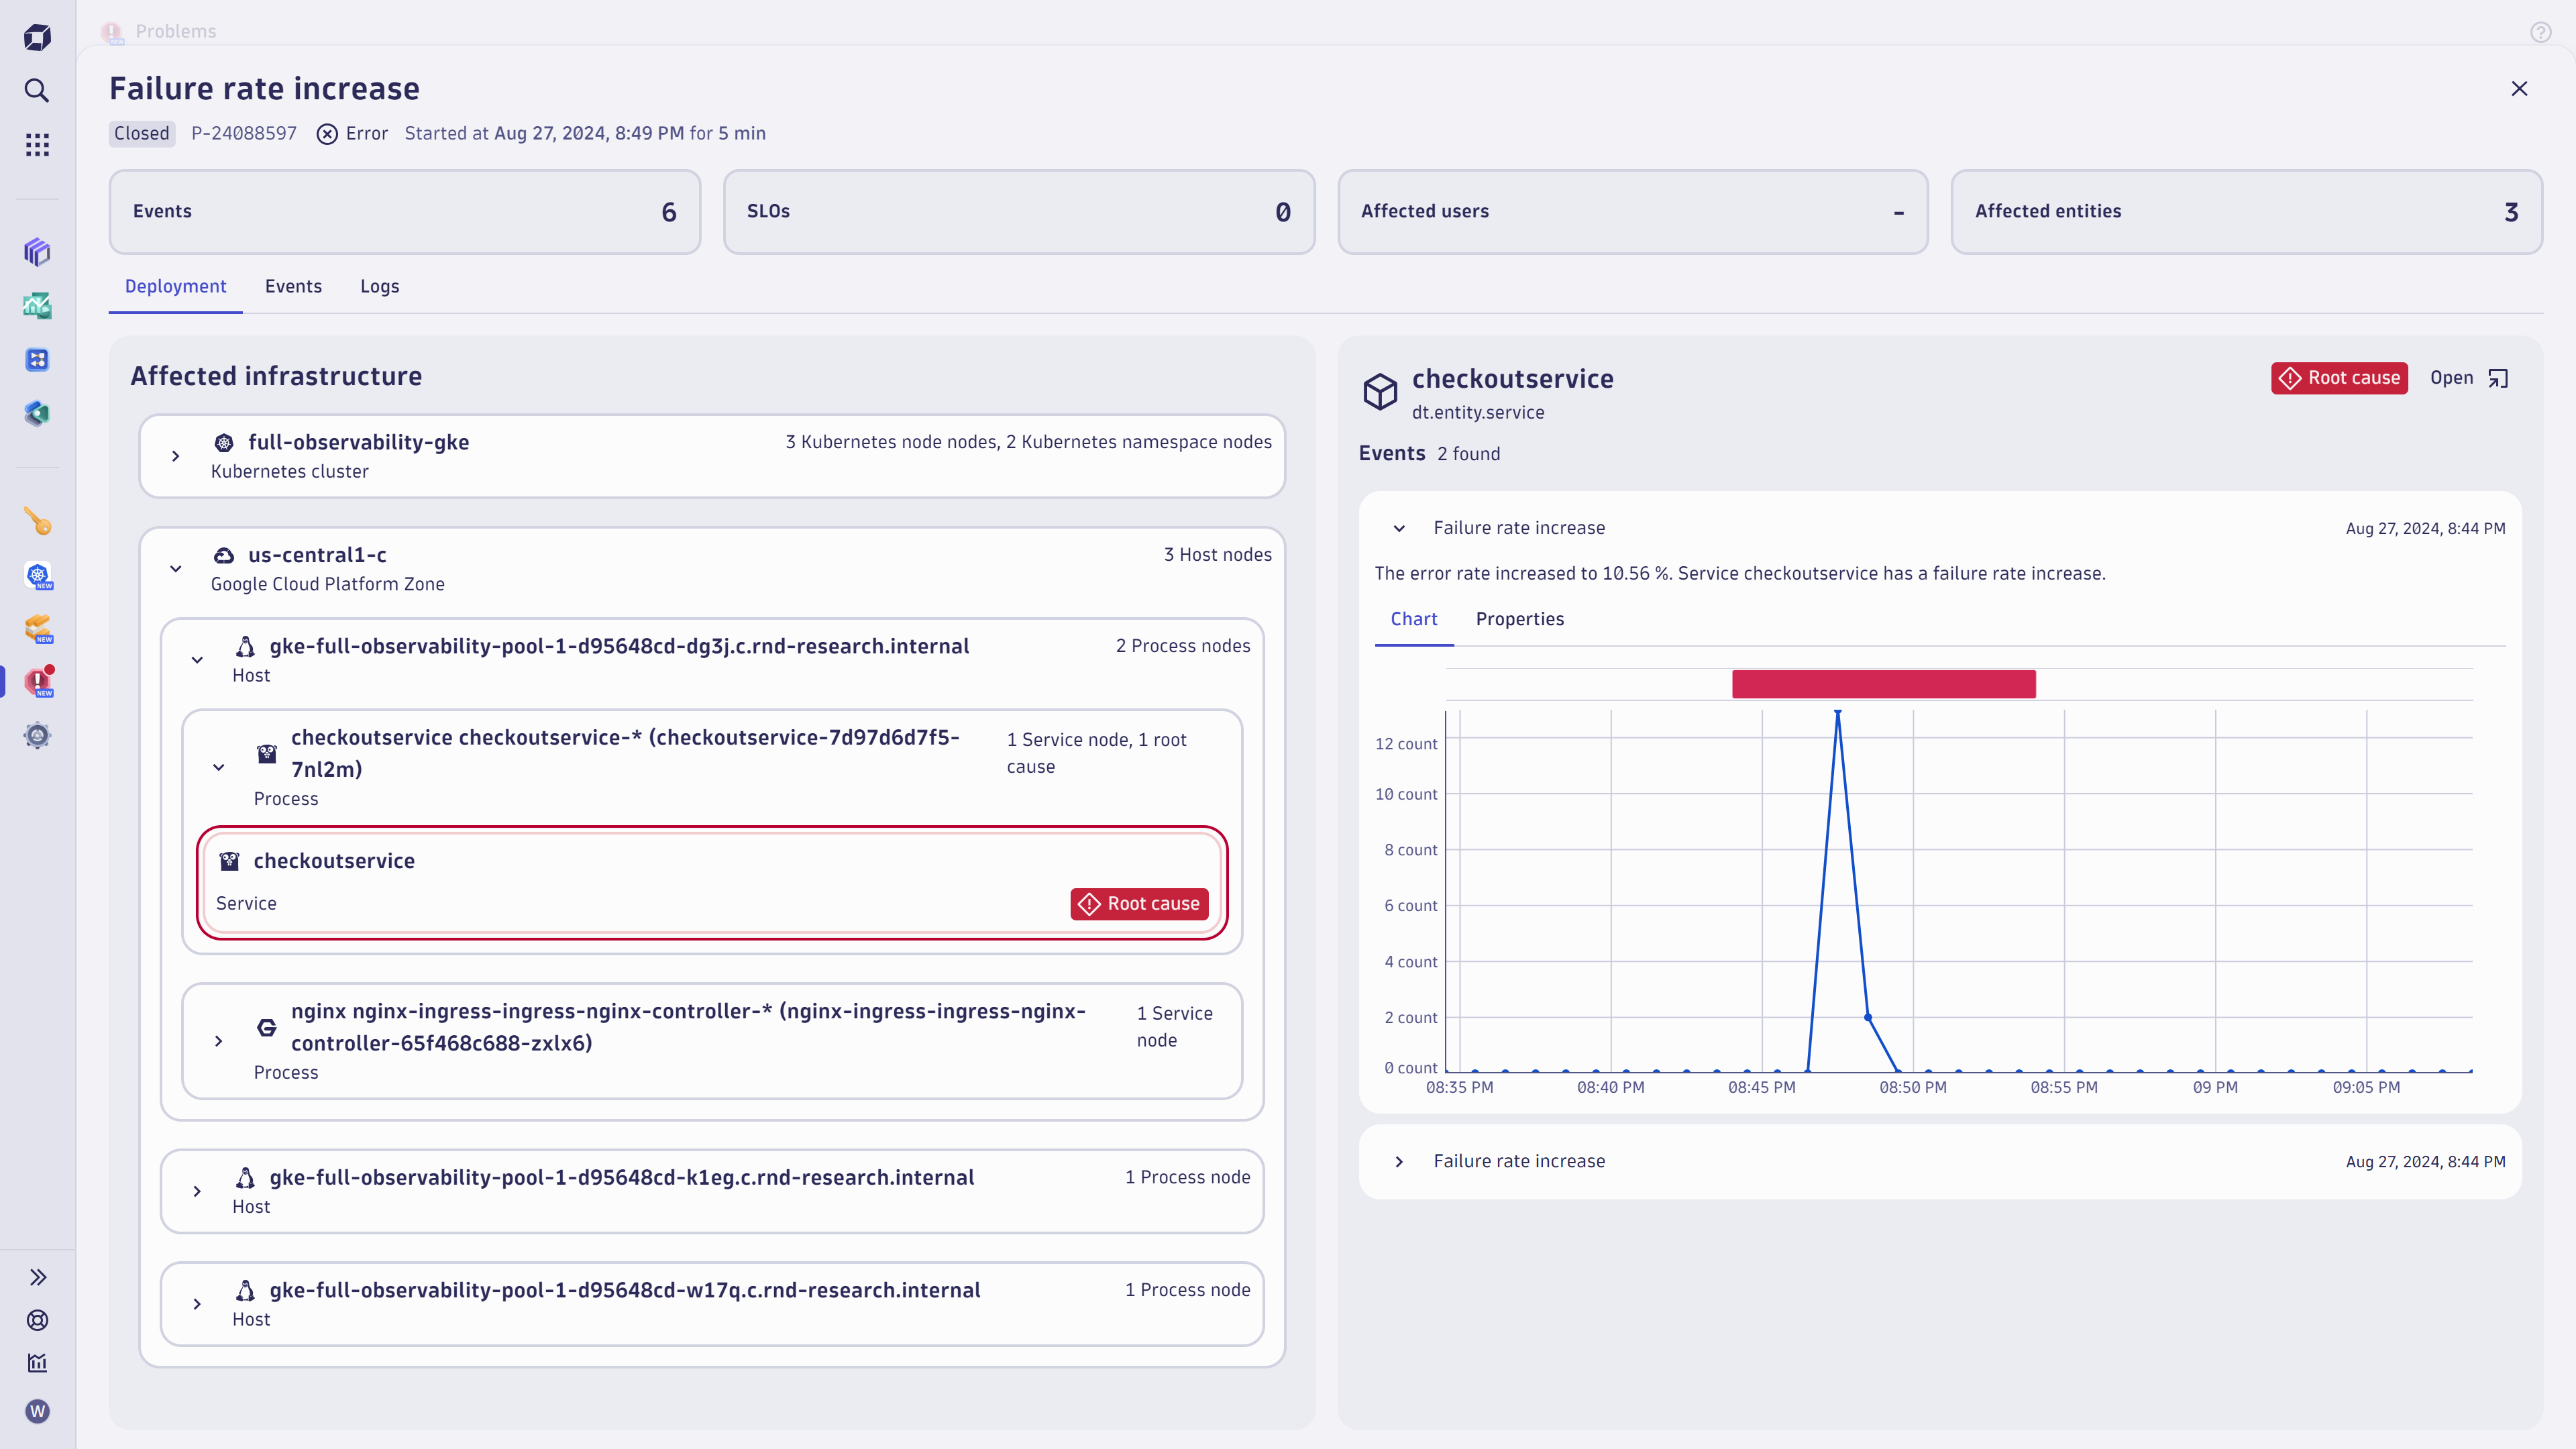
The new problem experience transparently displays all the available details, with prominently displayed root-cause markers to precisely guide your attention.
In the realm of cloud infrastructure management, having a clear and concise view of your deployment’s health is crucial. Our dedicated deployment perspective offers just that, showcasing the hierarchy of affected and related infrastructure components. The root cause of any issue is prominently marked with a root-cause badge, making it easy to identify and address problems swiftly.
This perspective not only highlights the affected cloud regions but also provides a quick summary of the Kubernetes context where your workloads encountered failures. Gone are the days of clicking and navigating through multiple dashboards. Instead, you receive an AI-generated summary as an affected deployment architecture diagram.
This diagram, akin to a UML (Unified Modeling Language) deployment diagram, offers a familiar representation for software architects, ensuring they can quickly grasp the situation and take necessary actions. By streamlining the visualization of deployment issues, we empower teams to resolve problems more efficiently and maintain optimal performance.
To save time, the root-cause component is preselected, and all the details of the root cause are displayed on the right, along with charts showing the detected breaches from learned normal behavior.
You can review each individual finding on all problem-affected entities by selecting the individual deployment components or by switching to the detailed event perspective, which shows all the single events that the root cause analysis collected into a single problem.

In addition to using markers for swift root cause analysis, operations teams often seek to attach valuable remediation hints and playbooks for familiar scenarios.
By implementing a flexible event tagging mechanism, event sources and detectors can be easily customized to include additional custom event properties. This allows for markdown-formatted event description text that can contain remediation links, as illustrated in the screenshot below.

The Dynatrace Semantic Dictionary helps identify the semantics of well-known event properties and provides convenient platform intents. For instance, entity links (dt.entity.*) or links to the responsible settings entry (dt.settings.object_id) that detected and opened an event can be included. These settings links save valuable time when adjusting detection sensitivity for thresholds or baselines. Additionally, the event setting property can be utilized in a DQL query to create a table of the top-triggering configurations or to automate settings changes using an automation workflow.
Quick access to incident logs
The seamless integration of logs powered by Dynatrace Grail™ data lakehouse with Davis AI root cause analysis is a game changer for modern operation teams, as it offers a quick summary of all incident-relevant logs.
The Dynatrace root cause engine already combines all incident-relevant information to recommend log queries, which saves a lot of navigation time and completely eliminates the need to manually identify complex log filters.
A single click on the Problem details log perspective immediately surfaces all relevant logs related to the given incident, as shown below.


Within this view the Operations team can further refine the query or adapt the filters and open a notebook to persist the log findings for critical post-mortem documentation purposes.
Root cause analysis in a user-focused context
Most modern application stacks are deployed through Kubernetes, making it essential for operations teams to focus on Kubernetes clusters, cloud resources, and workloads of critical services.
Since operations engineers prefer not to switch contexts, a consistent root-cause experience is provided regardless of where the user journey begins.
Whether you start your remediation journey within the Infrastructure & Operations app or the Kubernetes app, you receive the same root-cause information without needing to navigate between different apps. This seamless embedding of root-cause information into the current context saves valuable time during incident remediation.


Notify and automate to speed up remediation
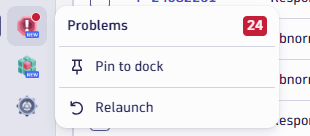
The Problems app features a global problem indicator that is always visible within the Dock to capture your attention. This indicator shows whether there are active problems within the environment. You can personalize this number by selecting and saving a problem filter within the problem feed, as demonstrated below. The saved default filter is then automatically applied to the global problem indicator, reducing the number of active problems for the user.
Select Alerting (bell icon) to set up alerts related to filtered problems and configure email addresses for notification recipients.
The email payload and the use of an email address for notifications are preset, allowing for a personalized notification setup, as shown below.


You can take a further step towards answer-driven automation and use the detected Davis problem event to trigger workflow automation. Automatically remediate an issue using our no-code workflow actions for collaboration (for example, Slack, Microsoft Teams, ServiceNow, Pagerduty) and remediation (for example, AWS, Red Hat Ansible, Kubernetes).
The introduction of a filterable global problem indicator ensures that Operations teams remain focused on active problems within the environment, even while exploring data in Notebooks or Dashboards.
In future updates, the Problems app will support multiple named filters and introduce Segments as the primary method for using and sharing numerous predefined filters among operations teams.
Outlook
The newly released Problems app enhances transparency by providing detailed AI-detected root-cause information. It also offers convenient deployment and architectural visualizations, along with a log perspective, to help operations teams reduce Mean Time to Repair (MTTR).
In future updates, we aim to support the ability to acknowledge and label incoming problems, improving team coordination. Additionally, plans include a visual representation of the application map, direct propagation of information such as application IDs into the problem feed, and support for segments to filter the problem feed.
Summary
For over a decade, Dynatrace has been at the forefront of integrating AI into incident analysis, particularly through Davis root cause analysis.
Davis is now essential for Operations, Site Reliability, and DevOps teams, helping them to navigate the complexities of modern software deployments and cloud infrastructure.
Without Davis, the productivity of these teams would plummet, leading to longer Mean Time to Repair (MTTR) and increased staffing needs to handle critical incidents.
In today’s automated deployments and cloud services, traditional observability tools fall short, unable to keep pace with the intelligence needed for effective root cause analysis.
Modern observability encompasses various data sources, from metrics to logs and events, requiring intelligent tools like Davis to seamlessly integrate and analyze this information in real time. By providing Davis on top of the flexible Grail data lakehouse, Dynatrace empowers teams to swiftly reduce MTTR by accessing and previewing incident data comprehensively.
The Davis Problems app streamlines triage, allowing teams to swiftly focus on AI-detected issues. Its intuitive interface simplifies problem resolution.


Looking for answers?
Start a new discussion or ask for help in our Q&A forum.
Go to forum