We recently announced an increase in the number of applications that can be monitored with Dynatrace Real User Monitoring within a single Dynatrace environment to 1,000 applications. Usually, the more applications that Dynatrace monitors the more frequently we hear questions like, “How much licensing volume does each individual application consume? We have internal applications, mobile apps, and public-facing web applications that have very different usage patterns.” For accounting purposes, organizations want the ability to assign the correct monitoring costs to each respective application team. For such information, you need an overview of which applications consume what amounts of your licensed quotas.
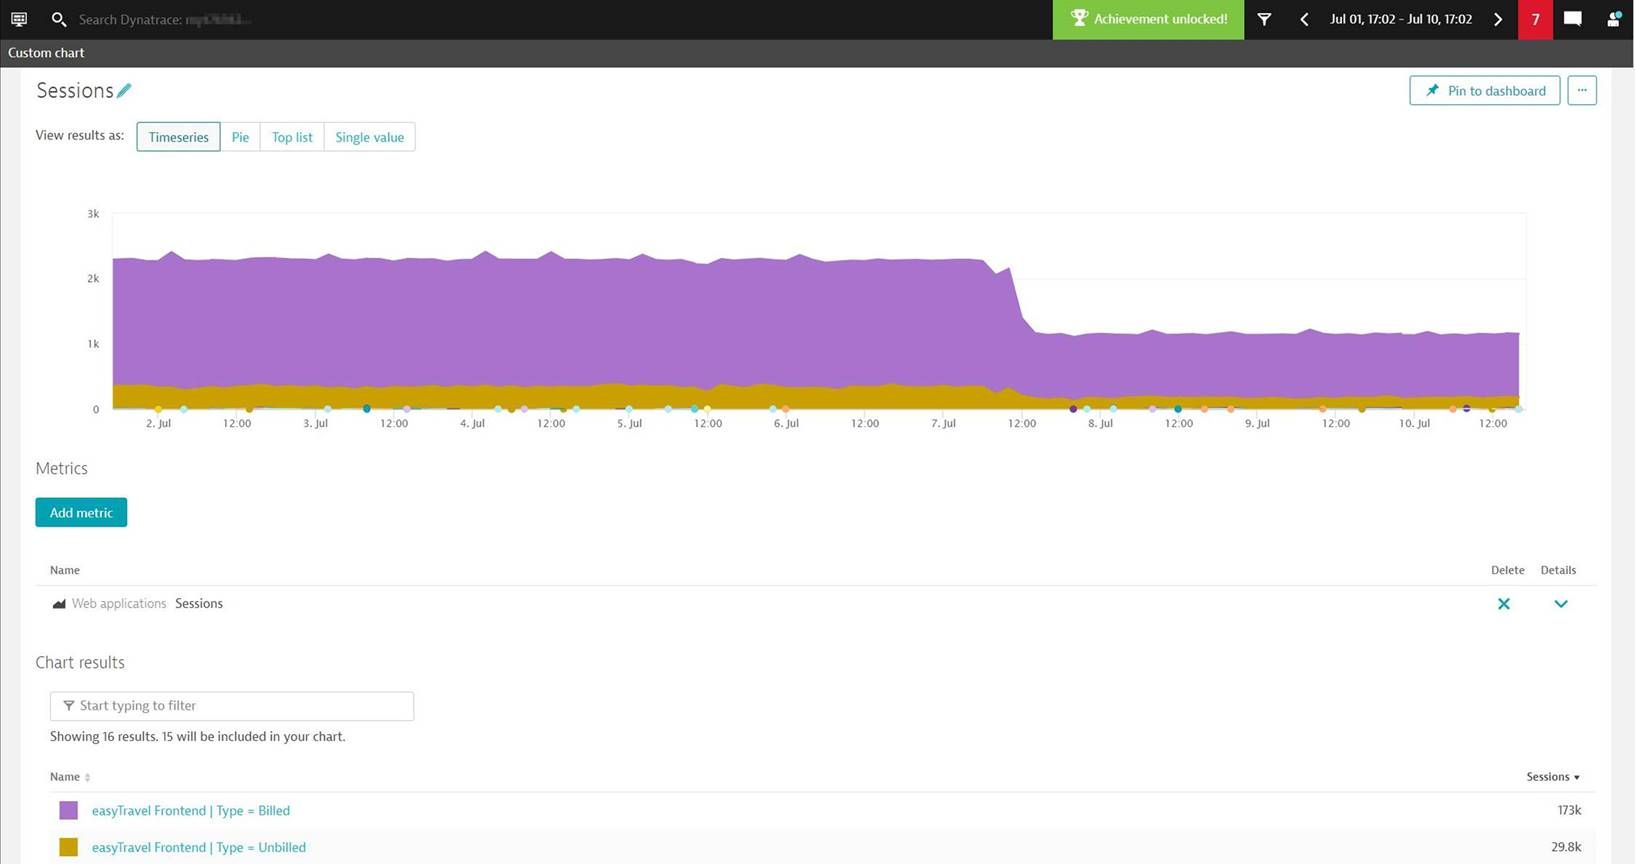
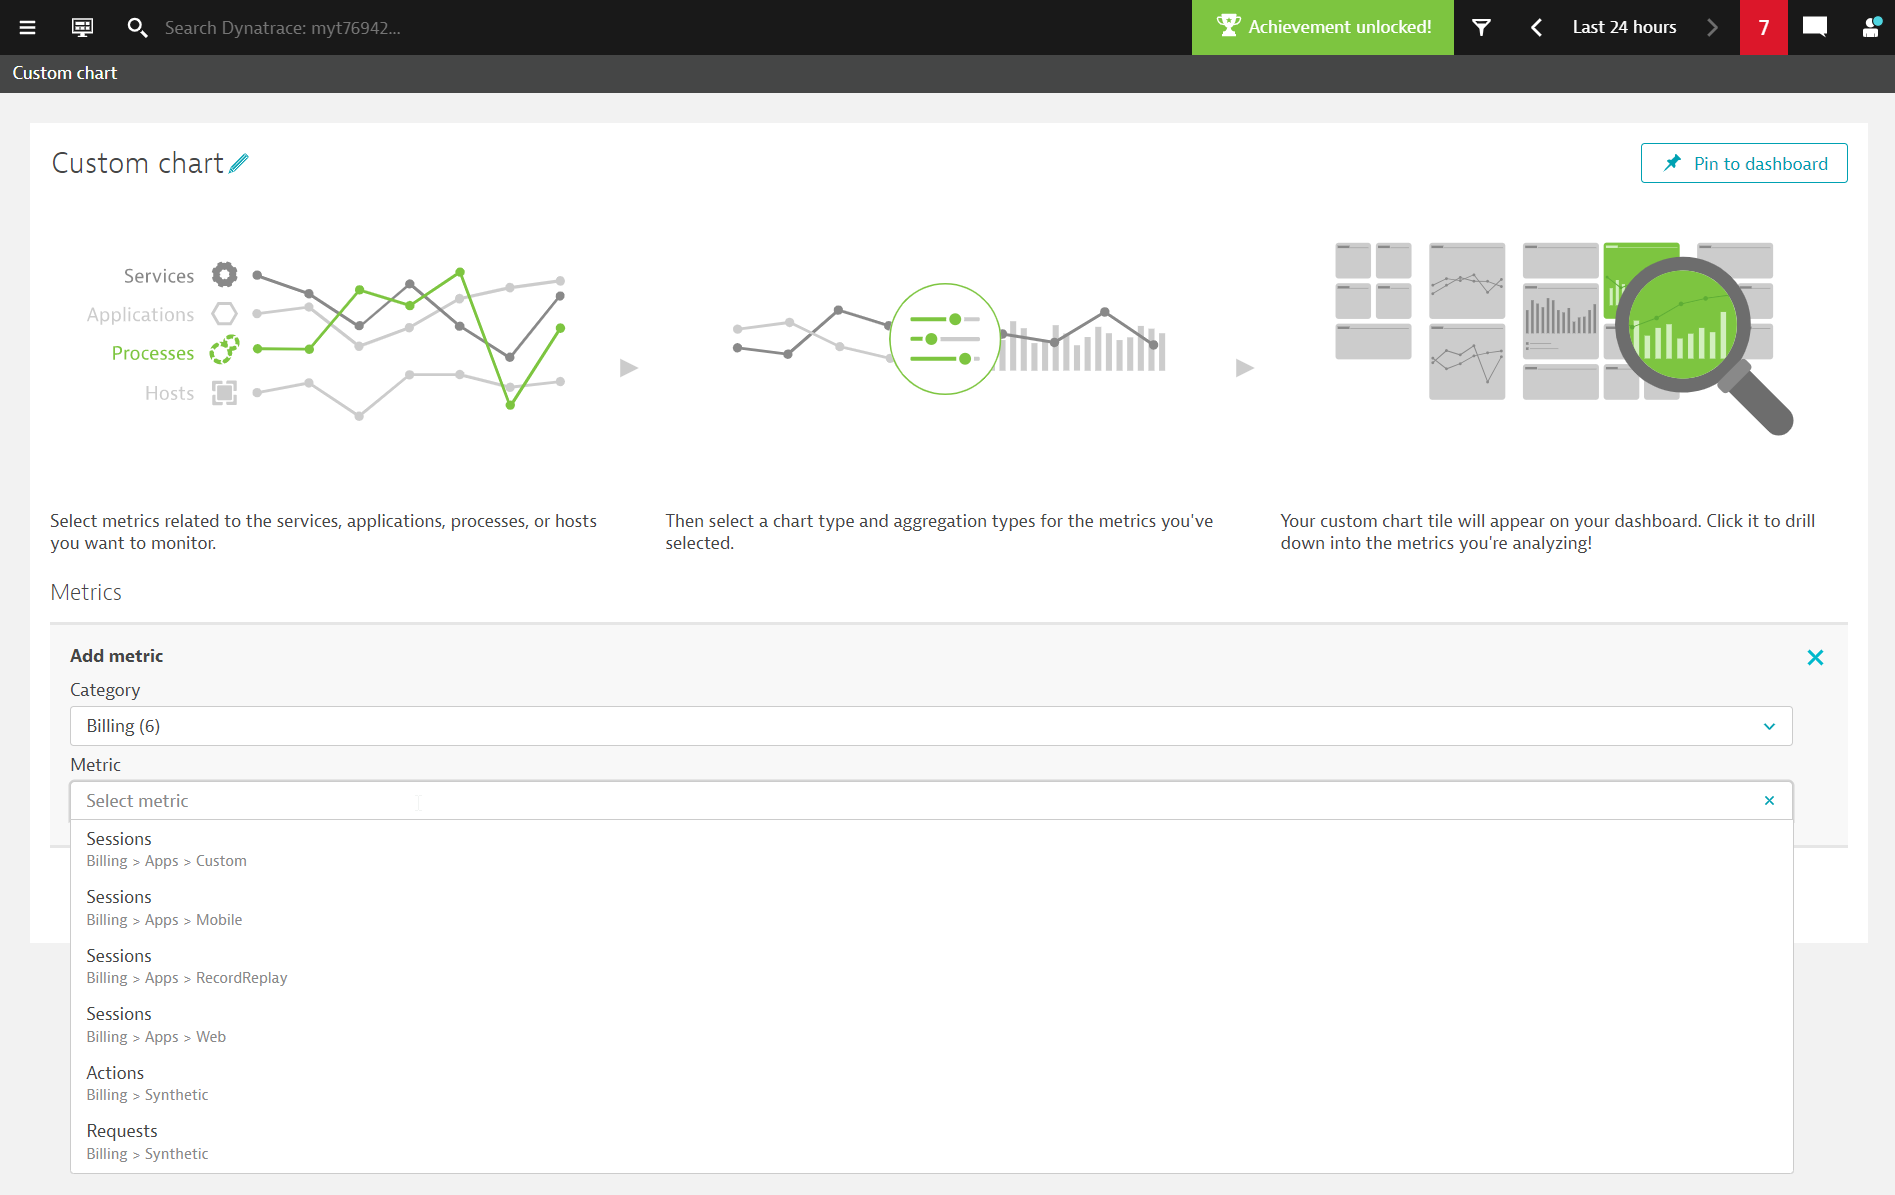
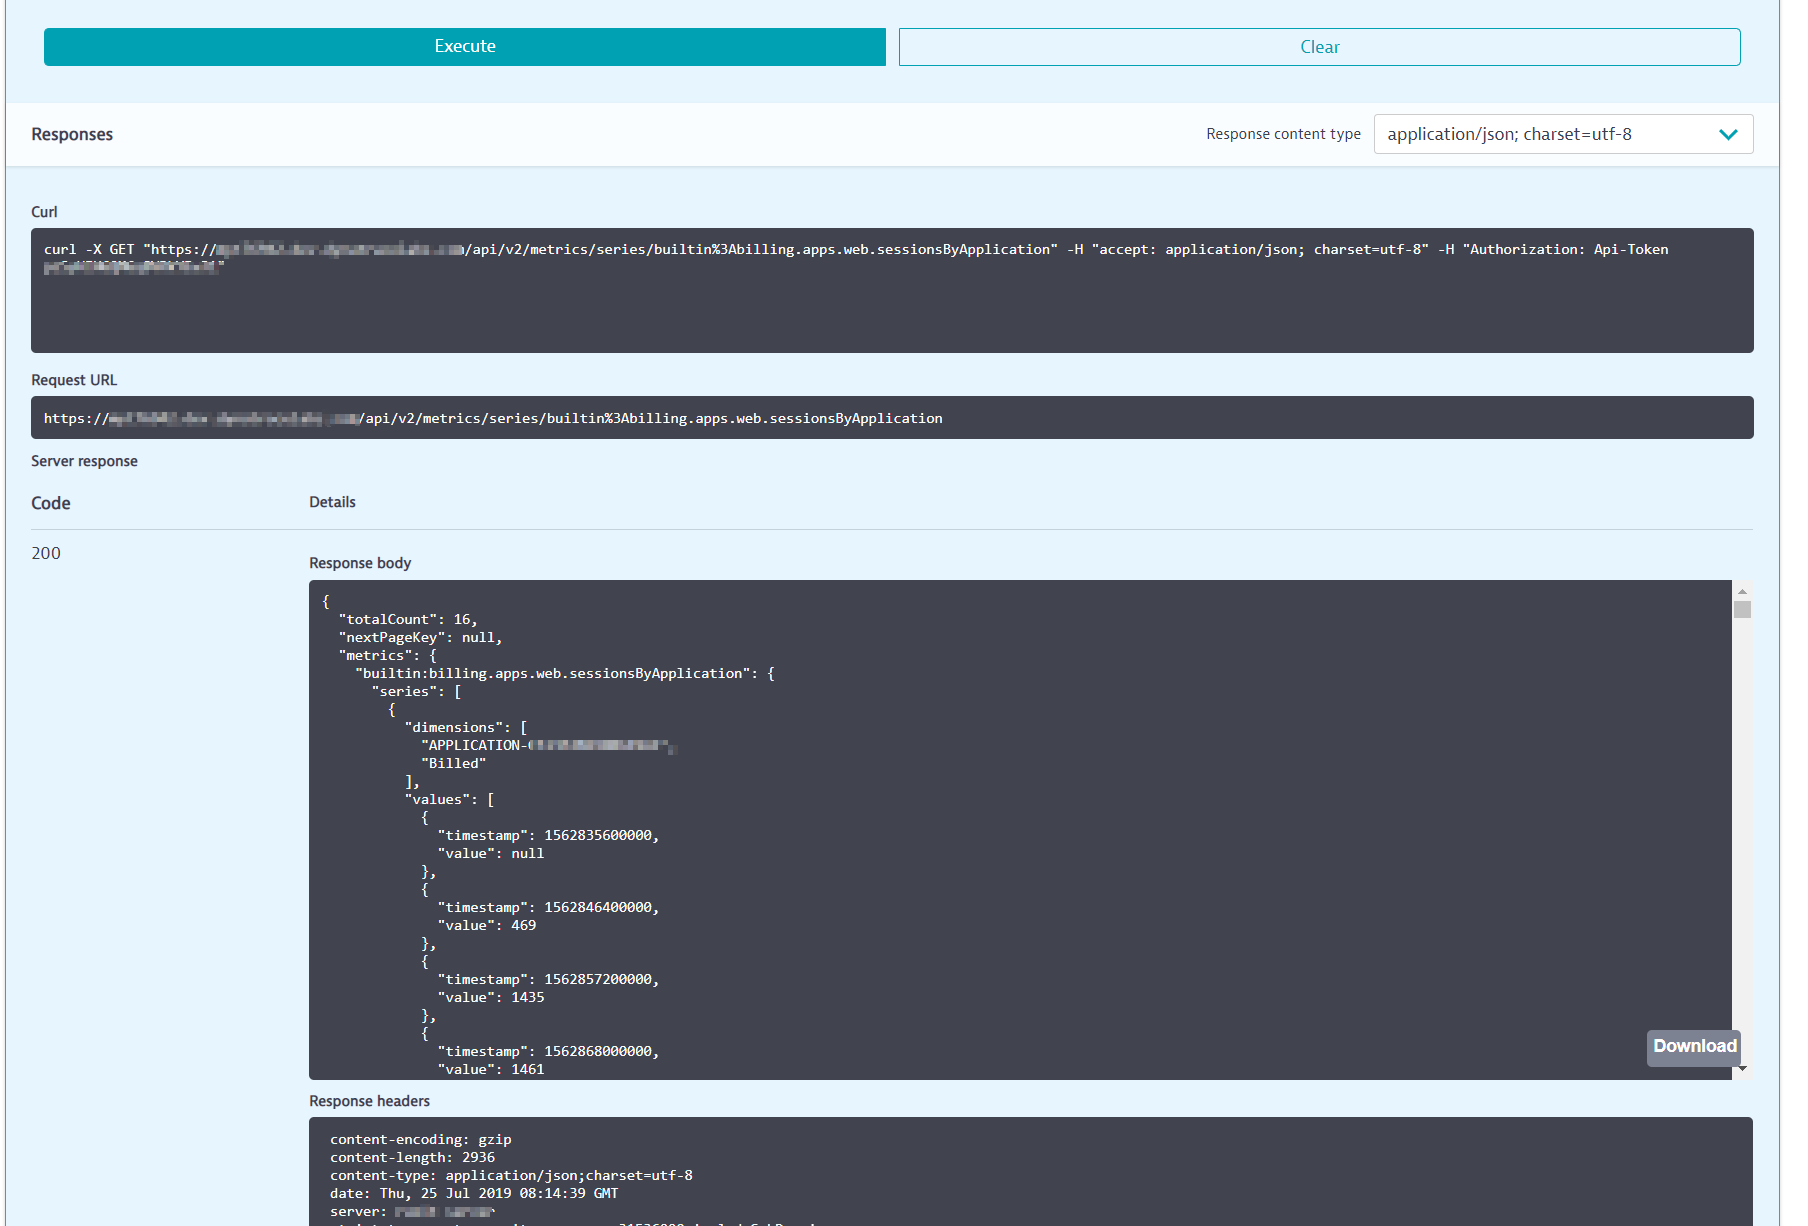
With version 1.174, Dynatrace now offers a new Billing timeseries metric for web, mobile, and custom applications. The Billing timeseries reflects the number of user sessions that are deducted from your license quota. For details, see Digital Experience Monitoring licensing consumption. This metric is available via the Dynatrace API and can be used for Dynatrace custom charting. See the example below.
The Billing metric reflects the number of monitored users sessions that are relevant for DEM licensing purposes. For those of you who leverage a DEM unit-based license, each regular Real User Monitoring session consumes 0.25 DEM units. Be aware that if you’re also leveraging Dynatrace Session Replay, each session that has Session Replay enabled consumes 1.0 DEM unit from your license quota.


Looking for answers?
Start a new discussion or ask for help in our Q&A forum.
Go to forum