When disaster strikes, it is important to react fast and get live updates on the recovery progress of the business and mission-critical systems. Dynatrace not only makes it easy to monitor all critical systems (hosts, processes, services, applications, users, network, cloud, custom devices, …) but thanks to the metadata the Dynatrace OneAgent captures for each entity, you can organize, filter, get alerted and get an overview of your system based on data that is relevant to the different stakeholders!
A customer from a large US-based insurance company, has reached out to me to share his latest success story on how Dynatrace helped him fulfill a request from their Senior VP of IT. This was the ask: “Can Dynatrace provide me with a dashboard that will show our Business Critical devices and have them in the correct order as if we were in Disaster Recovery?”
After some brainstorming, this customer and his team decided to build a dashboard following their VMWare DR-SRM Flow. Each virtual machine on their VMWare private cloud follows a specific naming scheme that reflects the DR-SRM Priority Level (1-21). With an auto-tagging rule, Dynatrace can convert this priority level into a tag. This allows this customer to create the below dashboard showing the health of each Priority Group (bottom left). On top of that they added additional information such as iSeries & current user activity:
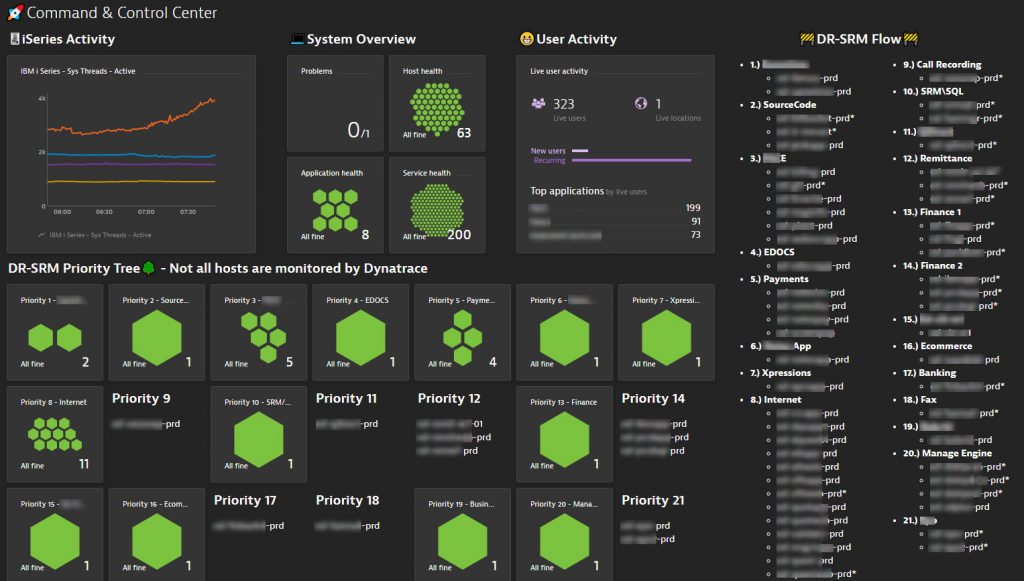
As Dynatrace dashboards can easily be shared with different groups, it enables everyone that needs to get a live update on system status to simply watch that dashboard. As this customer put it in his email to me: “This dashboard completely removes the need of management standing behind the DR team and asking about the status as they work on bringing up hosts and processes in their specific order!”
On the top right, this customer also added a Markdown tile to list those hosts that are currently not yet monitored with Dynatrace. This is a great way to show the progress of rolling out Dynatrace until it covers 100% of their environment!
Tips on Dynatrace Auto Tagging
If you haven’t explored the power of auto-tagging rules, I suggest you check out my 101 Tagging Performance Clinic I recorded with Mike Gibbons.
As mentioned above, this customer uses an auto-tagging rule that creates a tag with the name “DR-SRM Priority Level”. The rule filters on those VMWare Hosts that follow their special DR-SRM Naming scheme (see conditions). Additionally, he gives that tag the priority level number, e.g: 1, 2, 3 …
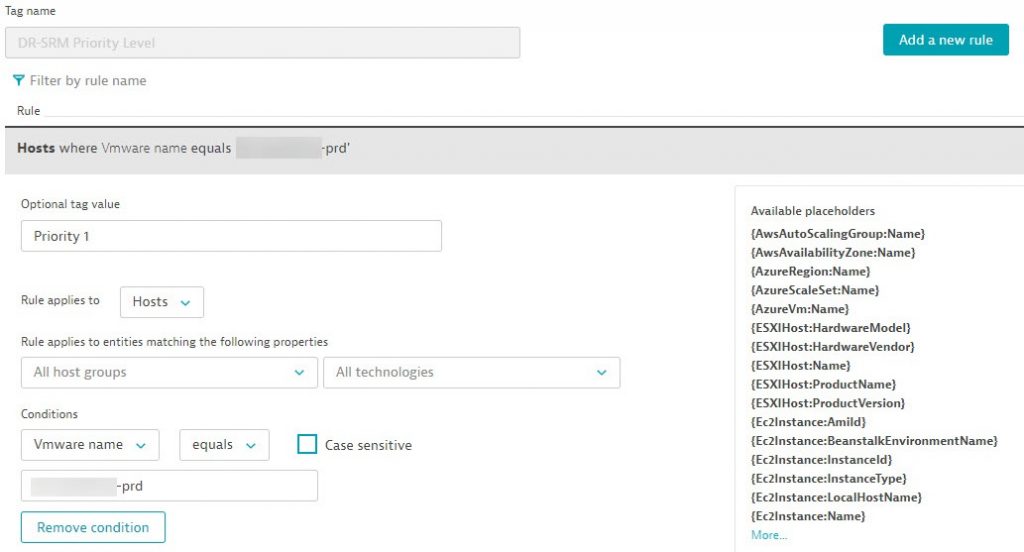
In his case, this customer was creating individual rules for each Priority Level. But here is my Pro-Tip to him.
I think these individual rules can be optimized into a single rule. Assuming this is a sample VMWare Hostname: HostABC-P1-PRD I can create a rule that extracts P1 and use it as the option tag value. I have to admit that I am not an expert in RegEx – so – maybe there is a better and more efficient way – but – here is how I would create that rule:
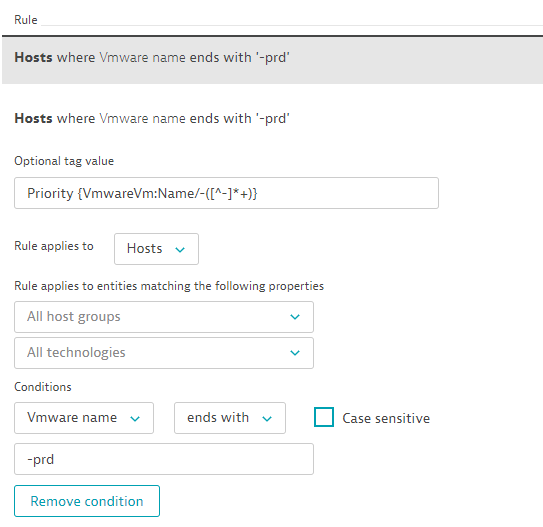
My rule above will be applied to all hosts that end with the name -prd. That condition is necessary so that Dynatrace is not evaluating this across all your hosts, but just those where you want this tag to be placed. The optional tag value then starts with “Priority” but will additionally extract the text between the two – (dashes). There are some great blog posts from Michael Kopp on using RegEx’s for Dynatrace Tagging and Naming. There is also a good doc page that explains How to use RegEx in Dynatrace.
Now – once the rule is set the tags will show up on the hosts. Here is a screenshot this customer shared with me showing the tag on one of the VMware hosts:
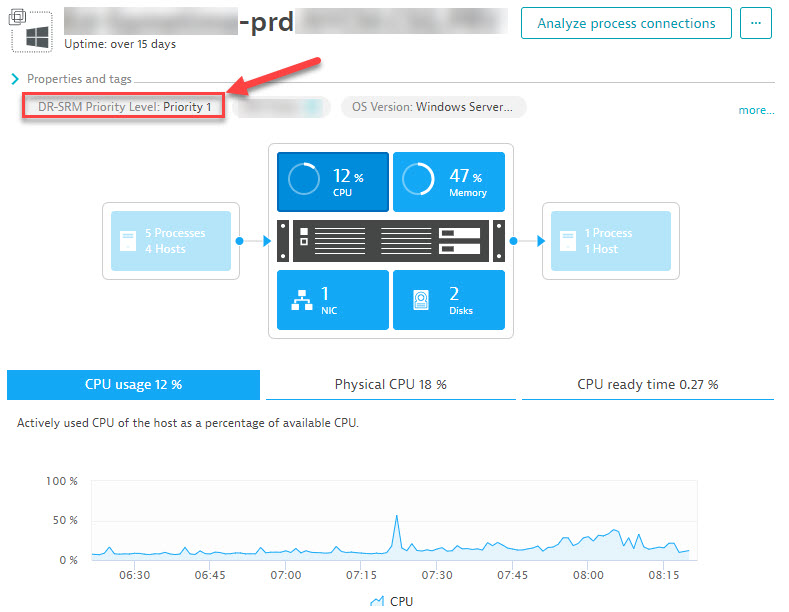
And because tags can be used for filtering, alerting rules or management zones we can immediately start using them. Here is another screenshot that this customer sent over showing how to use these tags to filter his host list!

Try it yourself – and start sharing!
If you have your own special use cases and success stories with Dynatrace, let me know. I am more than happy to write them down as a blog and share it with the larger community!
If you haven’t used Dynatrace, just get your own Dynatrace SaaS Trial. If you happen to be a partner or customer, remember that we recently announced the Dynatrace Developer program that you can use to explore Dynatrace and build extensions. Last but not least – check out the rest of my YouTube Performance Clinics to learn more about how to use Dynatrace for different use cases.



Looking for answers?
Start a new discussion or ask for help in our Q&A forum.
Go to forum