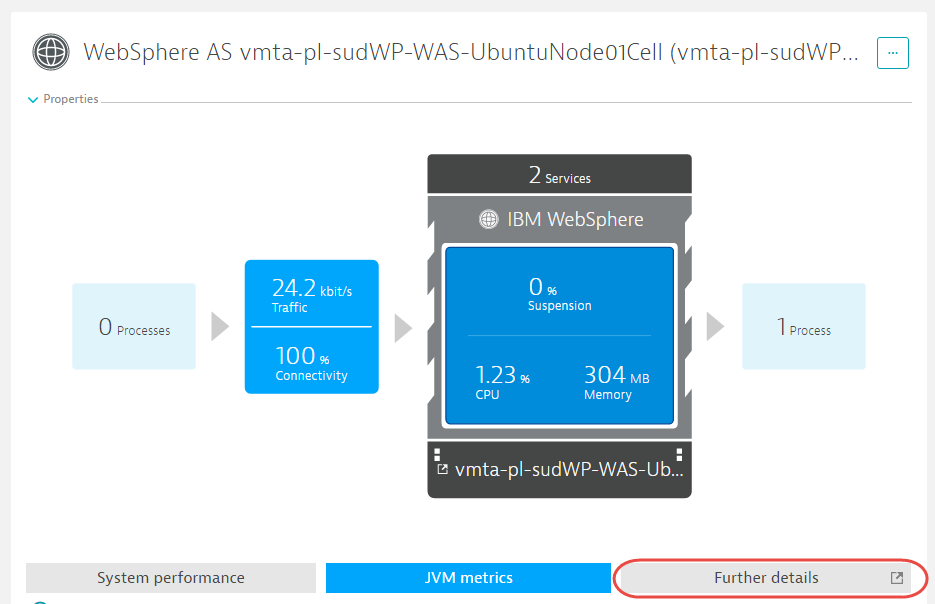
Dynatrace now supports IBM WebSphere Application Server PMI metrics. You’ll find PMI metrics in the Further Details section of each WebSphere Processes details page.

As of OneAgent 1.95, Dynatrace automatically monitors session and request metrics for all deployed applications running on IBM WebSphere.

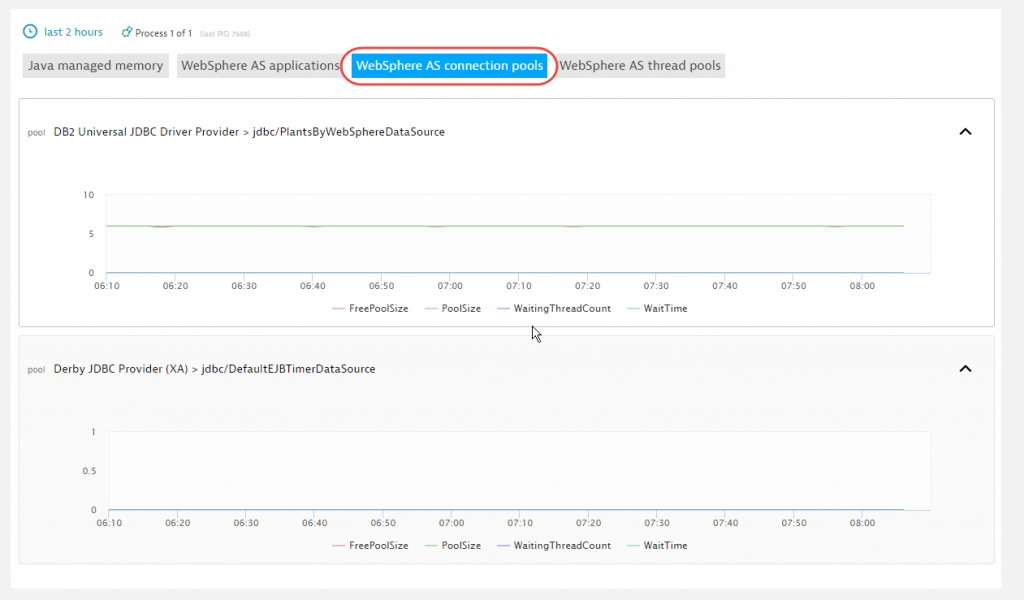
Dynatrace also lists and monitors all available JDBC connection pools on your WebSphere Application Servers.

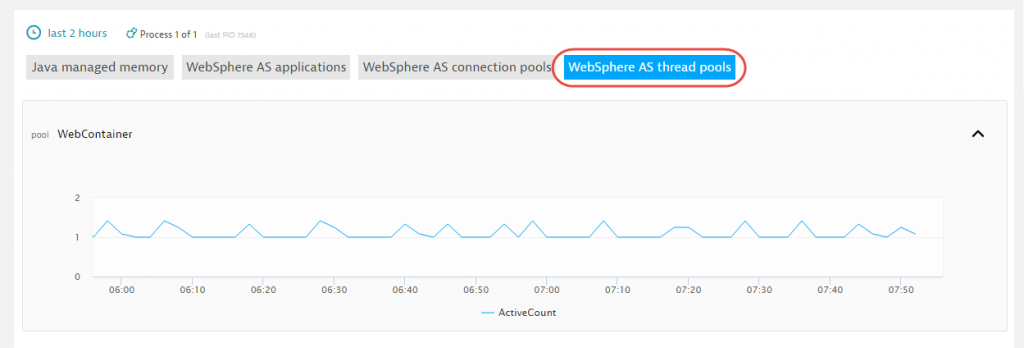
Last but not least, Dynatrace also monitors all WebSphere Application Server thread pools.

Custom PMI plugins
Dynatrace also enables you to install custom PMI plugins that retrieve additional metrics provided by WebSphere. For assistance in setting up a PMI plugin to extend your WebSphere monitoring, please contact the Dynatrace Customer Success team.


Looking for answers?
Start a new discussion or ask for help in our Q&A forum.
Go to forum