Dynatrace is proud to partner with AWS to support AWS Lambda functions powered by x86-based processors and Graviton2 Arm-based processors announced earlier this year.
In this post, we’ll review what this option means to you and how you continue to get the same automatic and intelligent end-to-end observability of AWS Lambda functions whether you choose x86 or Graviton2.
How does Graviton2 compare to x86?
Graviton2 processors are 64-bit Arm-based and custom built by AWS to offer a better price-to-performance ratio for a variety of workloads, application servers, microservices, video encoding, high-performance computing, electronic design automation, compression, gaming, open-source databases, in-memory caches, and CPU-based machine learning inference. According to the official AWS announcement, Graviton2-based Lambda functions offer up to 34% better price-performance improvement.
With Lambda, you are charged based on the number of requests for your functions and their duration (the time it takes for your code to execute) with millisecond granularity. With Graviton2, you can reduce execution duration. Workloads using multi-threading and multi-processing, or performing many I/O operations, can experience lower execution time and, consequently, even lower costs based on execution time and configured memory size.
In addition to lower execution duration for Graviton2-based Lambda functions, customers also benefit from Graviton2 built-in security features, better I/O performance, and faster multi-threaded function execution.
Monitor your Graviton2-powered Lambda functions out of the box
Dynatrace’s Lambda extension fully supports Arm-based architectures. This means once you’ve instrumented your functions with the appropriate library, Dynatrace can collect telemetry from your Lambda functions running on Graviton2.
When you add the Dynatrace extension to your Lambda functions, Dynatrace begins ingesting their metrics, logs, and traces, which you can monitor and correlate with data from the rest of your stack. In addition, Dynatrace visualizes each Lambda function interactive map of how everything is interconnected using our patented Smartscape technology. Smartscape provides 100% end-to-end observability into all application components and dependencies up, down, and across all tiers of your stack – no gaps or blind spots.
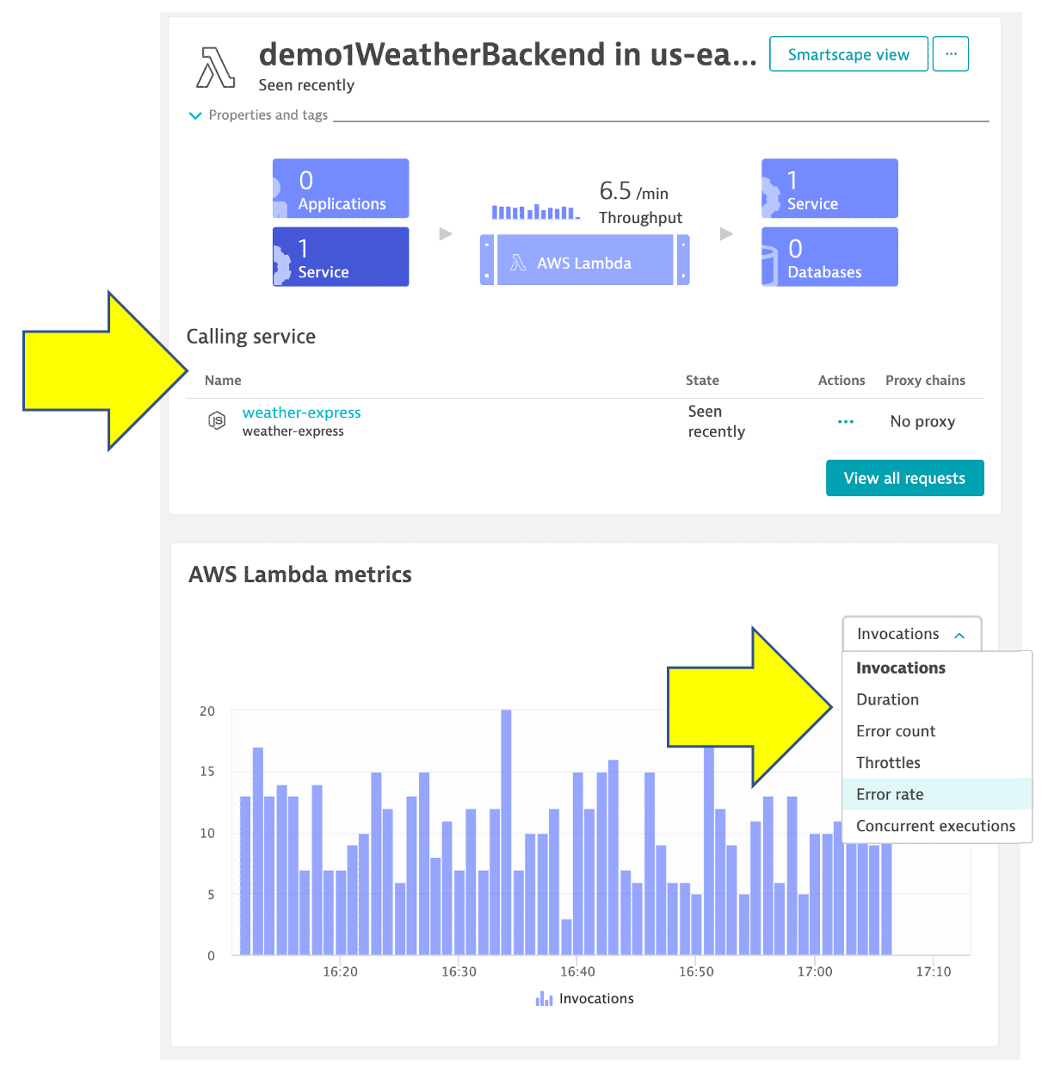
Each monitored AWS Lambda function appears in an intuitive service view infographic as a dedicated service, shown below, so you can easily understand its dependencies to other services, usage, and performance insights.

In addition to the built-in views, Dynatrace provides data analysis tools that greatly enhance your abilities to query and chart metrics. For example, the Dynatrace Data explorer enables you to:
- Analyze multidimensional metrics, whether built into Dynatrace or ingested from StatsD, Prometheus, Telegraf, and other channels like AWS CloudWatch.
- Choose from any of five visualizations: graph, pie, single value, table, or top list.
- Add your visualization right to your dashboards for easy access and sharing.
- Provide a foundation for metric calculation in charts on dashboards.
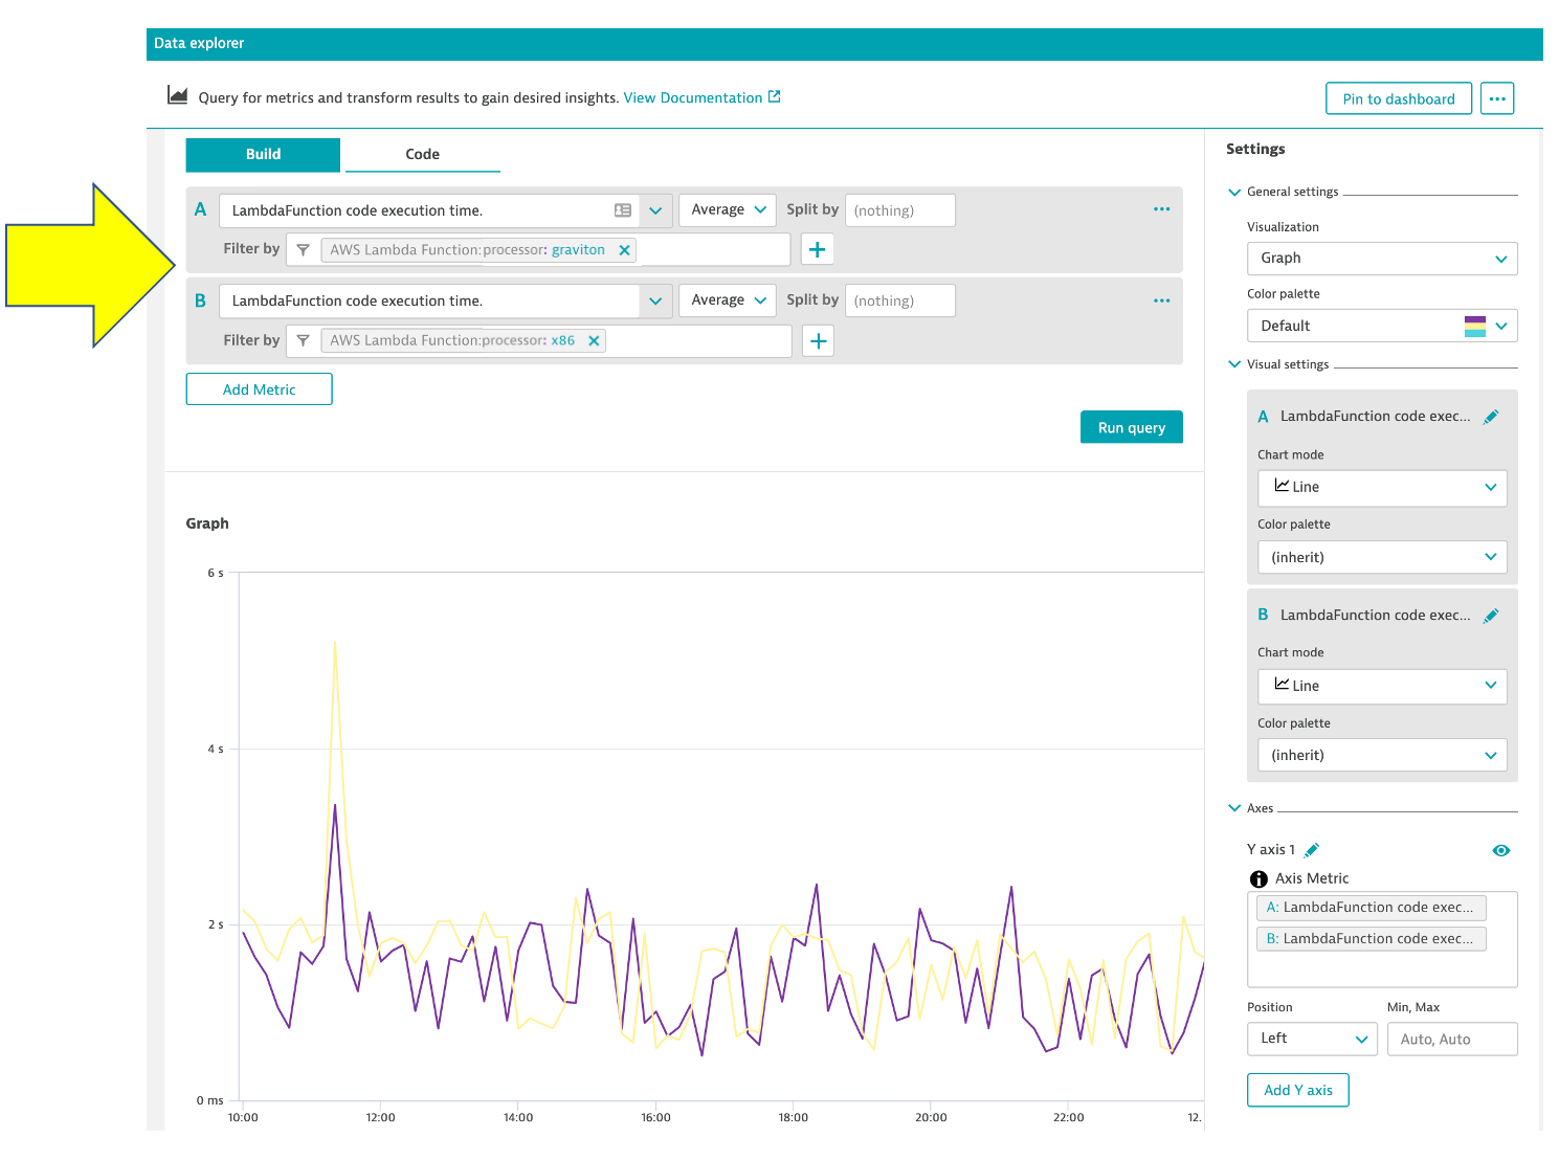
You can easily analyze metrics, such as execution duration of Graviton2 and x86 instances, using the Dynatrace Data explorer. For example, you can apply filters on different tag values by using a combination of AWS tags to identity Graviton2 versus x86 Lambda functions as shown below.

End-to-end visibility
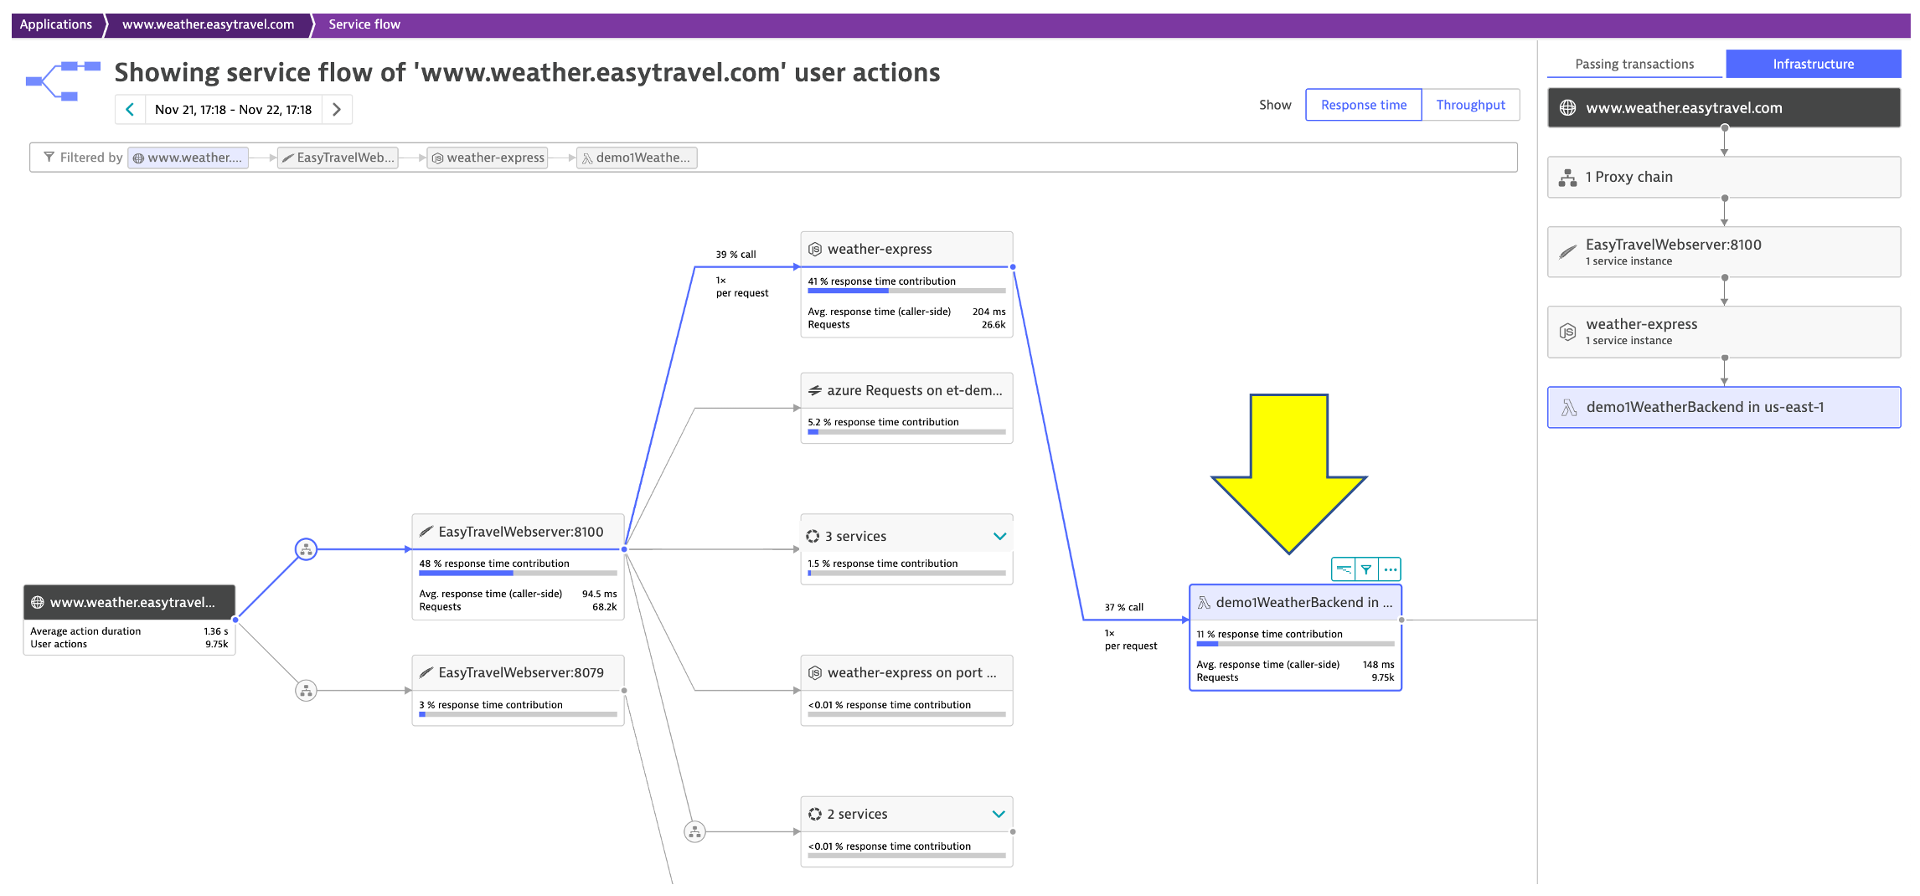
Shown below is the Dynatrace Service flow page, which shows the sequence of service calls are triggered by each service request in your environment across all technologies, including AWS Lambda. These end-to-end traces, powered by PurePath, enable you to automatically monitor dynamic serverless functions in context to the overall application and landscape.

Precise AI-powered answers provided by Dynatrace Davis
The dynamic nature of serverless makes it difficult to identify and resolves issues in a timely manner.
Analyzing data for fast troubleshooting can be very complex due to the large amounts of data and variety of data sources. Rather than processing simple time-series data, Dynatrace Davis®, our AI causation engine, uses high-fidelity metrics, traces, logs and real user data that are mapped to a unified entity model. This gives operations teams specific answers to help prioritize and the root cause with end-to-end visibility down to the code level to resolve the problem.
Below is an example Dynatrace problem card, described in detail in this AWS Distro for OpenTelemetry blog, which shows:
- 973 impacted users using the prize-registration application
- Root cause determined from an increase in HTTP 500 client-side error rate
- A dynamic visualization the services involved in the transactions that contributed to this error.

Start monitoring AWS Lambda functions today
You can use Dynatrace to monitor all your AWS Lambda functions, whether they are running on x86 or Arm architecture. This makes it easy to visualize performance and determine the right underlying processor for your workloads.
You’ll find all the information you need to get started on the AWS Lambda deployment page in your Dynatrace environment.
- Select Deploy Dynatrace from the Dynatrace navigation menu.
- Enter AWS Lambda into the search bar at the top of the page.
- Select the AWS Lambda tile and then select Activate AWS Lambda at the bottom of the page.
You have options for configuring the extension. You can either set it up using environment variables in a config file, or you can include pre-defined code snippets in your serverless framework, Terraform, CloudFormation, or AWS SAM setup.
See our documentation for more details on getting started or sign up for a free 15-day trial.
For more information on AWS Lambda and Dynatrace click here. Learn more about how Dynatrace and AWS are “better together” here.


Looking for answers?
Start a new discussion or ask for help in our Q&A forum.
Go to forum