Dynatrace introduced numerous powerful features to its Infrastructure & Operations app, addressing the emerging requirement for enhanced end-to-end infrastructure observability. The newly introduced Network devices and Details view within Hosts provide comprehensive health status information, relevant networking signals, and machine metrics—all analyzed and provided by the industry-leading combination of Dynatrace Grail™ data lakehouse and Davis® AI.
These enhancements are designed to empower IT operations and SRE teams with more comprehensive visibility and increased efficiency at any time.
Let’s explore these exciting new features and see how they elevate infrastructure management.

Figure 1. Infrastructure & Operations app showing manual root cause and impact analysis
Advanced filter components for powerful enterprise-grade search and visualization
One of the standout enhancements of the latest update is the improved filter components, designed to facilitate more complex and advanced searches across cloud, on-premises, or hybrid infrastructure hosting environments, including support for custom tags.
Whether you’re looking to zero in on specific hosts, operating system and application processes, or devices, the improved filters enable high-precision searches without sacrificing the operational performance of the Infrastructure & Operations app.
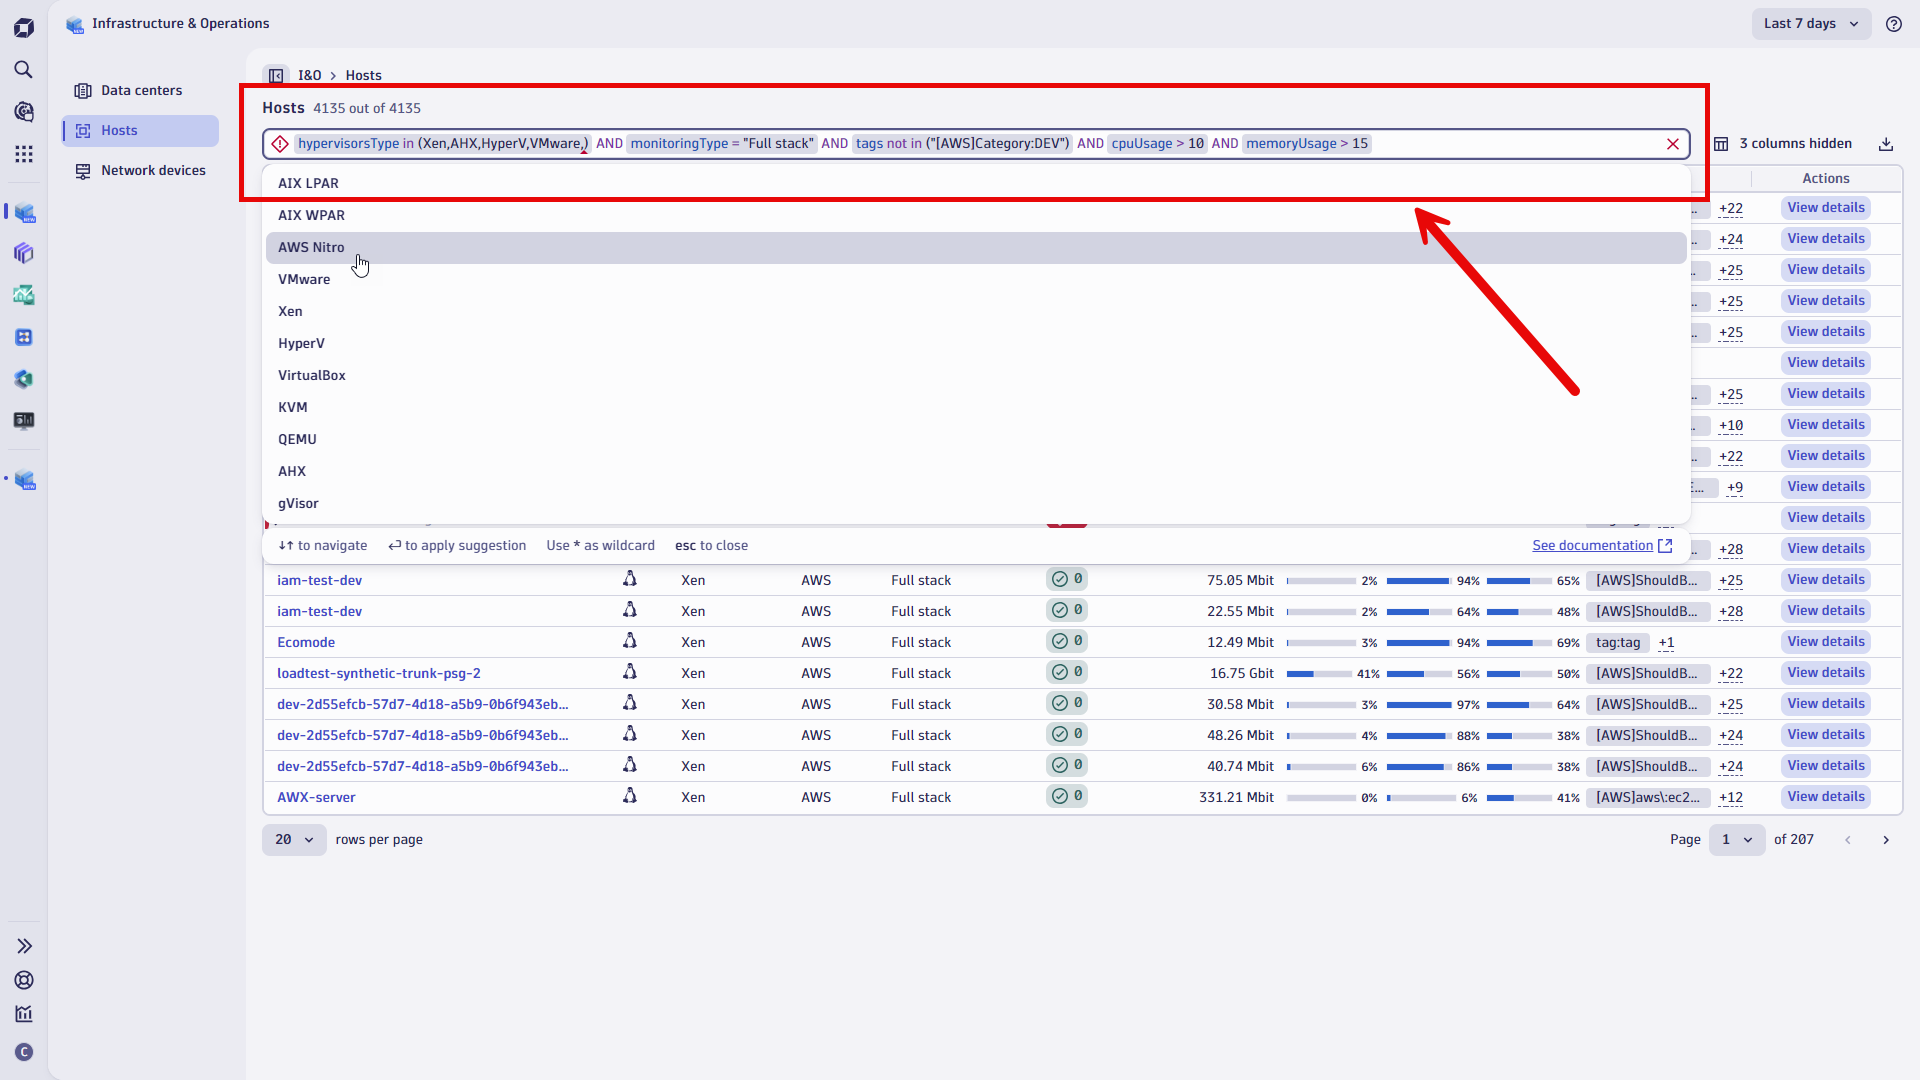
Specifically, background filter queries and visualizations have been optimized to ensure fast response times for complex and large enterprise datasets. A critical update that further enhances this experience is the increase in visual limits—now, up to 100,000 host elements can be displayed within the resulting filtered view.
You can interactively sort, filter, and reorder these host elements with no query delay. This means quicker access to insights, allowing IT teams to act faster during timely and critical incidents.
Whether you’re looking to swiftly review performance trends across thousands of cloud-native resources or your goal is to investigate a single component within your environment, Infrastructure & Operations provides the details you’re looking for. Speaking of single elements and resources brings us to the next enhancement:
Host detail view: Get the complete picture and deep dive into host health
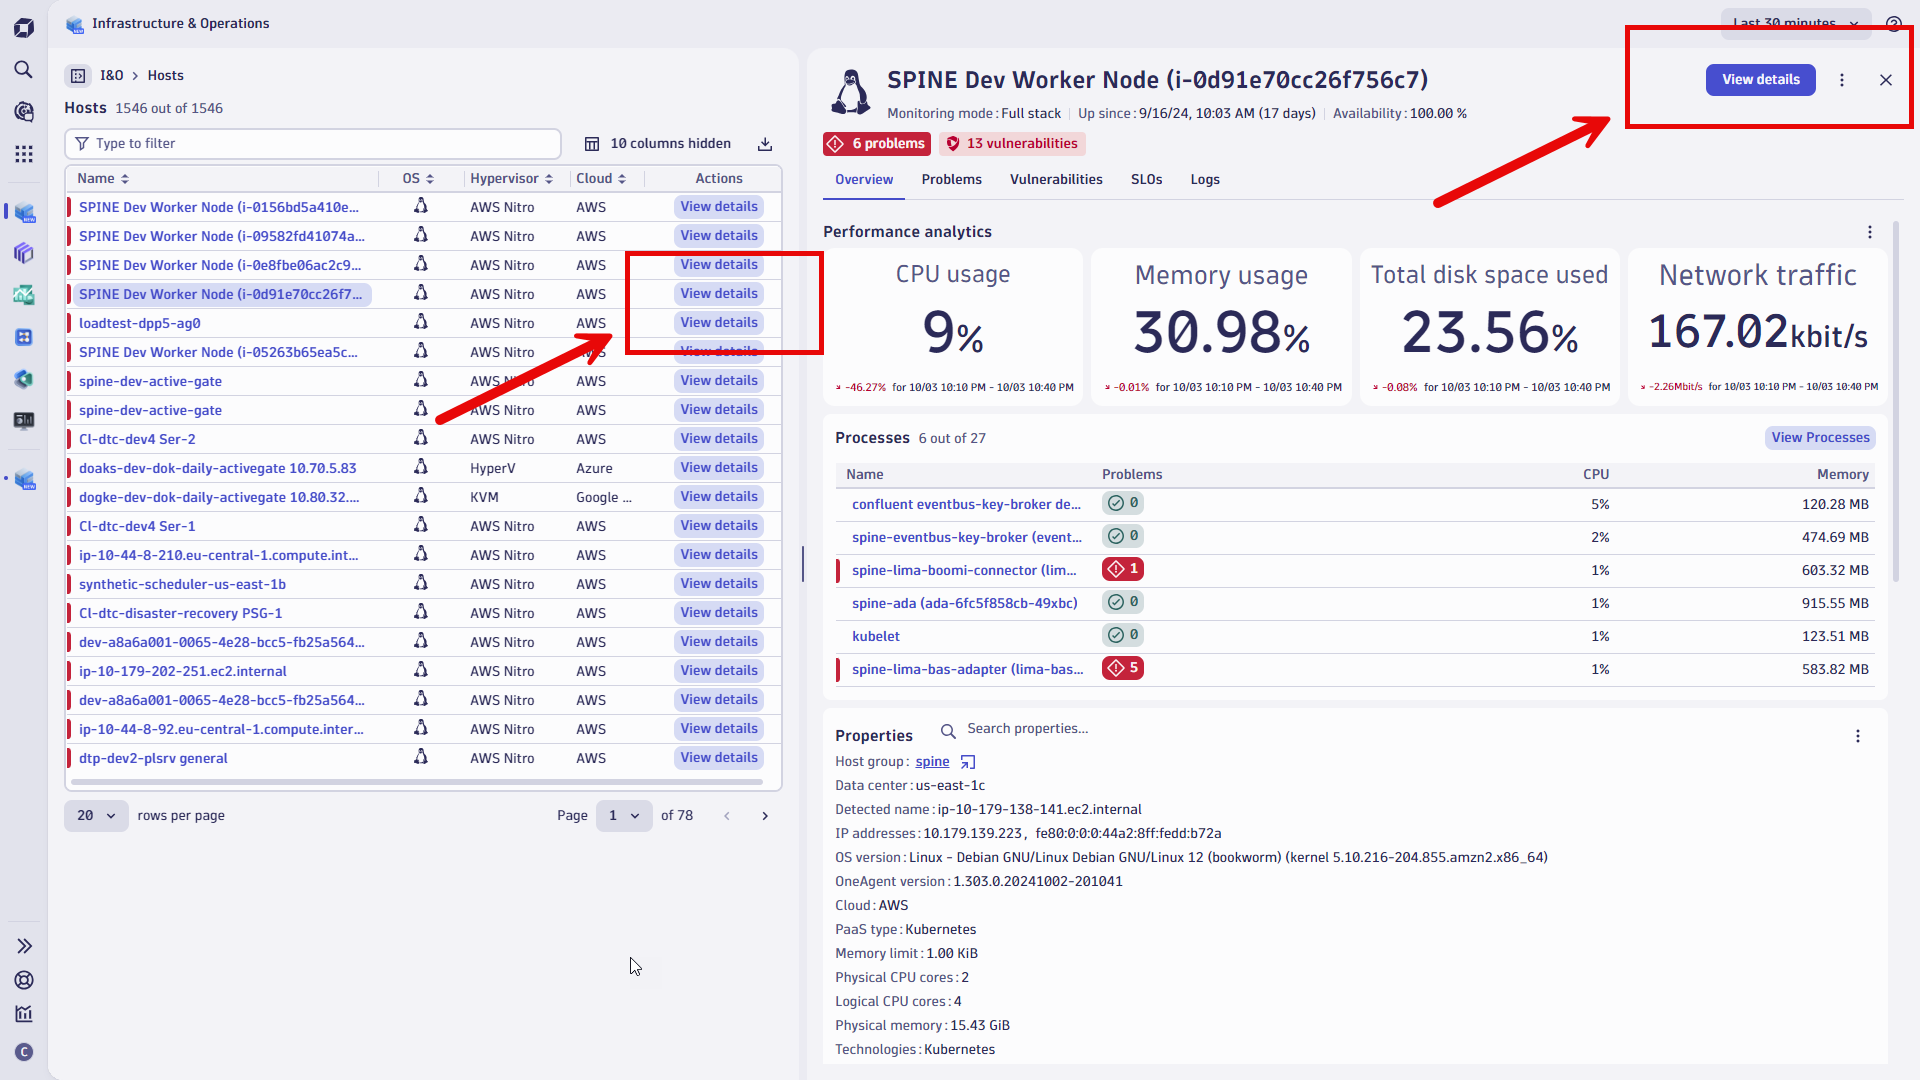
The recently introduced host detail view has elevated manual health reviews and in-depth analysis to the next level. You can now explore related insights and AI-powered analytics within a single host detail view. This view offers DevOps and engineers metrics related to health, security status, service events, and service level objectives (SLOs), paired with quick access to drill deep into logs or process-level insights.
As shown in Figure 3, the host details view is accessible directly from the list of host resources in Infrastructure & Operations and from within the overview pane.
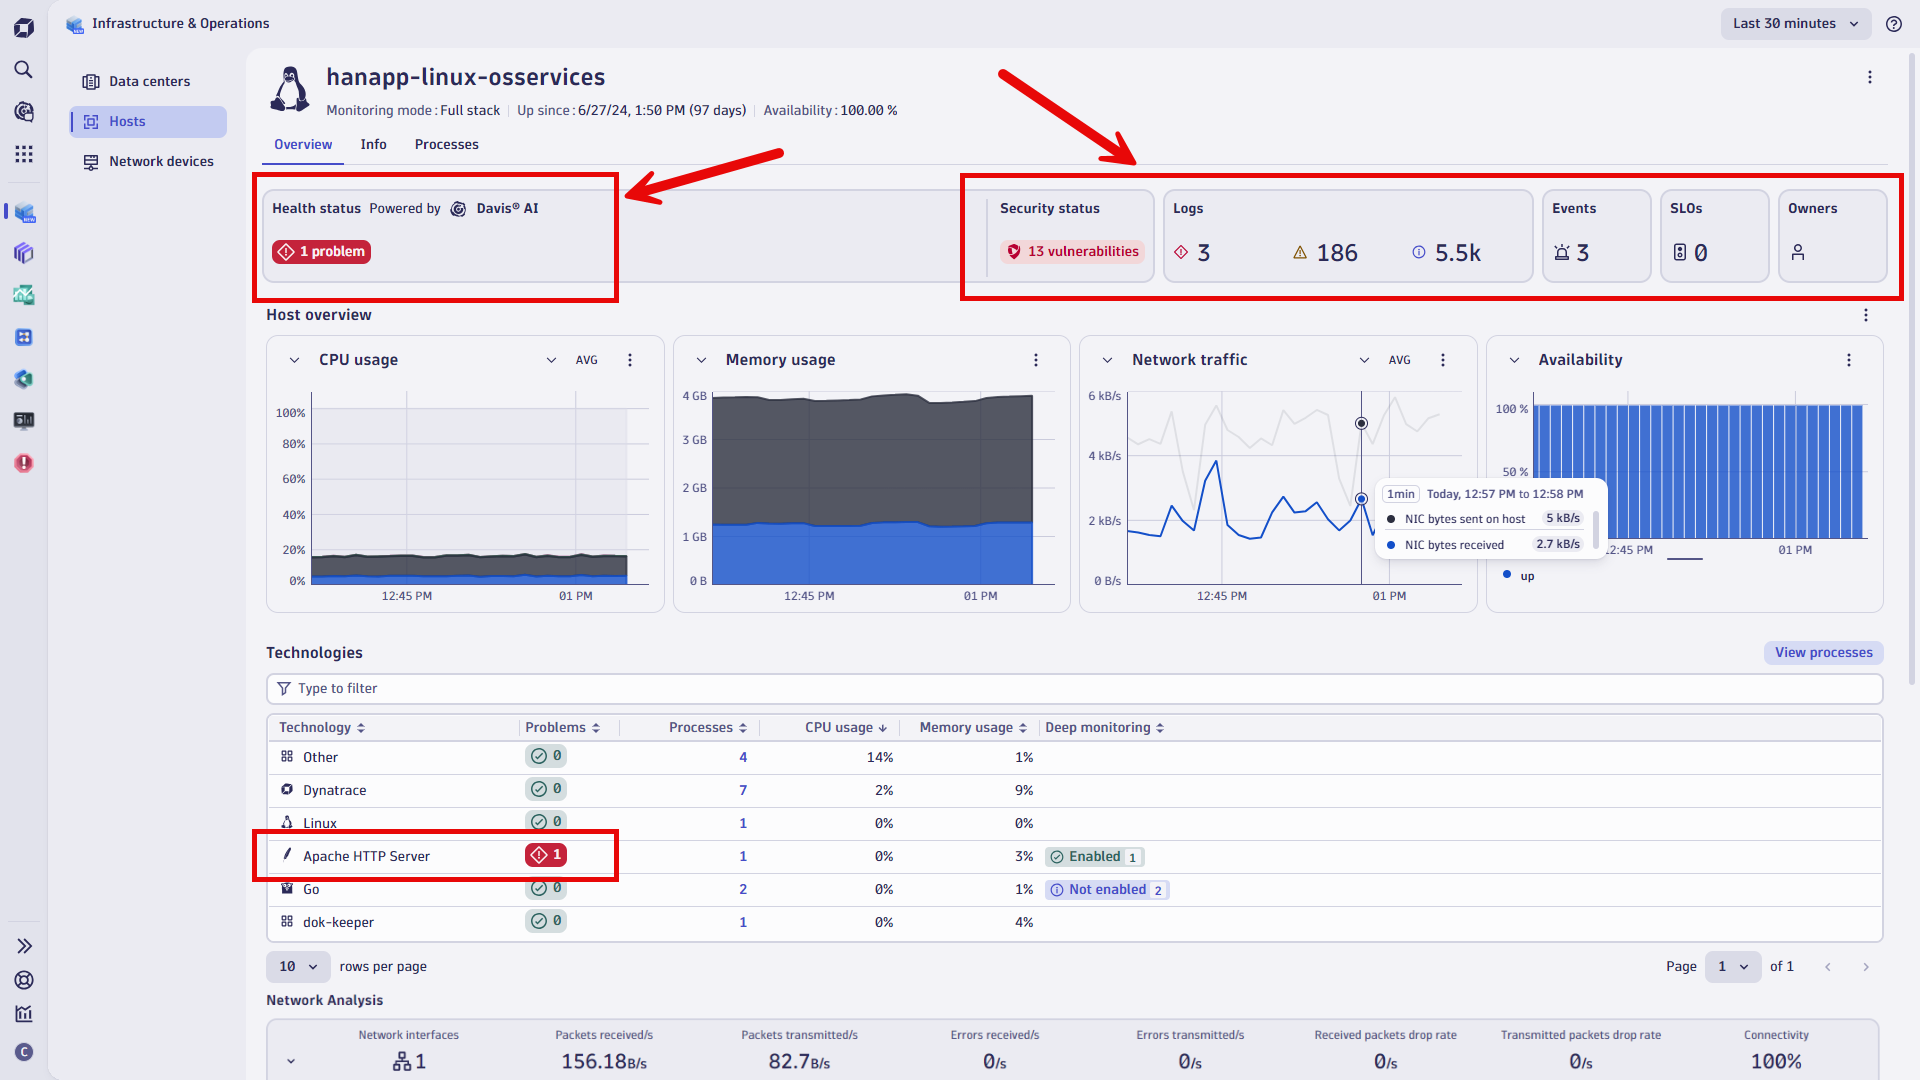
To increase efficiency and shorten operations cycles, the current filtered host detail view can be shared effortlessly by copying the URL in the browser’s address bar. Teams can share the current view via Teams, Slack, or any other messenger and include the current view and findings as part of a support ticket.
In cases where rich details of process and service level consumption are required, the host details provide you with a Processes page focused on utilization metrics and troubleshooting insights.
Technology-type tags can be added at the process and process group levels, splitting the technology tagging for hosts into main and sub-technologies. This simplifies filtering and automation efforts.
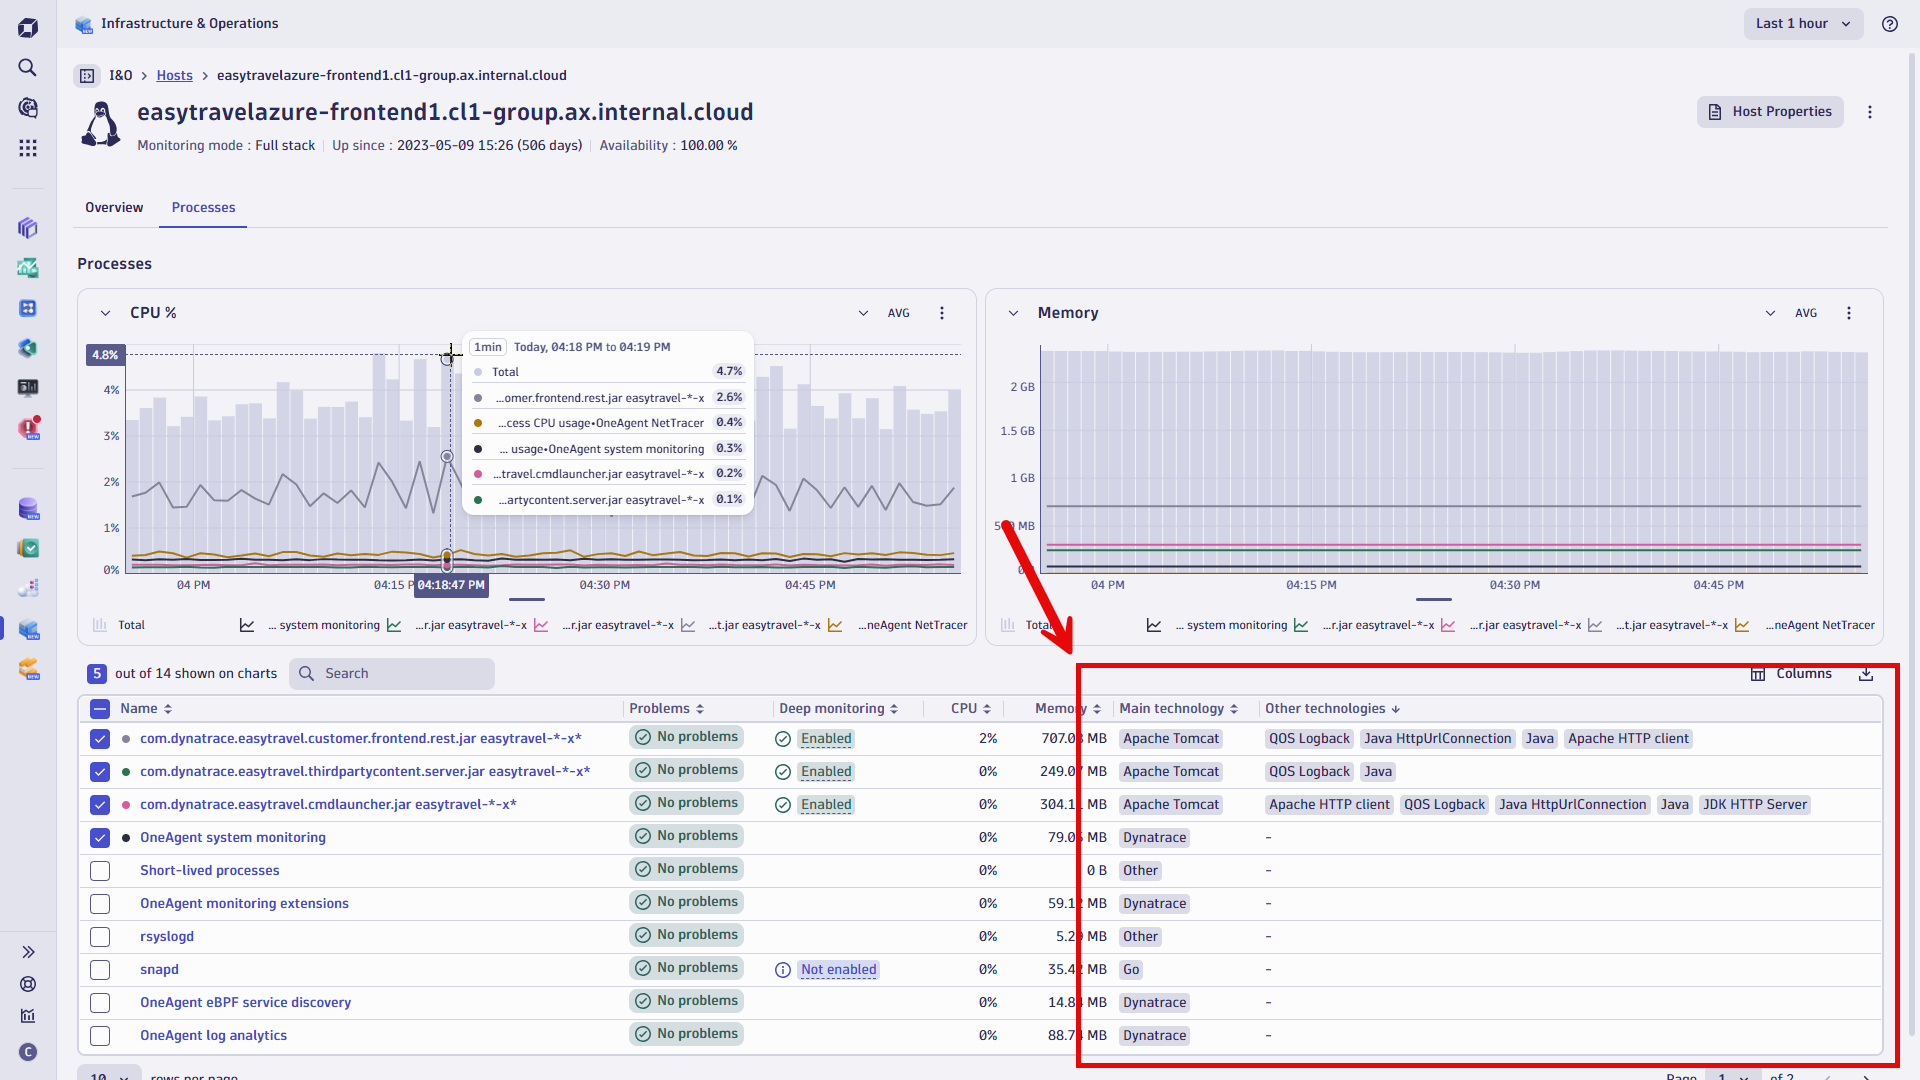
When deep monitoring is activated, drilling into the process detail view shows versioning and release information. Custom tags on the application level allow you to filter more easily while simultaneously enhancing automation capabilities.
A new feature makes it easier for IT teams managing large-scale environments to stay on top of every detail across any infrastructure or region. Now, with more granular insights into process performance and technology versions, teams can quickly review and detect anomalies, prioritize problems reported by Davis AI, and maintain SLOs and compliance—all in one place: Infrastructure & Operations.
Host networking metrics and visualization
Network performance bottlenecks are one of the most common troubleshooting challenges in large infrastructures. The new Host Detail view also introduces improved networking insights to streamline diagnostic efforts, including a summarized view of key network metrics, TCP packet transmission statistics, retransmit errors, and packet loss.
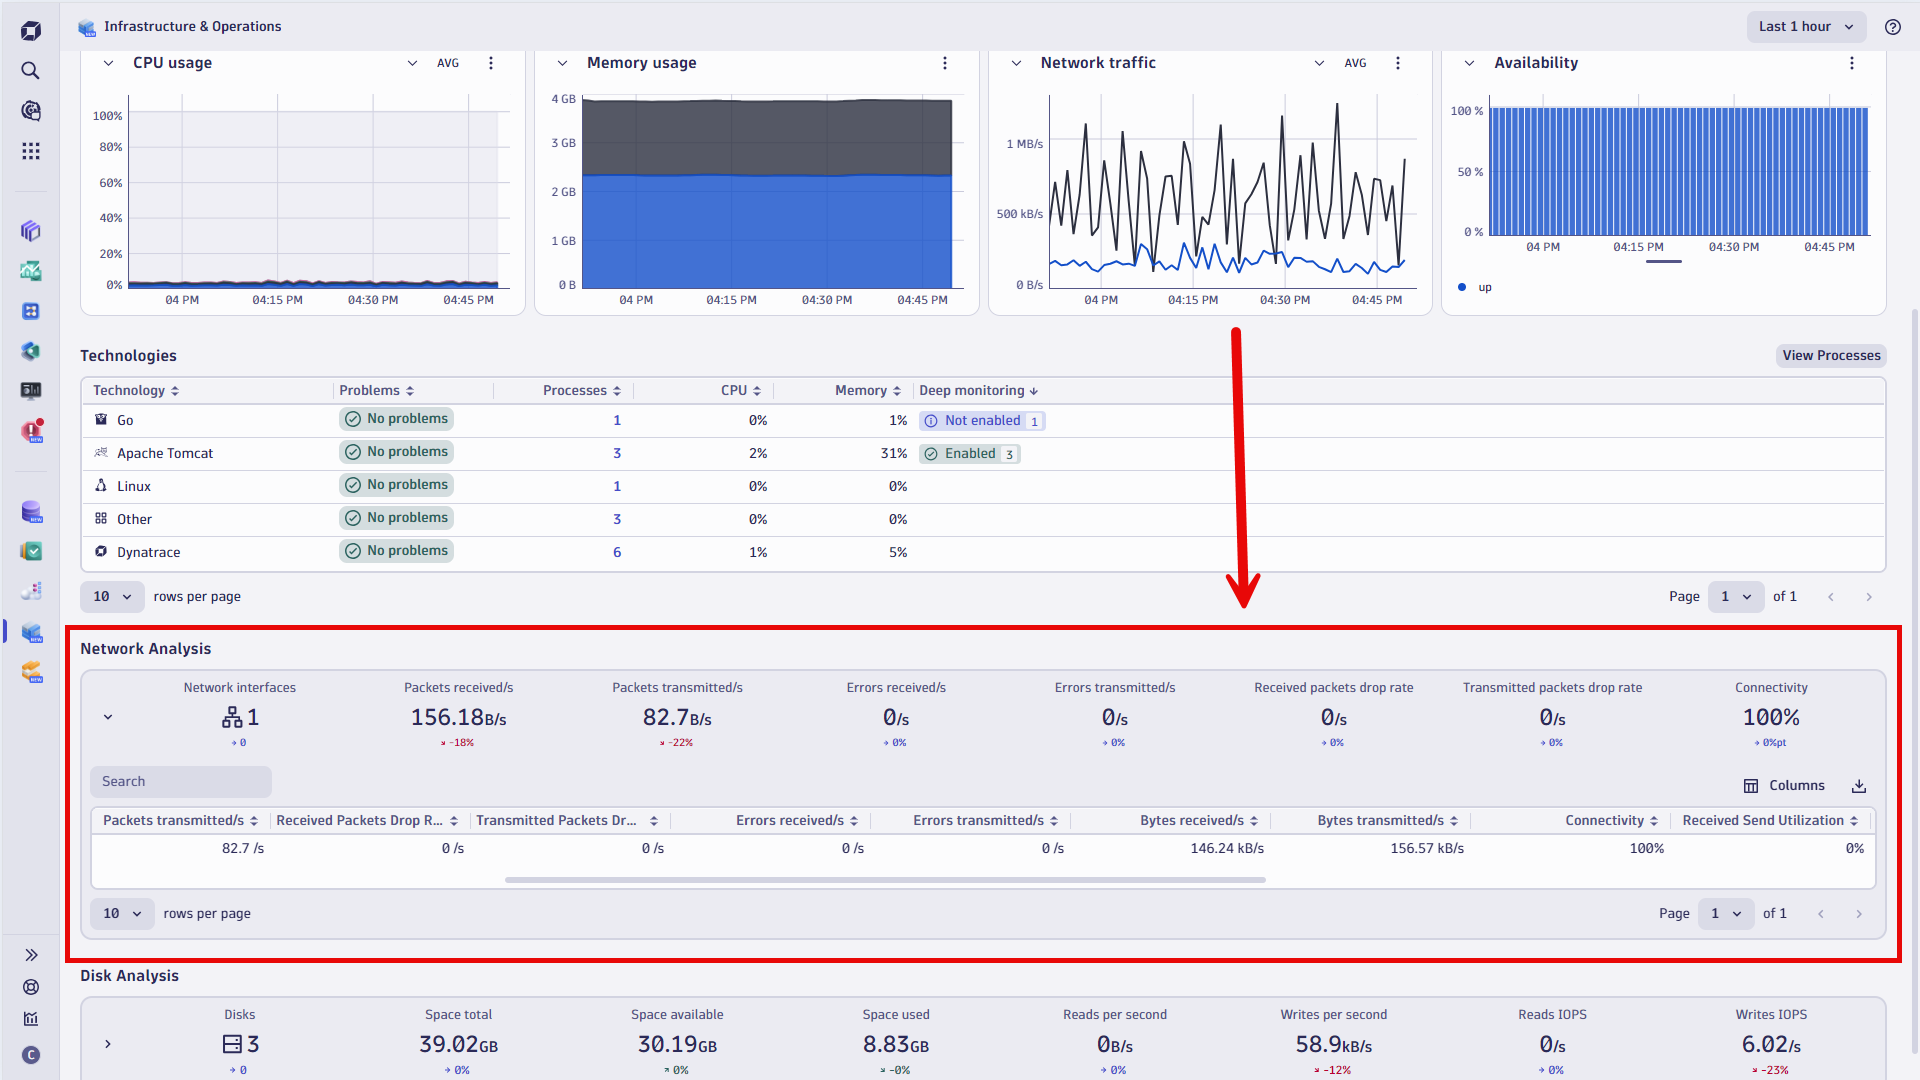
These metrics are critical for understanding network health on the application and host level, isolating issues related to network connectivity or connection outages.
This improvement directly helps DevOps and InfraOps teams by reducing the time spent identifying network-related issues in cross-functional efforts.
Network devices view: Extend end-to-end infrastructure observability
In the daily life of DevOps, InfraOps, or SRE, one of the most common routines and troubleshooting challenges in large infrastructures is staying ahead of network performance bottlenecks.
With SD-WAN appliances, firewalls, load balancers, routers, switches, and other network devices in place, this task is becoming quite challenging yet crucial.
Infrastructure & Operations features a newly introduced Networking Devices section, which provides networking visualizations to streamline these efforts within one place.
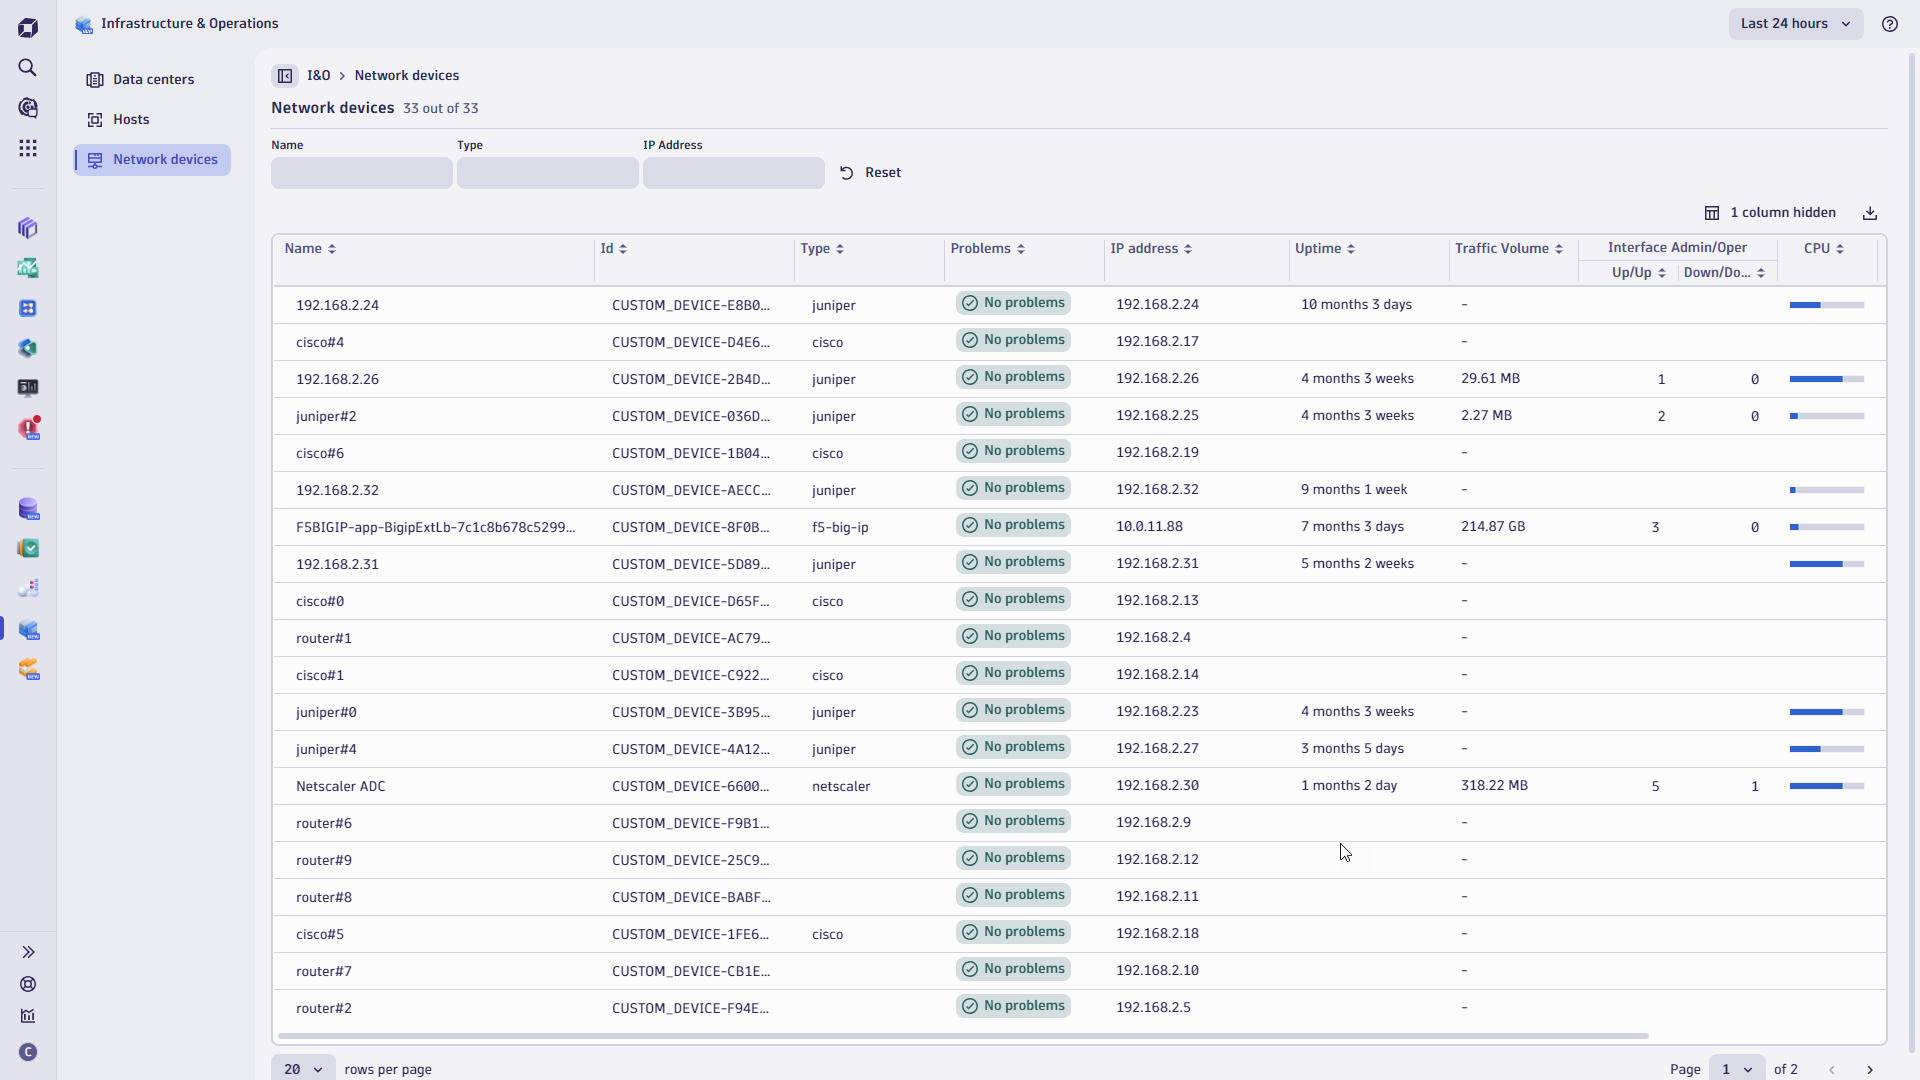
With extensions available for Cisco, Palo Alto, NetScaler, Juniper, F5, Fortinet, and HAProxy available within Dynatrace Hub, the Network devices section instantly provides value to teams. Existing, configured extensions provide metrics and Davis AI-powered analytics without additional configuration efforts. Networking devices and appliances not yet onboarded can swiftly be integrated via SNMP integration or technology-specific extensions, as highlighted above.
This new capability dramatically simplifies monitoring signals like ethernet interface availability status and network utilization metrics alongside hardware metrics and consumption. Dynatrace Davis AI plays an integral role in this newly introduced section by automatically identifying and raising problems that might otherwise go unnoticed. It enables IT teams to proactively manage network performance bottlenecks or outages quickly, potentially before these issues impact services and users.
Dynatrace: Powering the next level of end-to-end infrastructure observation
The continued integration of Grail™ data lakehouse and Davis AI into Infrastructure & Operations, alongside new features focusing on networking devices, show the Dynatrace commitment to providing IT teams with unmatched and holistic end-to-end infrastructure observability empowered by AI-driven insights.
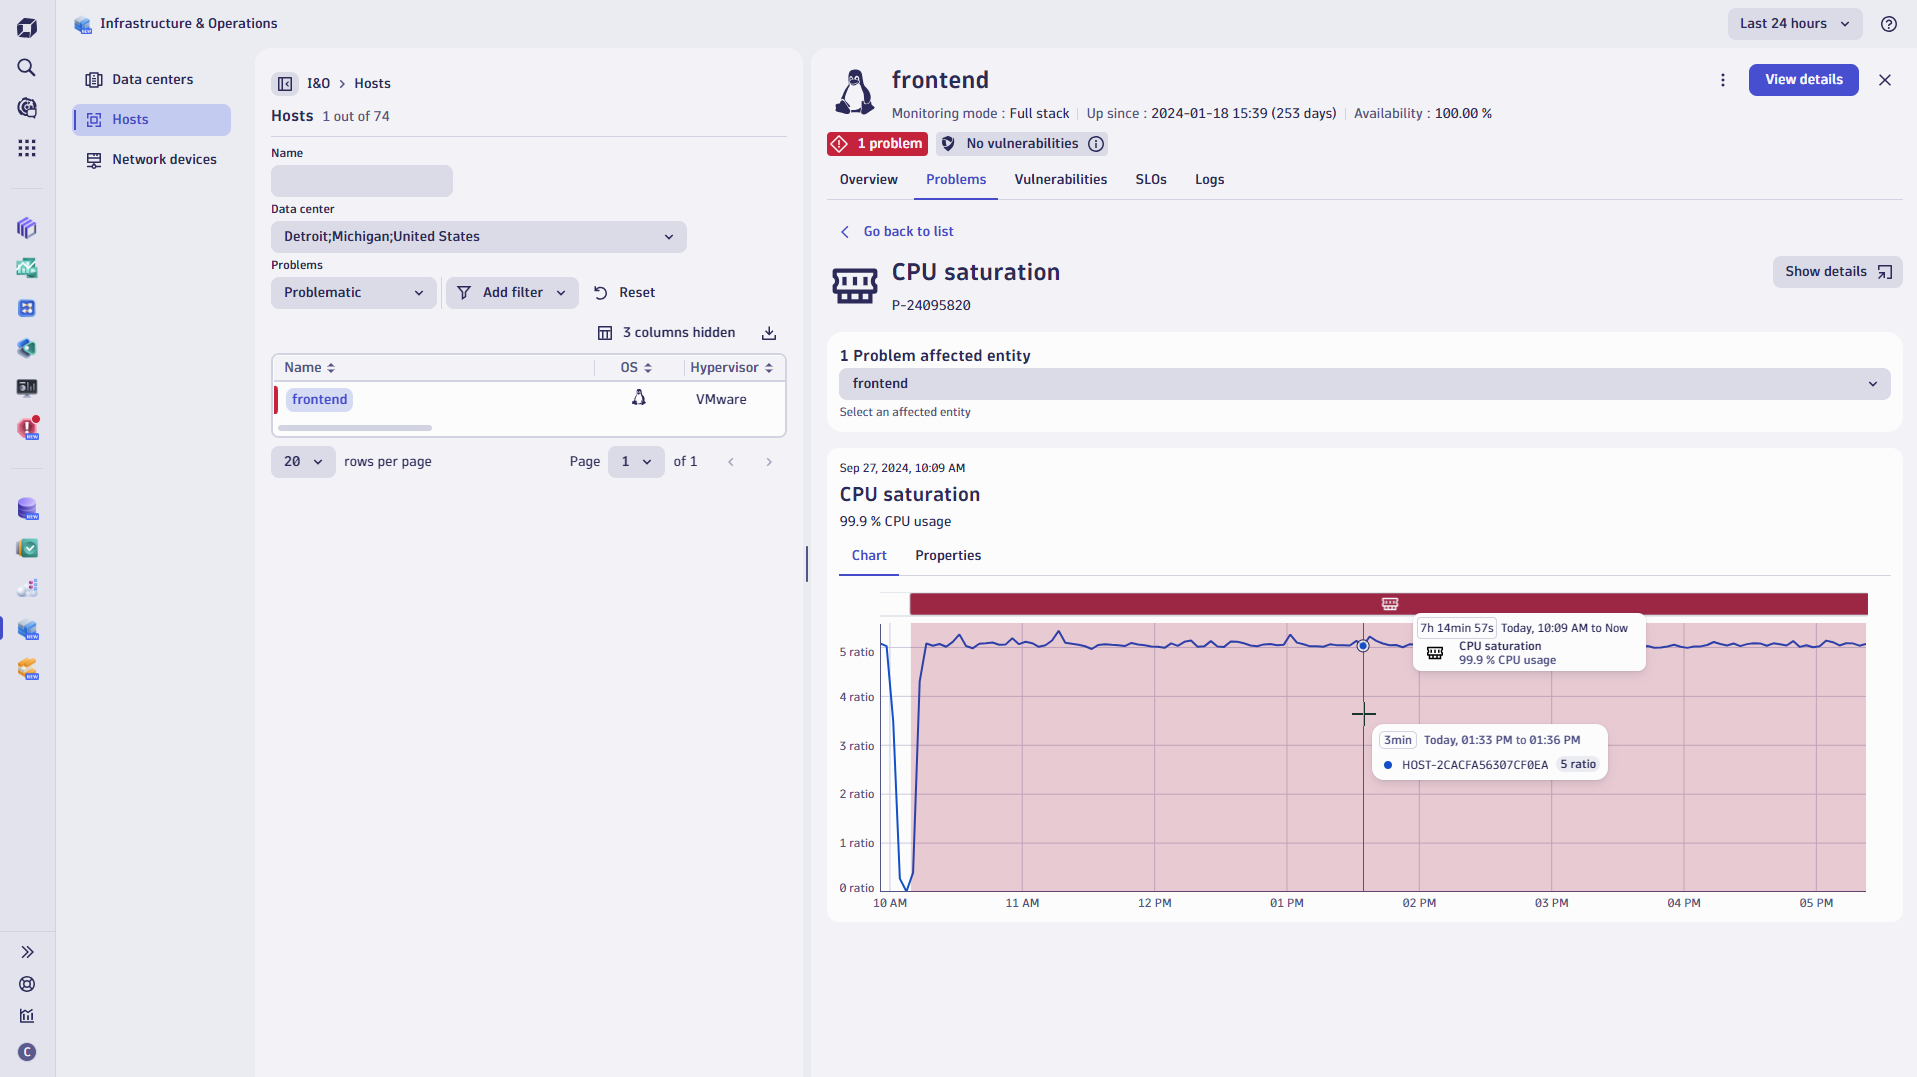
Together, these technologies enhance the ability of DevOps and InfraOps teams to manage the growing complexity of modern IT environments within a single platform and with a single app—Dynatrace Infrastructure and Operations.
With AI-driven root cause analysis, IT teams no longer need to manually correlate logs, metrics, and traces. Instead, the platform autonomously identifies the root causes of issues, minimizing downtime and freeing up valuable time for more strategic initiatives.
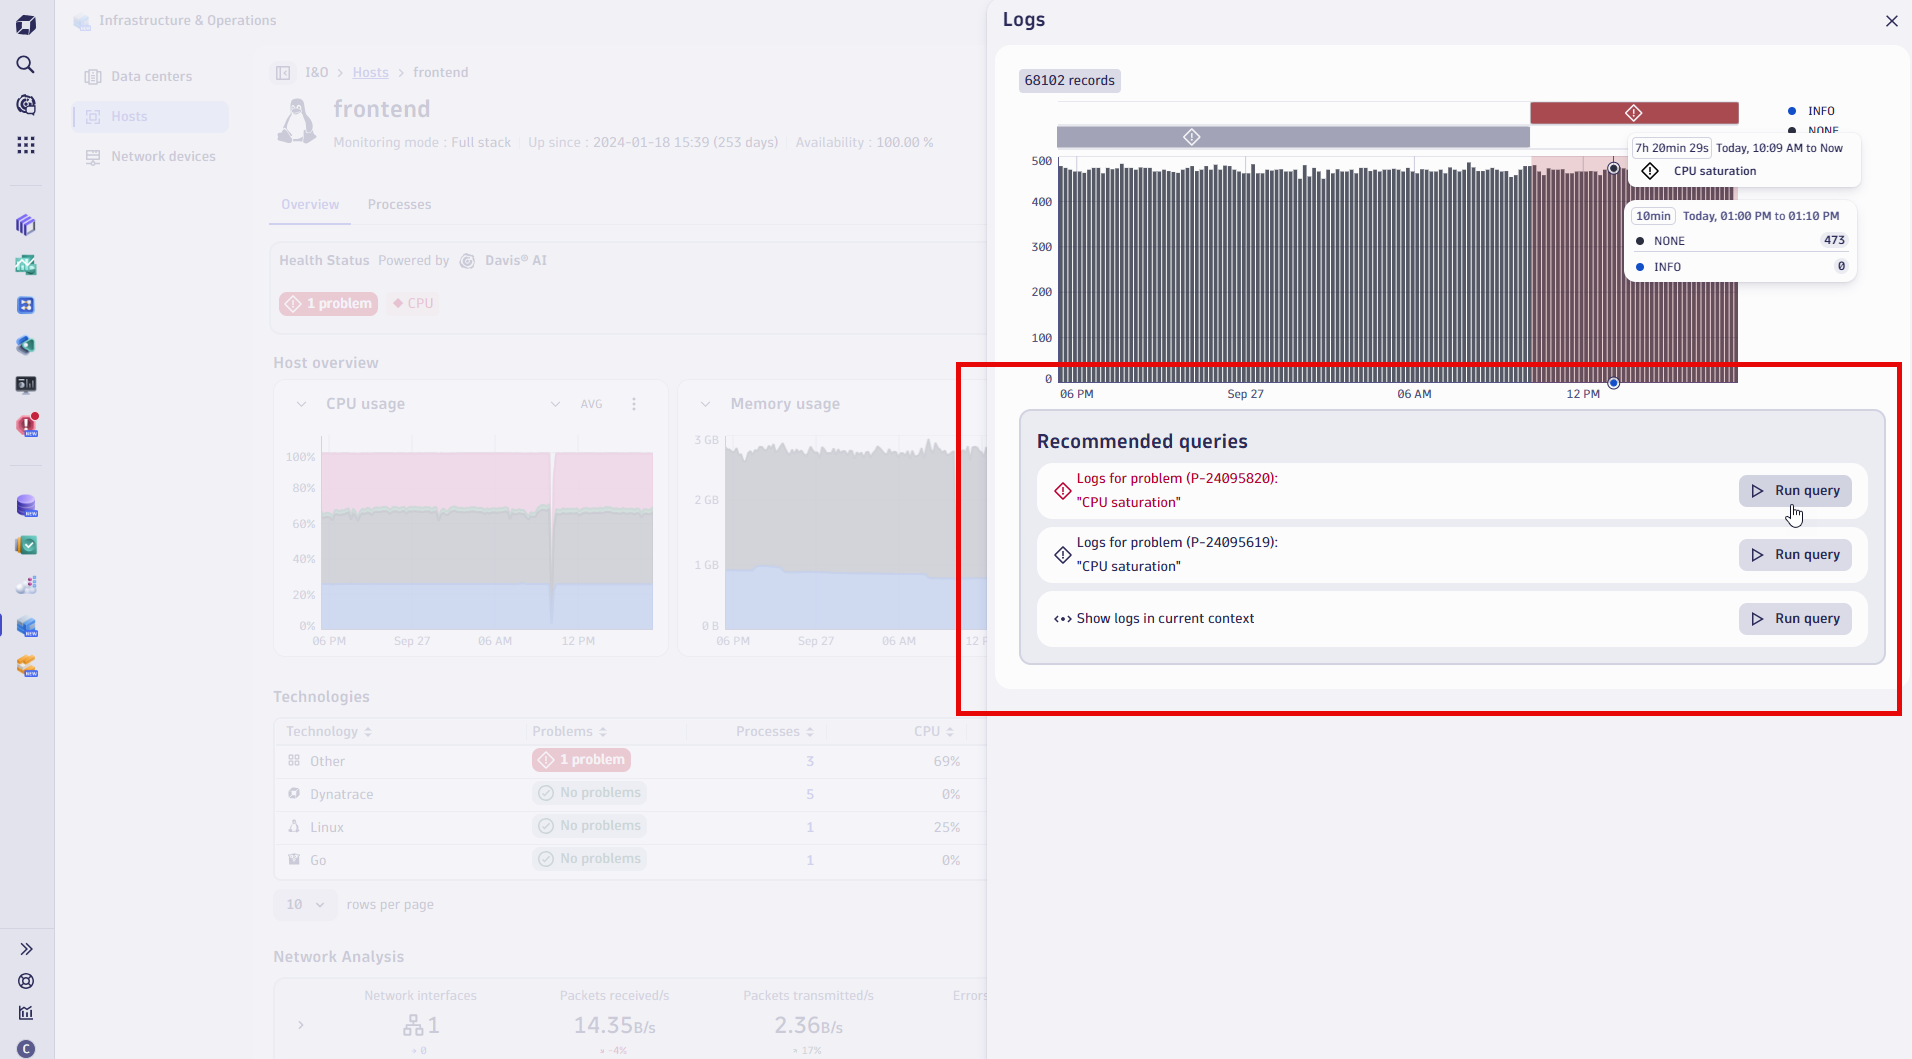
Networking specialists or architects who desire to surface the corresponding log lines are provided with pre-filtered query views, offering service-specific log information and surrounding logs of related components.
Engineers, developers, and power users are provided with the all-new Logs app, which we introduced recently in our blog post Simplicity meets power: Introducing the all-new Dynatrace Logs app.
Beyond the two apps mentioned, Davis CoPilot integration supports novice Dynatrace users by translating questions from natural language into Dynatrace Query Language (DQL) when requests become more sophisticated
Kickstart the new era of AI-powered end-to-end infrastructure observation with Dynatrace today!
Discover how the new and enhanced Infrastructure & Operations app can transform your daily routines and troubleshoot workflows to drive better business outcomes.
Existing Dynatrace customers with licenses that include Infrastructure Observability have automatic access to the new app and all other features available with Dynatrace SaaS; you don’t need to take any action other than to start using Infrastructure & Operations and its features.
Explore the latest updates on the Dynatrace platform by starting a free trial or requesting a live demonstration and taking a custom-tailored tour.



Looking for answers?
Start a new discussion or ask for help in our Q&A forum.
Go to forum