
Managing hybrid Kubernetes clusters that span Windows and Linux systems usually means siloed tools and data, missed health signals, and lots of context switching. But a unified observability approach to Kubernetes monitoring streamlines all those headaches so you can seamlessly monitor the health of your hybrid Windows and Linux clusters in a single view.
In modern containerized environments, teams often deploy Kubernetes across mixed operating systems, creating a situation where both Linux and Windows nodes reside in the same cluster. A primary challenge in managing these hybrid Kubernetes clusters is the fragmented monitoring caused by using siloed tools with varying support for the different operating systems.
This inconsistency leads to gaps in monitoring and alerting, making it difficult to maintain a unified view of the cluster’s health. Additionally, the complexity of configuring and maintaining different OS-specific settings without understanding their dependencies can result in misconfigurations and inefficiencies. Integrating data at an OS-agnostic cluster level is another hurdle, often leading to data silos and incomplete visibility. Teams also struggle with ensuring optimal resource allocation and scheduling across different OS nodes, affecting the overall efficiency of the cluster.
While this hybrid architectural approach offers flexibility, it also introduces the need for unified observability. To maintain system health and resolve issues quickly, teams must have reliable monitoring and performance insights across both Linux and Windows nodes within a single Kubernetes cluster.
With the many observability options available from Dynatrace, you can seamlessly monitor hybrid Kubernetes environments in a unified platform, gaining end-to-end visibility across both operating systems and the underlying cluster. This blog describes how to set up observability for a hybrid Kubernetes cluster that hosts both Windows and Linux nodes.
Three steps to set up hybrid Kubernetes observability
Setting up hybrid Kubernetes observability involves a few straightforward steps to deploy Dynatrace into your environment, enabling effective instrumentation of both application and infrastructure nodes.
Step 1: Deploy Dynatrace Operator for the Linux nodes
Deploy the Dynatrace Operator on the cluster, with the nodeSelector set to OS: Linux in both the OneAgent and ActiveGate sections of dynakube.yaml. This configuration auto-deploys the OneAgent as a DaemonSet on all the Linux nodes on the cluster and does not cause any impact on the Windows worker nodes.
nodeSelector:
  kubernetes.io/os: linux
Step 2: Deploy OneAgent using pod runtime injection in Windows application containers
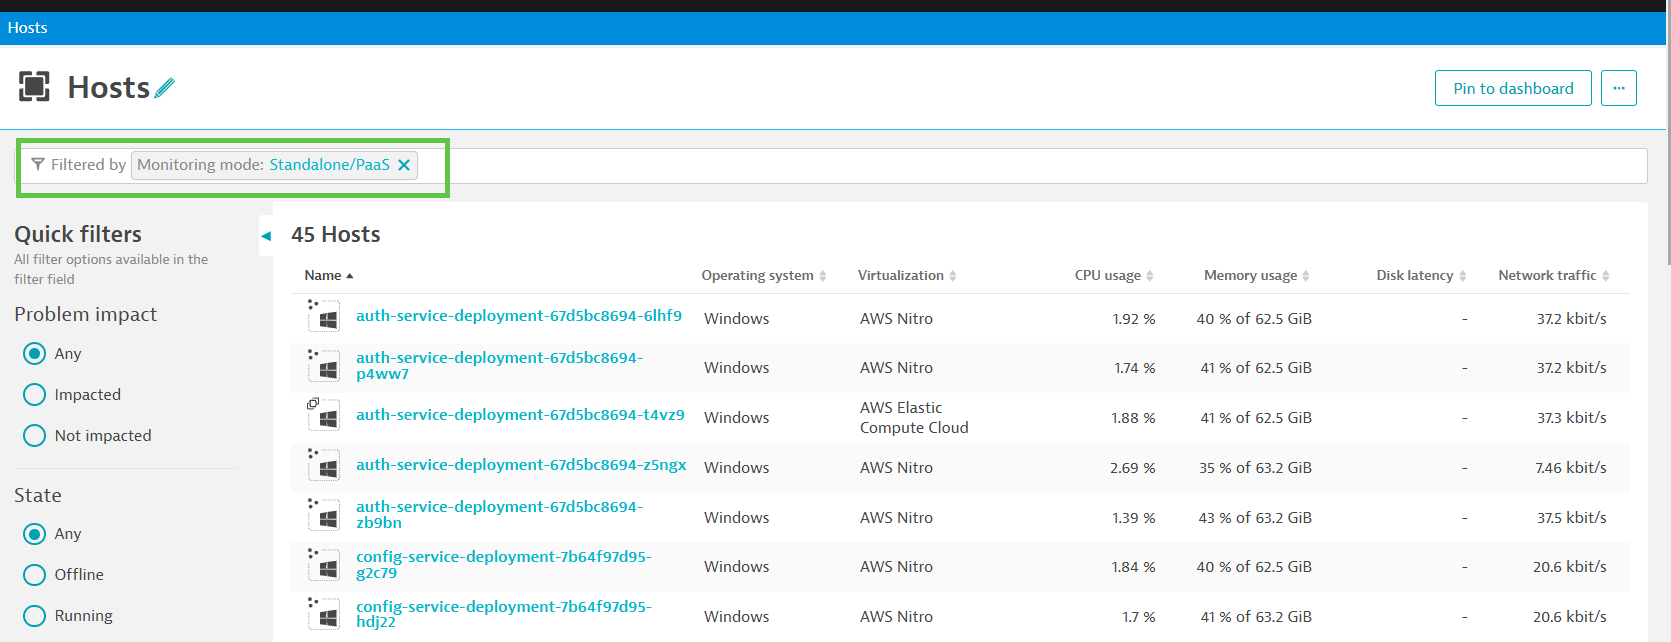
For Windows-based containers, deploy OneAgent on the containers that run on the nodes using the pod runtime injection technique. This instrumentation ensures that Dynatrace also captures telemetry from all the Windows microservices in real time. The containers list as individual PaaS hosts after successful deployment.
Step 3: Deploy OneAgent on the Windows nodes for infrastructure observability
To ensure infrastructure observability on Windows nodes, start by configuring and running a Dynatrace Workflow. This workflow will automate the periodic detection of newly spun-up Windows worker nodes and retrieve their IP addresses in the cluster. Once Dynatrace identifies the IPs, the workflow will invoke the Deployment API to download the latest version of the OneAgent for Windows installer. You can then use tools like Ansible to push the installer in administrator mode to the detected Windows nodes, enabling automated deployment and automated observability.
Instrument Java workloads on Windows
For Java pods running on Windows containers, let’s take a deep dive into how to integrate OneAgent into your application at runtime using pod runtime injection.
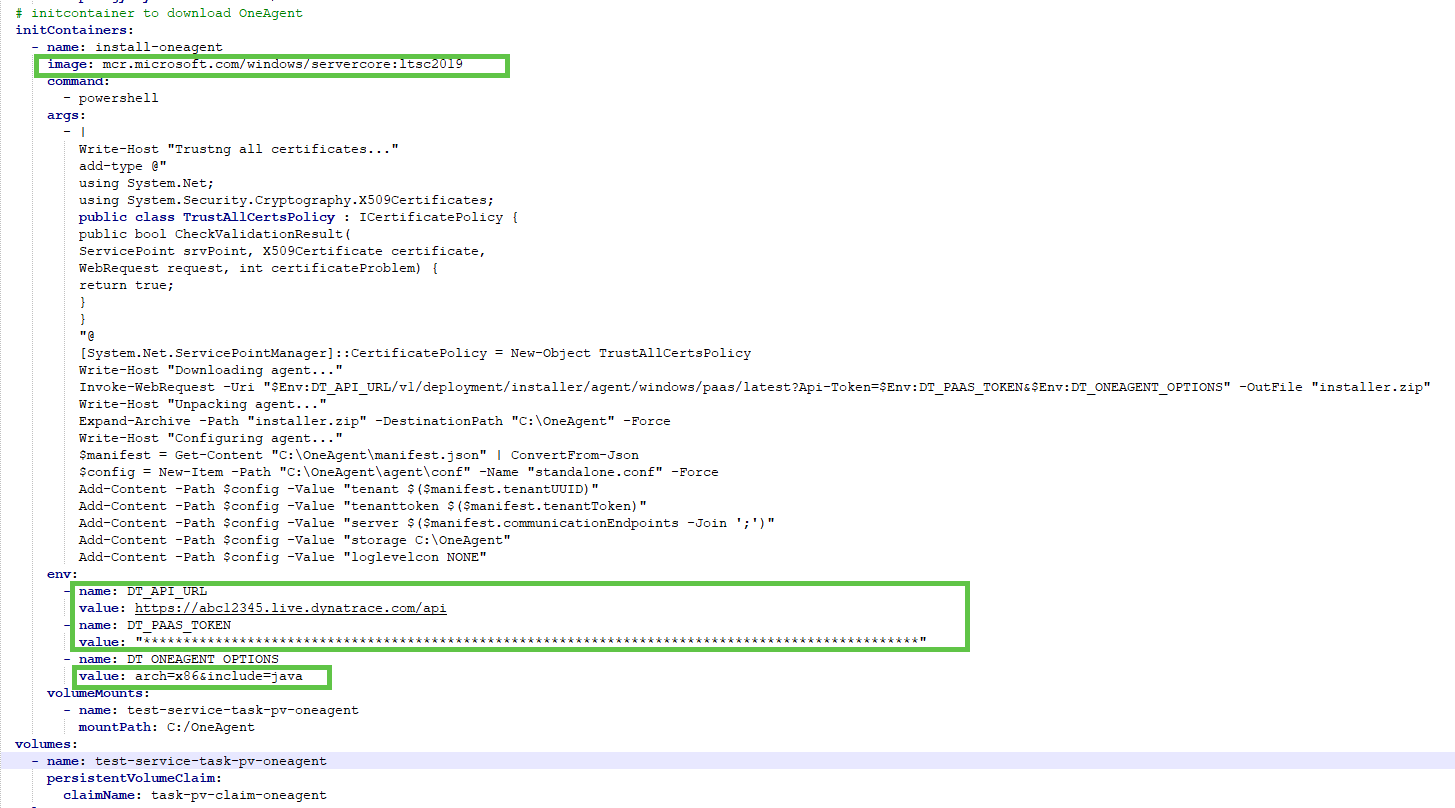
Modify the initContainer section in your application’s deployment file to indicate where the OneAgent is to be downloaded onto the container. The workflow then mounts OneAgent as a volume for the application containers to use. The configuration for the initContainer is almost the same as the .Net template. The main difference is when indicating the application technology in the environment variable DT_ONEAGENT_OPTIONS. Based on the Windows OS version you’re using, you may also need to update the image it pulls. You may also need to edit the tenant DT_API_URL and DT_ PAAS_TOKEN as needed according to the environment.
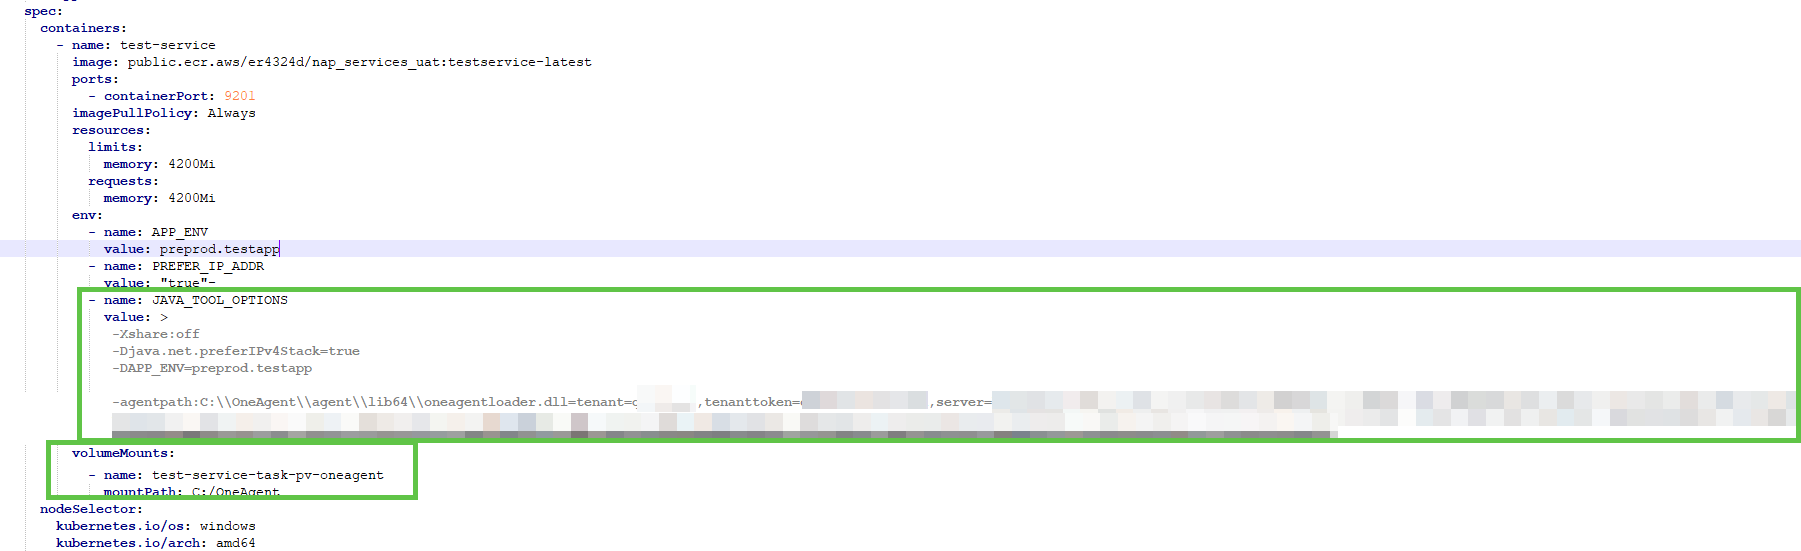
Next, edit the application’s main container spec with your environment variables to ensure that OneAgent gets loaded along with the JVM, in effect instrumenting the running Java application. In the env parameter JAVA_TOOL_OPTIONS, set the agentpath to the location where the oneagentloader.dll has been unzipped and also add the tenantID and tenanttoken, and server (communication) endpoint. Also include the volume name and mountPath of your OneAgent in the volumeMounts parameter.
To find the Dynatrace tenantID, tenanttoken, and communication endpoint, send the following curl GET call to the Agent Connection Info API.
curl https://abc12345.live.dynatrace.com/api/v1/deployment/installer/agent/connectioninfo?Api-Token=******************************************************************************************************************************
Experience unified observability across the hybrid cluster
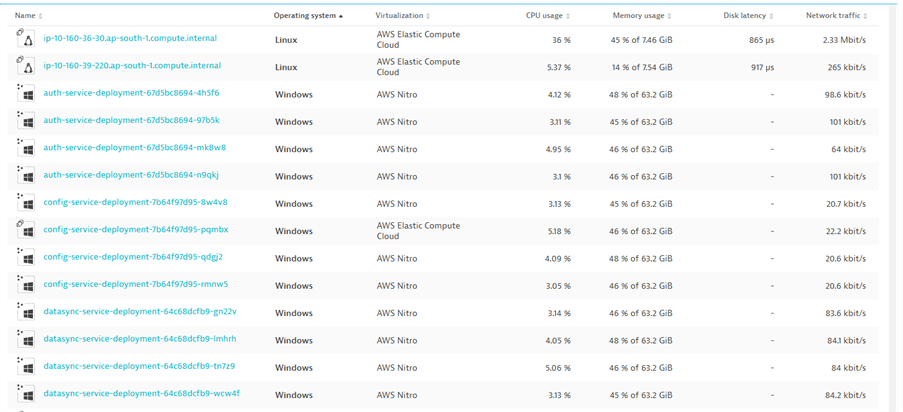
Once OneAgent is deployed across all the nodes in the hybrid K8s cluster, Dynatrace provides a unified view of both the Windows and Linux OS-based nodes as well as the underlying cluster, providing easy visualization of not only the nodes and the infrastructure but also the Kubernetes services, pods, and namespaces within the cluster.
Another benefit of unifying signals from your mixed-node clusters is centralizing log management. Dynatrace aggregates logs from both the Windows and Linux worker nodes automatically, enabling search, filter, and analysis of logs also from a single interface. This eliminates the need for separate log management systems for each OS, streamlining your observability workflow.
Troubleshoot hybrid Kubernetes issues with ease
When performance issues arise, the Dynatrace AI-powered platform provides real-time, full-stack observability across both environments. Whether an issue is specific to a Linux node, a Windows node, or a cross-platform service, AI-driven insights from Dynatrace enable quick root cause analysis and resolution. In the following example, Dynatrace has automatically alerted on problems with the inventory service, highlighting that some of the pods are not yet in a ready state.

Get started monitoring your hybrid Kubernetes clusters
Because hybrid Kubernetes environments often include services that run on both Windows and Linux nodes, teams need quick observability and analysis of both. With Dynatrace, you can trace requests and monitor application performance end-to-end, no matter what OS the workloads run on. Distributed tracing tracks these requests across both Windows and Linux workloads, helping you quickly understand latency, bottlenecks, and failure points that may span multiple nodes in your hybrid setup.
By implementing Dynatrace in your hybrid Kubernetes environment, you can continuously monitor both your Windows and Linux nodes with full observability. This capability not only provides insights into system performance but also simplifies troubleshooting, root cause analysis, and application optimization, no matter the underlying operating system.
Learn more about Kubernetes monitoring.


Looking for answers?
Start a new discussion or ask for help in our Q&A forum.
Go to forum