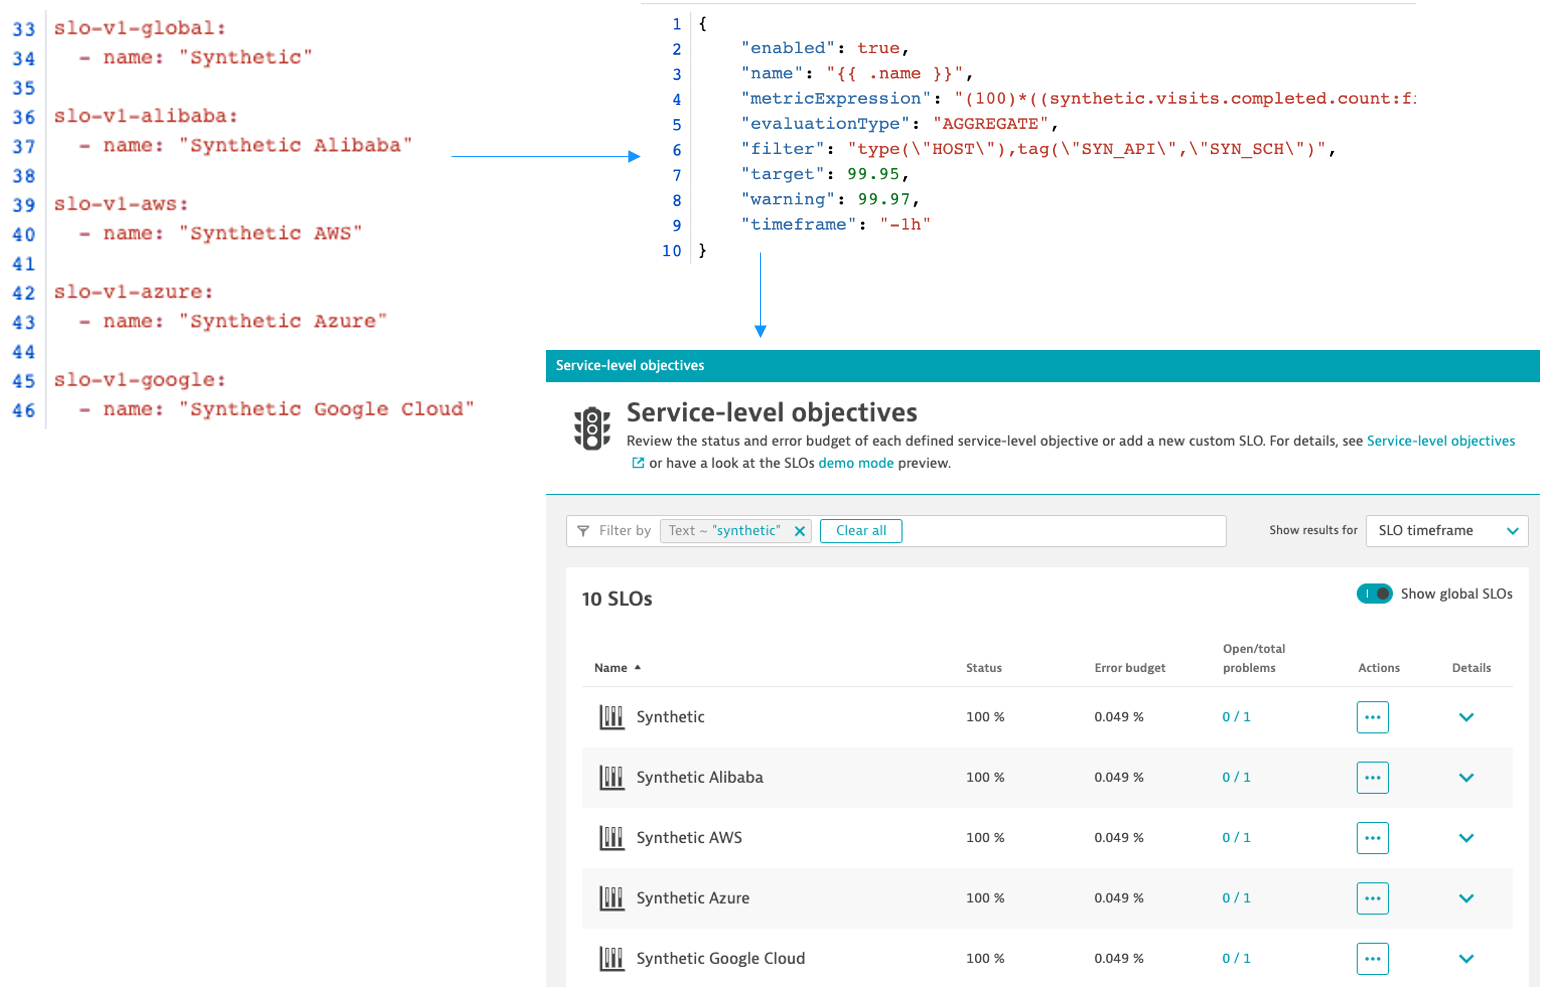
Dynatrace enhances API endpoints, its open-source command line interface, and cloud automation configurability to enable organizations to apply observability, AIOps, and application security as code. This enables developers to easily incorporate software intelligence capabilities into their applications' lifecycle and apply service-level objectives (SLOs) for critical metrics, including performance, quality, and security while adhering to operations standards. With this approach, Dynatrace customers can reduce application onboarding time from hours to just a few minutes.
One of the primary drivers behind digital transformation initiatives is the desire to streamline application development and delivery to bring higher quality, more secure software to market faster.
To accomplish this, organizations have widely adopted DevOps, which encompasses significant changes to team culture, operations, and the tools used throughout the continuous development lifecycle.
More recently, teams have begun to apply DevOps best practices to infrastructure automation, giving developers a more active role with GitOps as an operational framework. Modern infrastructure needs to be elastic and GitOps approaches are used to automate the provisioning of infrastructure and applications using Git, an open-source control system that provides the change processes including reviews and approvals. Key components of GitOps are declarative infrastructure as code, orchestration, and observability.
Observability is required for effective collaboration and automation
Site Reliability Engineering (SRE) relies on observability and the automated setup of observability to find answers to questions like, “Did my deployment work?”, “Did the change improve our users’ experience?”, or “Did the last update cause the application issue or was it something else?” But this is hard to achieve at scale:
- Development teams need specific insights into the microservices they are responsible for, reflecting particular metrics, dashboards, custom alerts, service-level objectives (SLOs), or even automatic remediation steps. But setting up the required tooling requires in-depth knowledge and causes massive effort if done manually.
- Operations and observability teams can’t provide the required customizations for hundreds of other teams. If they aren’t able to provide an automated self-service approach, they will not only fail to provide observability, they’ll fail to establish organizational standards at scale.
Many observability solutions don’t support an “as code” approach. They require manual effort or might even render automated approaches impossible due to:
- Missing or limited API support for the configuration of the observability platform.
- Missing capabilities or lack of configuration templates that effectively handle configuration dependencies.
- Required third-party tools that create additional complexity and massive effort during configuration, maintenance, or automation at scale.
Because of these issues, developers often still lack control over the behavior of their monitoring platform. Configurations, such as custom metrics, service-level indicators (SLIs), SLOs, dashboards, and alerting rules are often created manually without central management and don’t meet corporate requirements.
Dynatrace enables software intelligence as code
Dynatrace uniquely provides software intelligence as code by combining observability, AIOps (AI for IT operations), and application security. Organizations that embrace GitOps can rely on automated software intelligence and bring new features to market faster with higher quality by ensuring insights and common repeatable standards and goals. This enables effective DevSecOps collaboration, as well as observability-driven automation against all critical metrics (speed, security, stability, availability, productivity, and business metrics) at enterprise scale.
As a result, Dynatrace customers can reduce application onboarding time from hours to just a few minutes. Considering that large organizations often have hundreds of applications in ever-changing multicloud environments, this is a massive accelerator and creates a foundation for improved cross-functional collaboration.
Dynatrace provides powerful API endpoints for automated operations and observability so that you can configure the Dynatrace platform at scale. Configurations can be managed centrally as a single source of truth for easier revision, including versioning support.
SRE teams can easily provide templates for customized configuration of specific components, for example, tailored dashboards, metrics, alerts, SLOs, or remediation steps. Application and DevOps teams can use and adapt these templates to get specific insights and drive automation for their applications while adhering to company standards.

Dynatrace further extends functionality to easily customize observability, application security, and AIOps as code with the following upcoming enhancements:
- New API endpoints that provide granular observability customization for containers and processes, web and mobile applications, server-side services, and much more. This builds on existing functionality, including configurable dashboards and business analytics via API.
- Additional API endpoints that extend AIOps configuration, enabling DevOps teams to fine-tune anomaly detection and alerting based on management-zone permissions, which enable a secure approach to self-service.
- The open-source command-line interface for monitoring as code with Dynatrace to provide new functionality that empowers SRE teams that provide self-service SLO management to DevOps teams.
- Application security capabilities can be unlocked via API, activating automatic vulnerability management at scale.
- Additional Dynatrace Cloud Automation integrations-as-code enable the orchestration of DevOps toolchains, as well as the automation of these toolchains based on observability and security metrics.
How to get started
All Dynatrace enhancements mentioned in this blog post will be available within the next 90 days.
If you are a Dynatrace customer and want to get started, you’ll find more information and first steps on GitHub. Otherwise, contact our Services team.
If you’re not using Dynatrace yet, it’s easy to get started in less than five minutes with the Dynatrace free trial.


Looking for answers?
Start a new discussion or ask for help in our Q&A forum.
Go to forum