Synthetic HTTP monitors provide 24/7, around-the-world visibility into the health of your business-critical web applications and API endpoints. Now, utilizing the full power of the latest Dynatrace SaaS, HTTP monitors offer an enhanced set of data, enabling quicker, more precise root cause analysis of discovered problems and shortening MTTR.
The improved UI of the new Synthetic app makes managing your synthetic tests and analyzing their results easier and more effective. Exploratory analytics now cover more bespoke scenarios, allowing you to access any element of test results stored in the Dynatrace Grail™ data lakehouse. This allows you to build customized visualizations with Dashboards or perform in-depth analysis with Notebooks.
Traditional insight into HTTP monitor execution details
For nearly two thousand Dynatrace customers, Dynatrace Synthetic HTTP monitors provide insights into the health of monitored endpoints worldwide and around the clock. Customizable notifications about particular problems causing test failures are delivered as soon as the problems are discovered. This allows you to analyze issues and react immediately, ideally before your users are affected.
For more complex cases, where the basic information about an HTTP monitor’s execution failure delivered with a notification is insufficient, Dynatrace provides complete details of the last failed execution of said HTTP monitor. Analyzing the delivered payload (response body), response headers, or even details of requests sent during the monitor’s execution is invaluable when analyzing the failure’s root cause.
But nowadays, with complex and dynamically changing modern IT systems, the last result details might not be enough in some cases. And it was spotted and delivered to us as feedback from our customers within the Product Idea community:
“Currently, for HTTP monitors, only details for the last failed execution per location are shown. Sometimes, when there are several failures before that you weren’t able to track (like during the weekend or night), you have very few details of what failed.”
— DT community user
How the new Synthetic app better supports root cause analysis (RCA)
As always, Dynatrace listens to your feedback! Therefore, with the release of a new version of the Synthetic app supporting HTTP monitors, we’re happy to announce that HTTP monitors’ result details are no longer limited to the last successful and failed executions. Thanks to the power of Grail, those details are available for all executions stored for the entire retention period during which synthetic results are kept.
The new Dynatrace Synthetic app allows you to analyze these results. It now fully supports not only Network Availability Monitors but also HTTP synthetic monitors. The Refreshed Analyze Executions page has been enhanced with a scatter plot chart showing all executions of configured HTTP monitors.
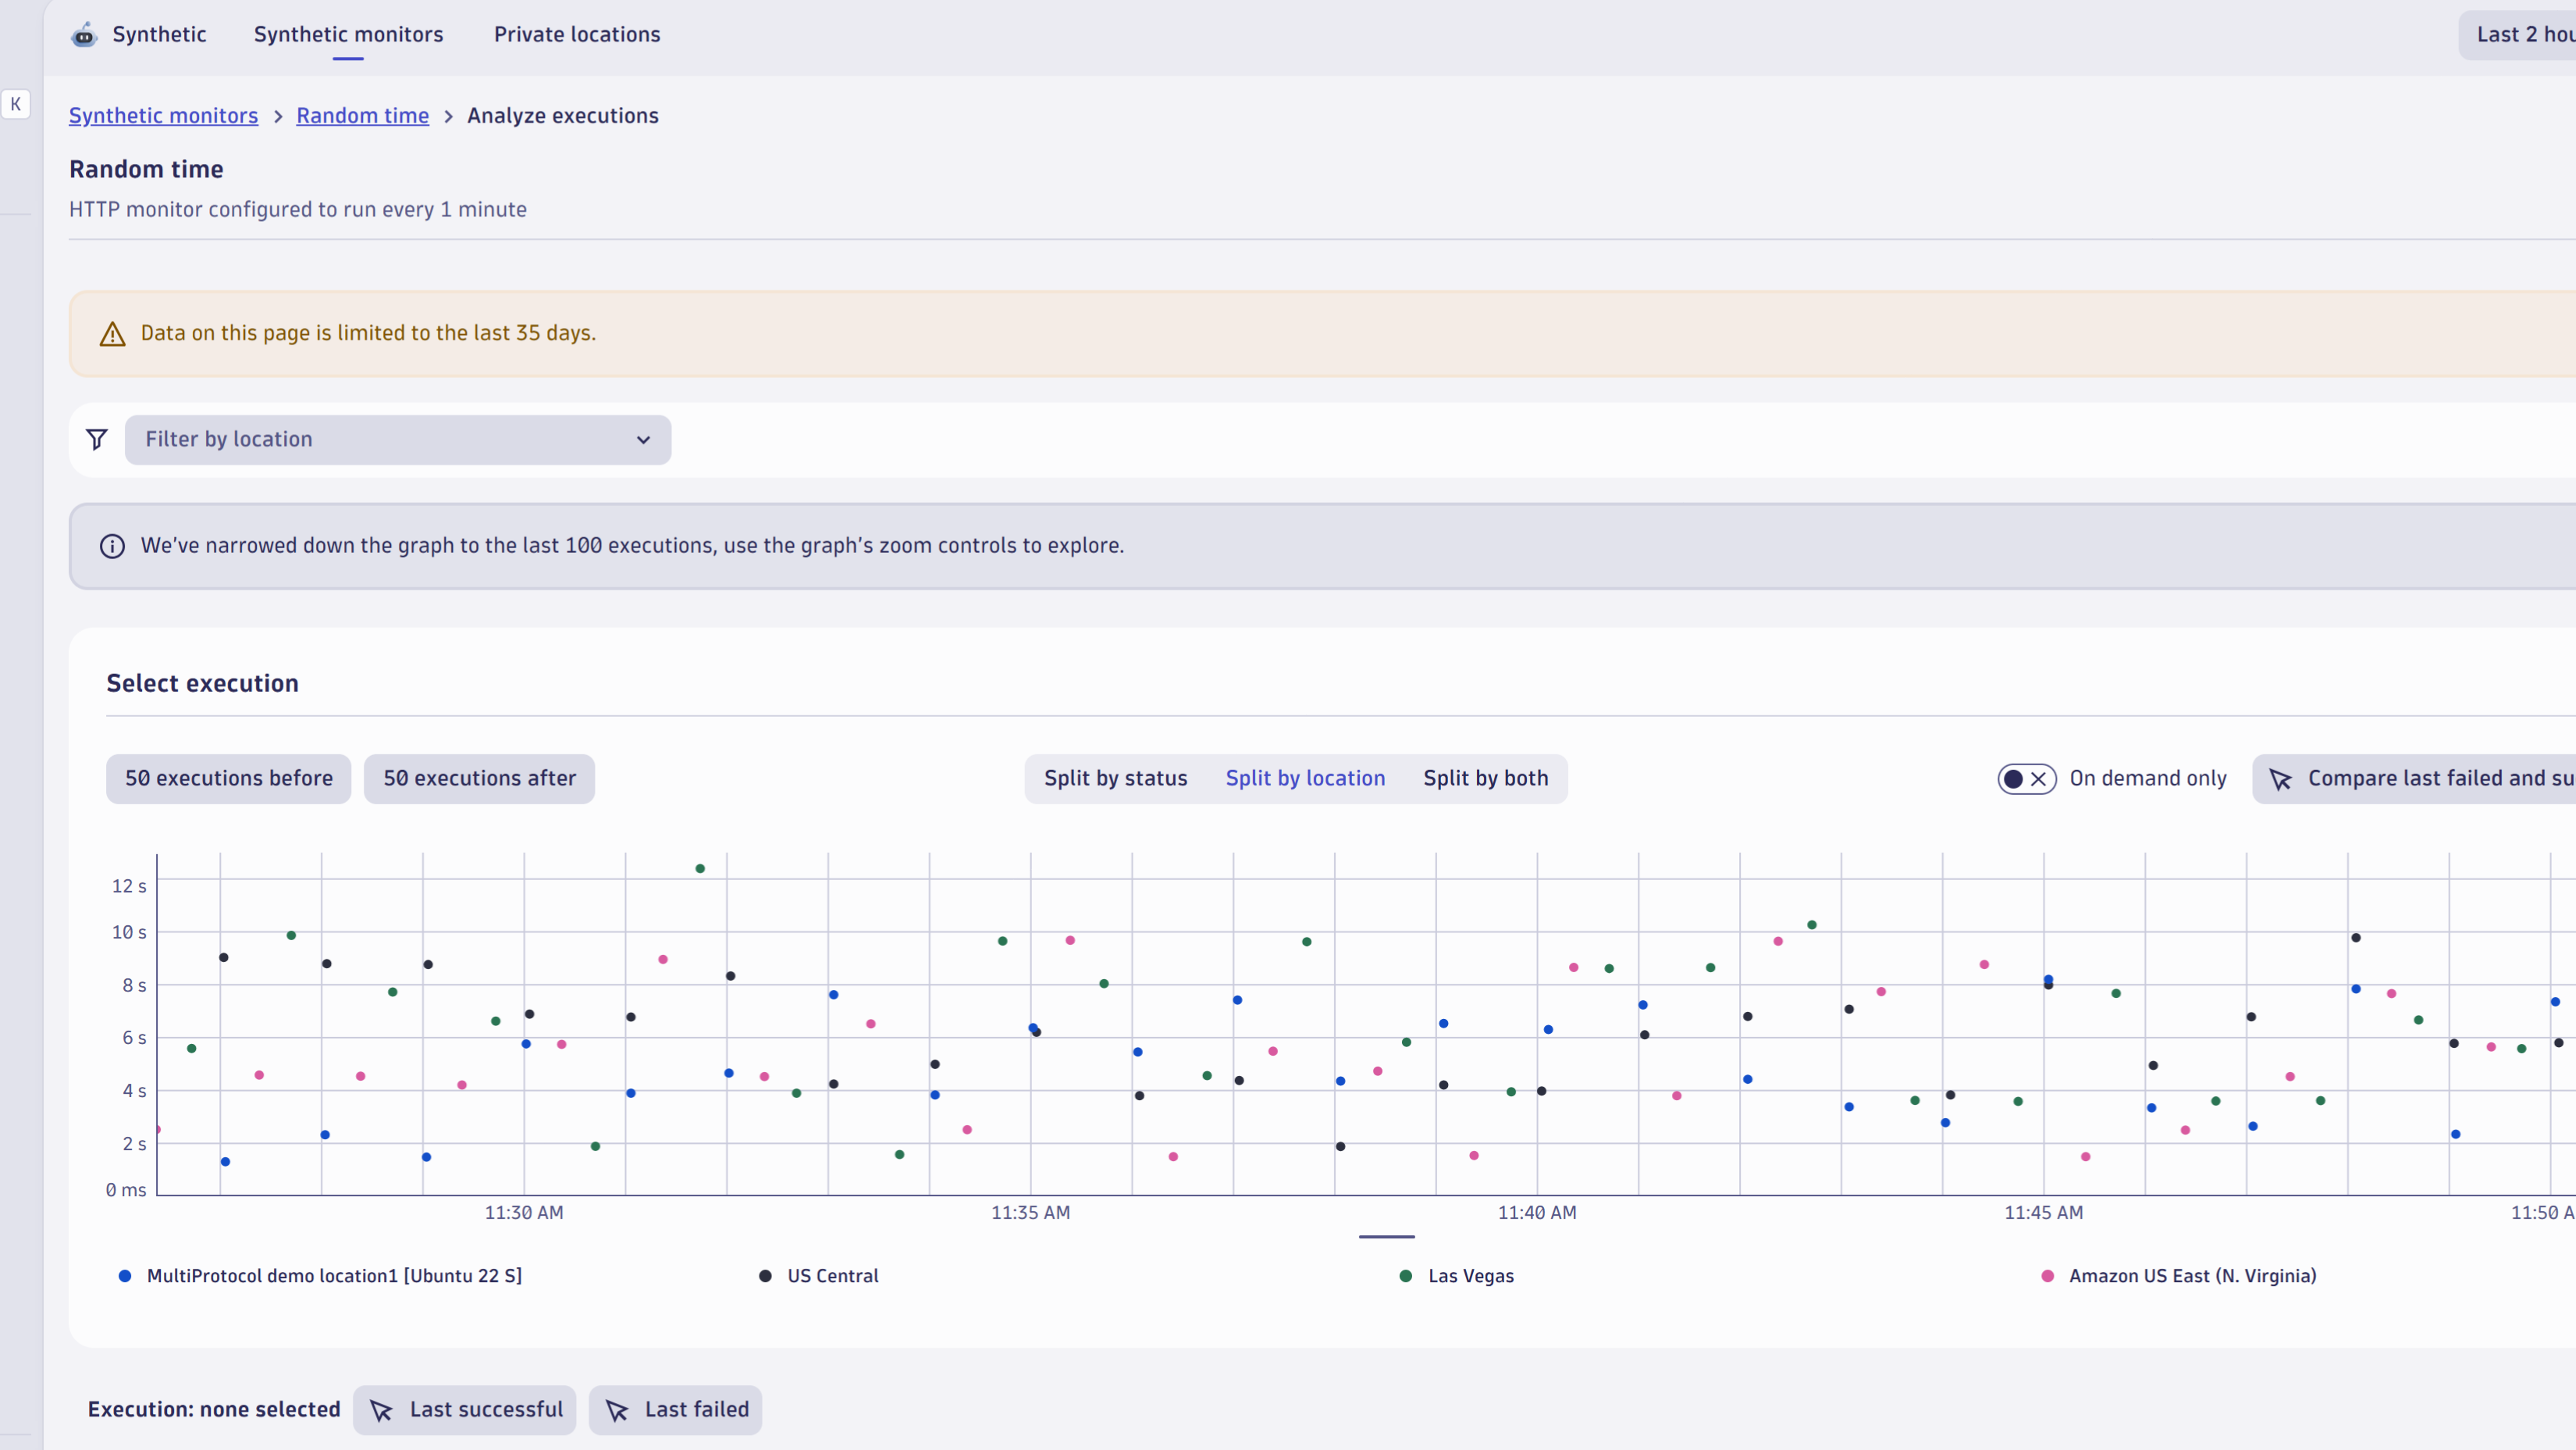
Each dot represents an HTTP monitor execution. Select any execution you’re interested in to display its details, for example, the content response body, its headers, and related metrics. Details of requests sent during each monitor execution are also available. The filtering panel on the left-hand side of the page allows you to focus only on those elements that are critical for your analysis.
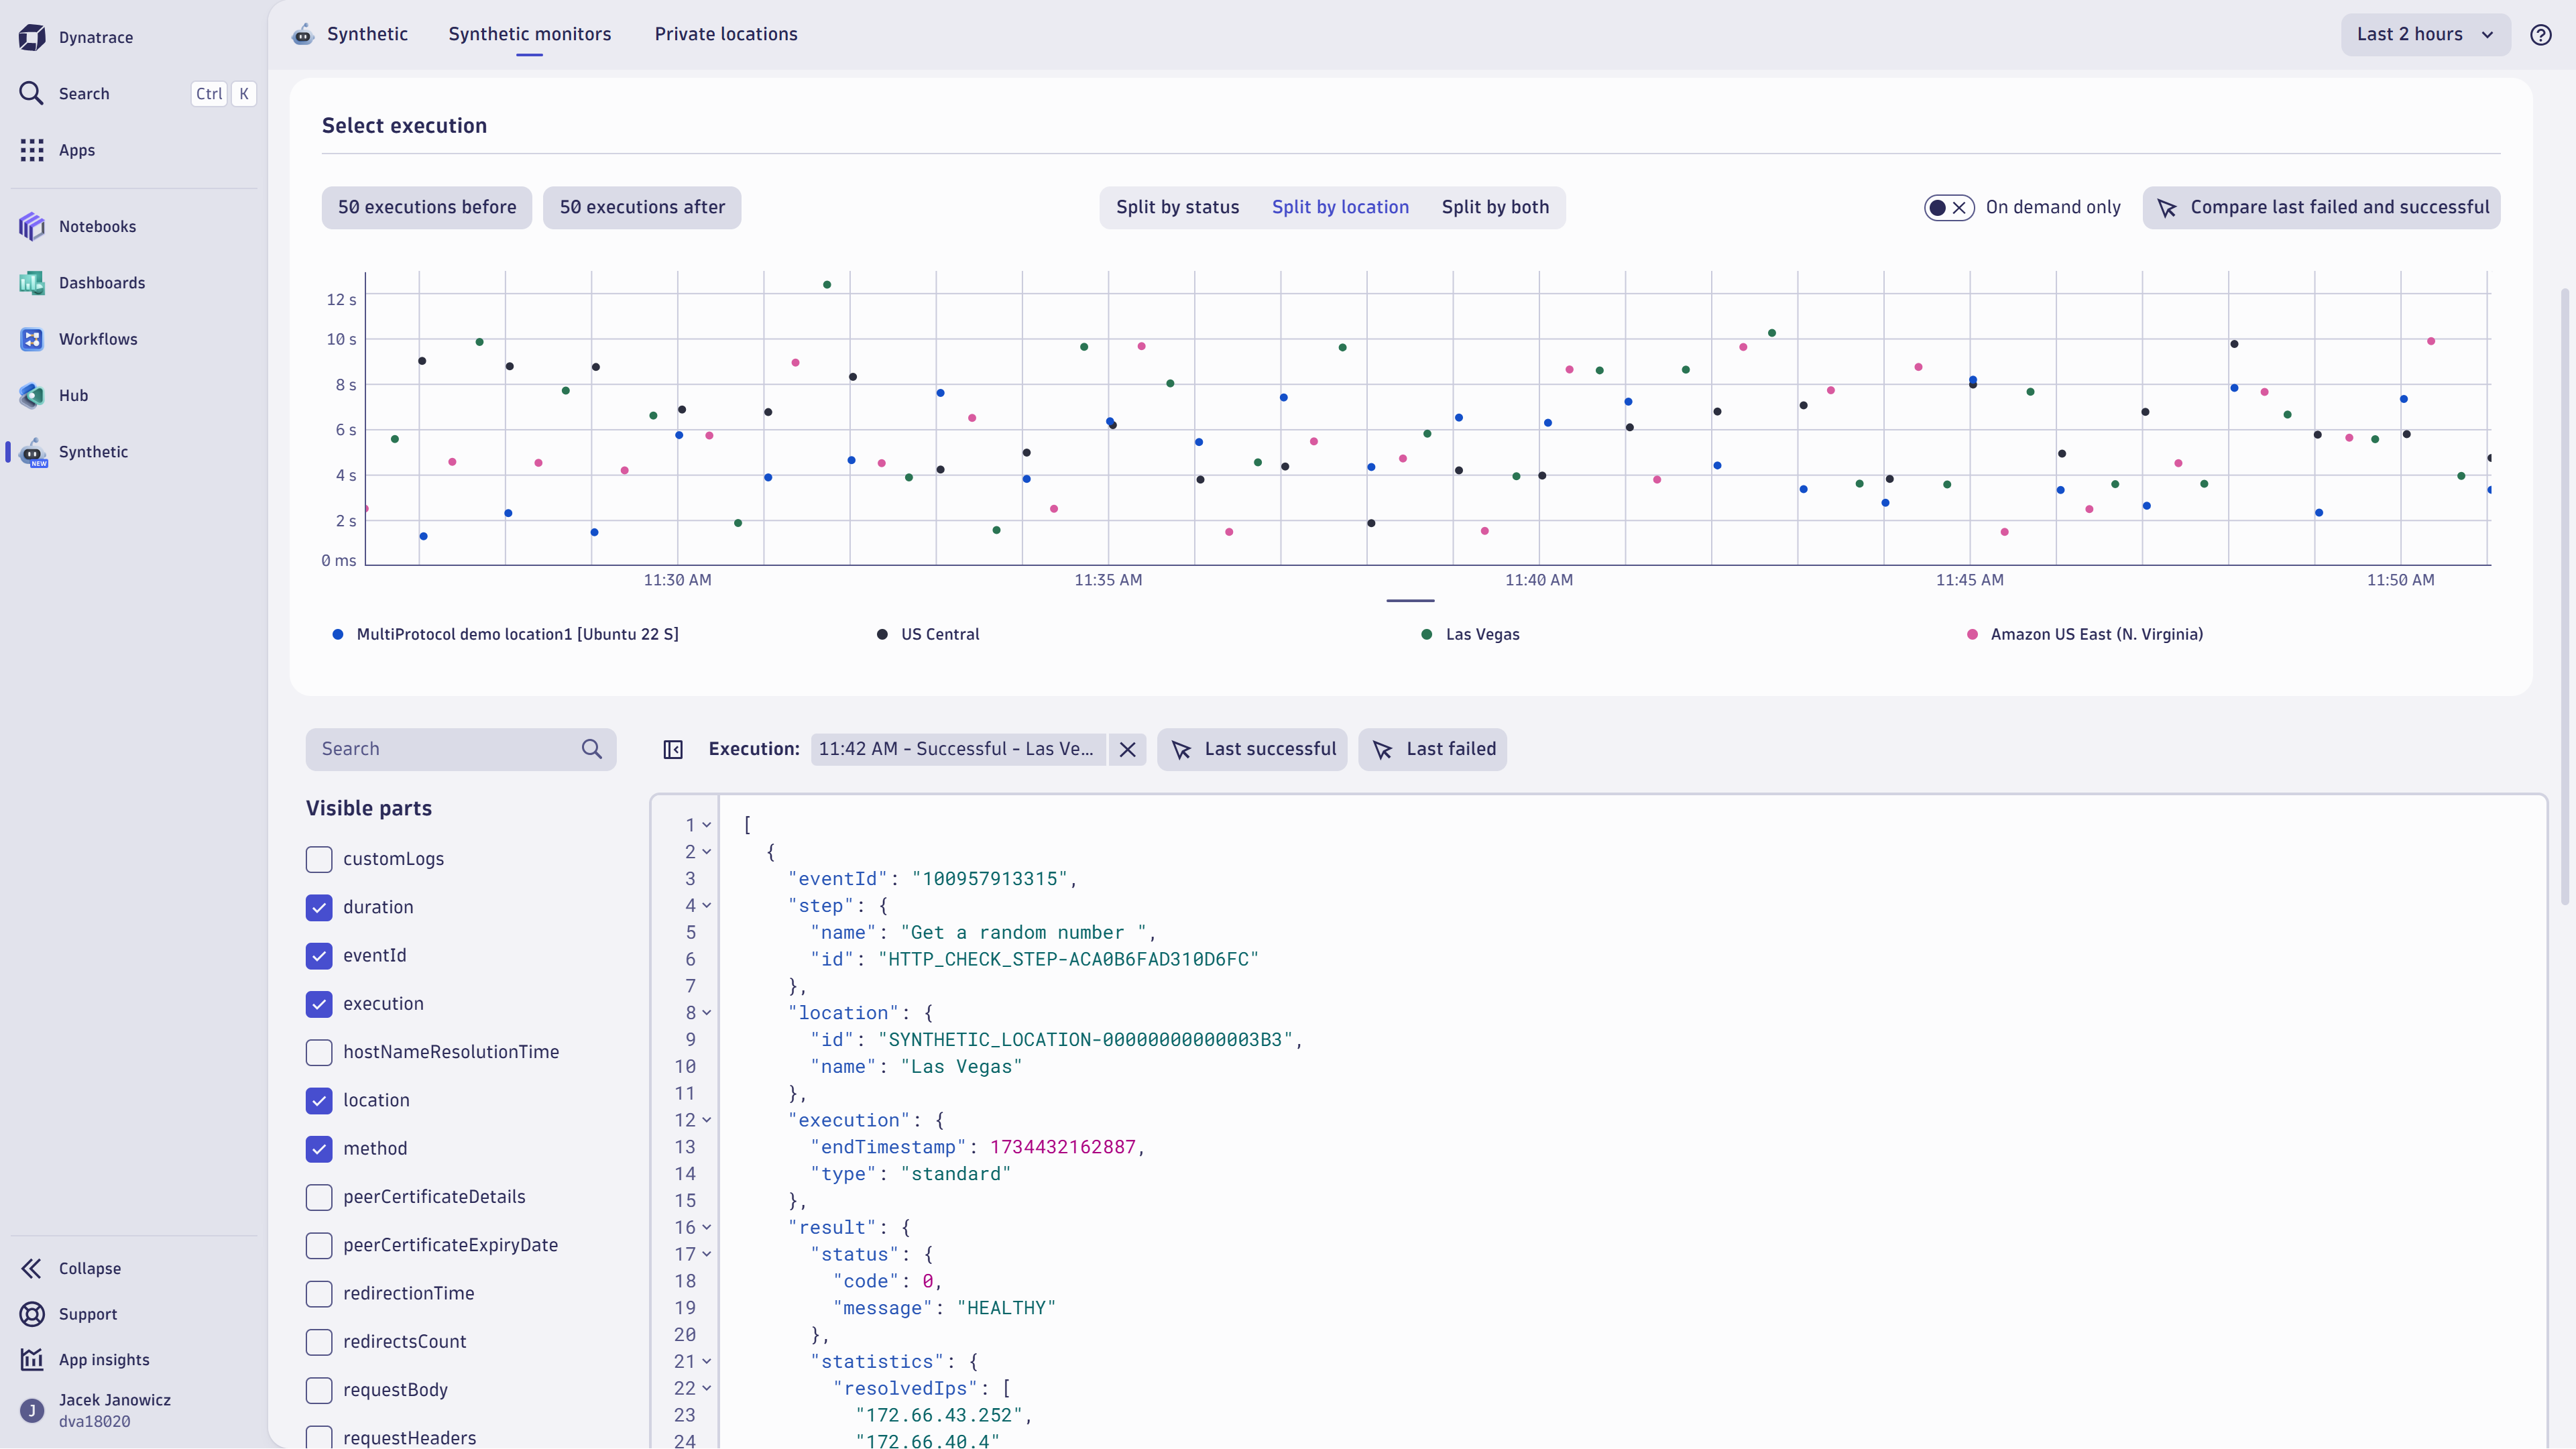
Your analysis might require comparing the details of two executions, for example, a current failing execution and a historical one when the test passed. Or perhaps you need to compare two failing executions, as the details of the first failure (for example, what happened overnight) might provide additional input for your analysis. With the new Dynatrace Synthetic application, you can select any two executions for comparison.
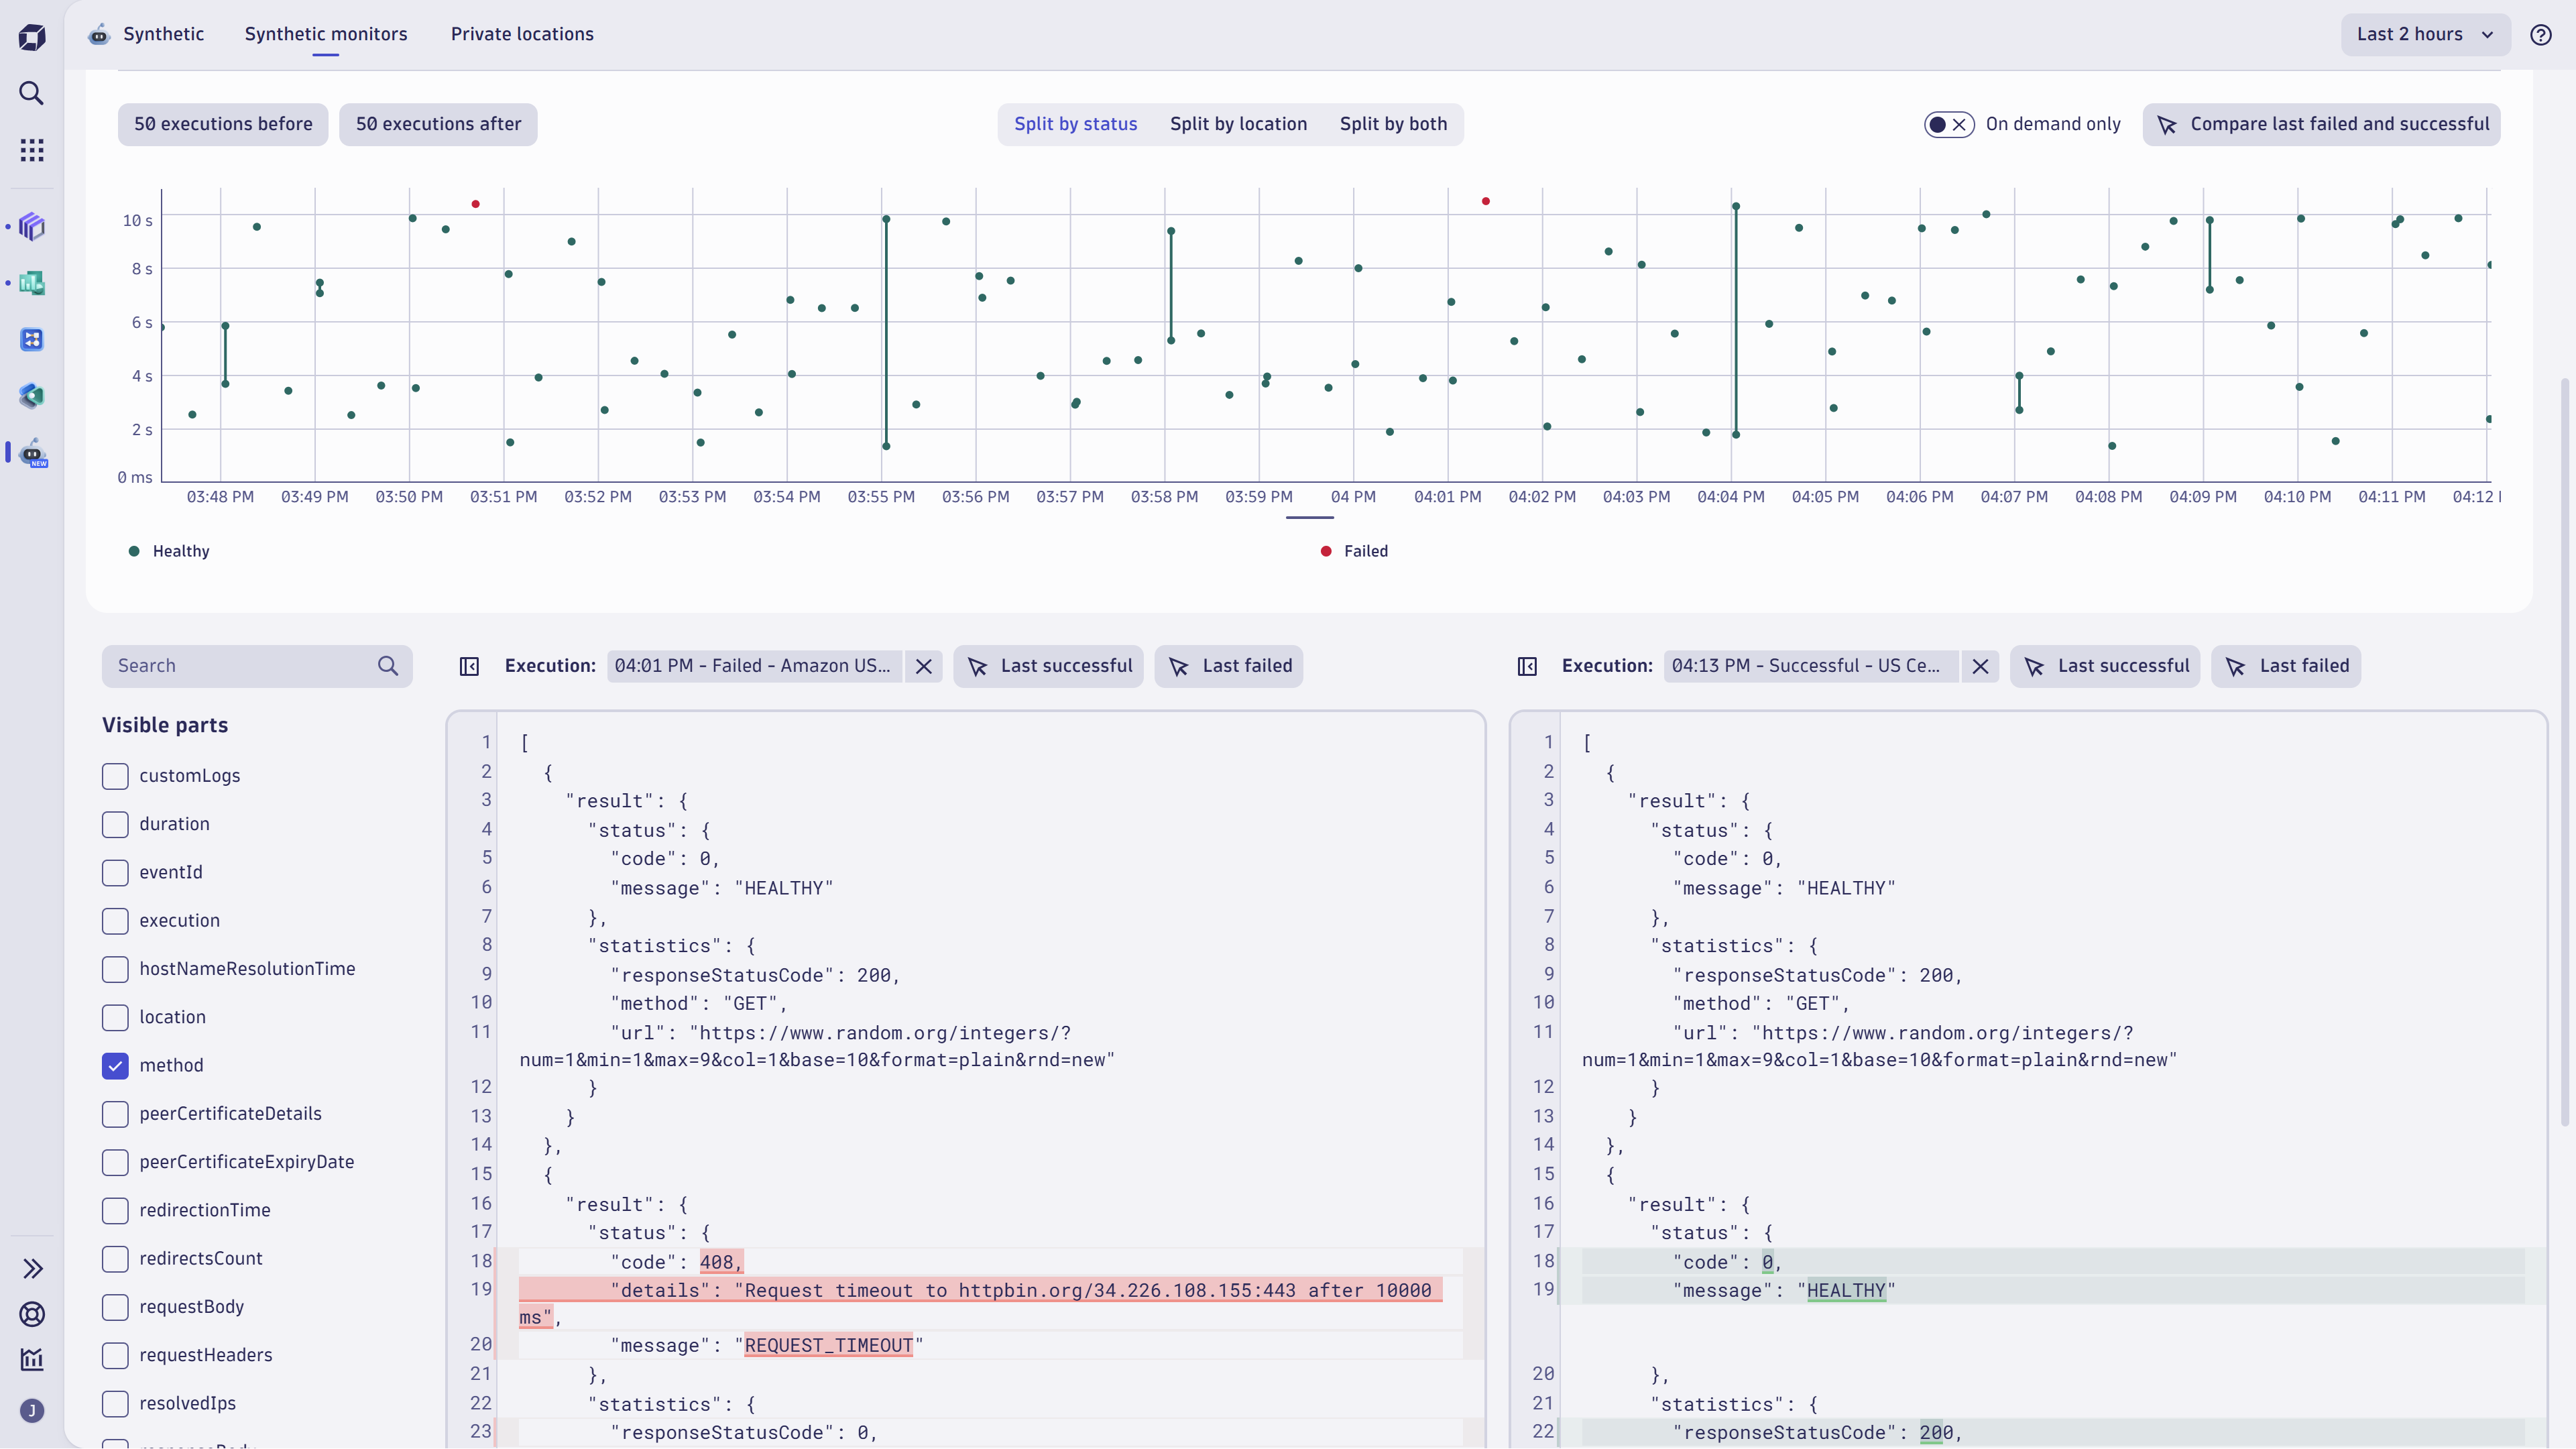
The Dynatrace platform supports your analysis
The benefits of HTTP monitors on the latest Dynatrace platform are visible not only within the new Synthetic app. All metrics and events storing information about execution details are available for further exploratory analytics utilizing Dashboards, Notebooks, or Davis® CoPilot. This provides nearly endless possibilities for building customized reporting tailored exactly to your needs.
“Data in Grail available with DQL look very powerful; the possibility of combining response payload with info on how much time it (monitor’s execution) took looks very useful“
– Tim Buedts, IT Reliability Engineer at Telenet group
Within the new Synthetic app, we provide you with a link to a Notebook you can use for further analysis. The Notebook contains three predefined queries, which you can use to query events stored in HTTP monitor results.
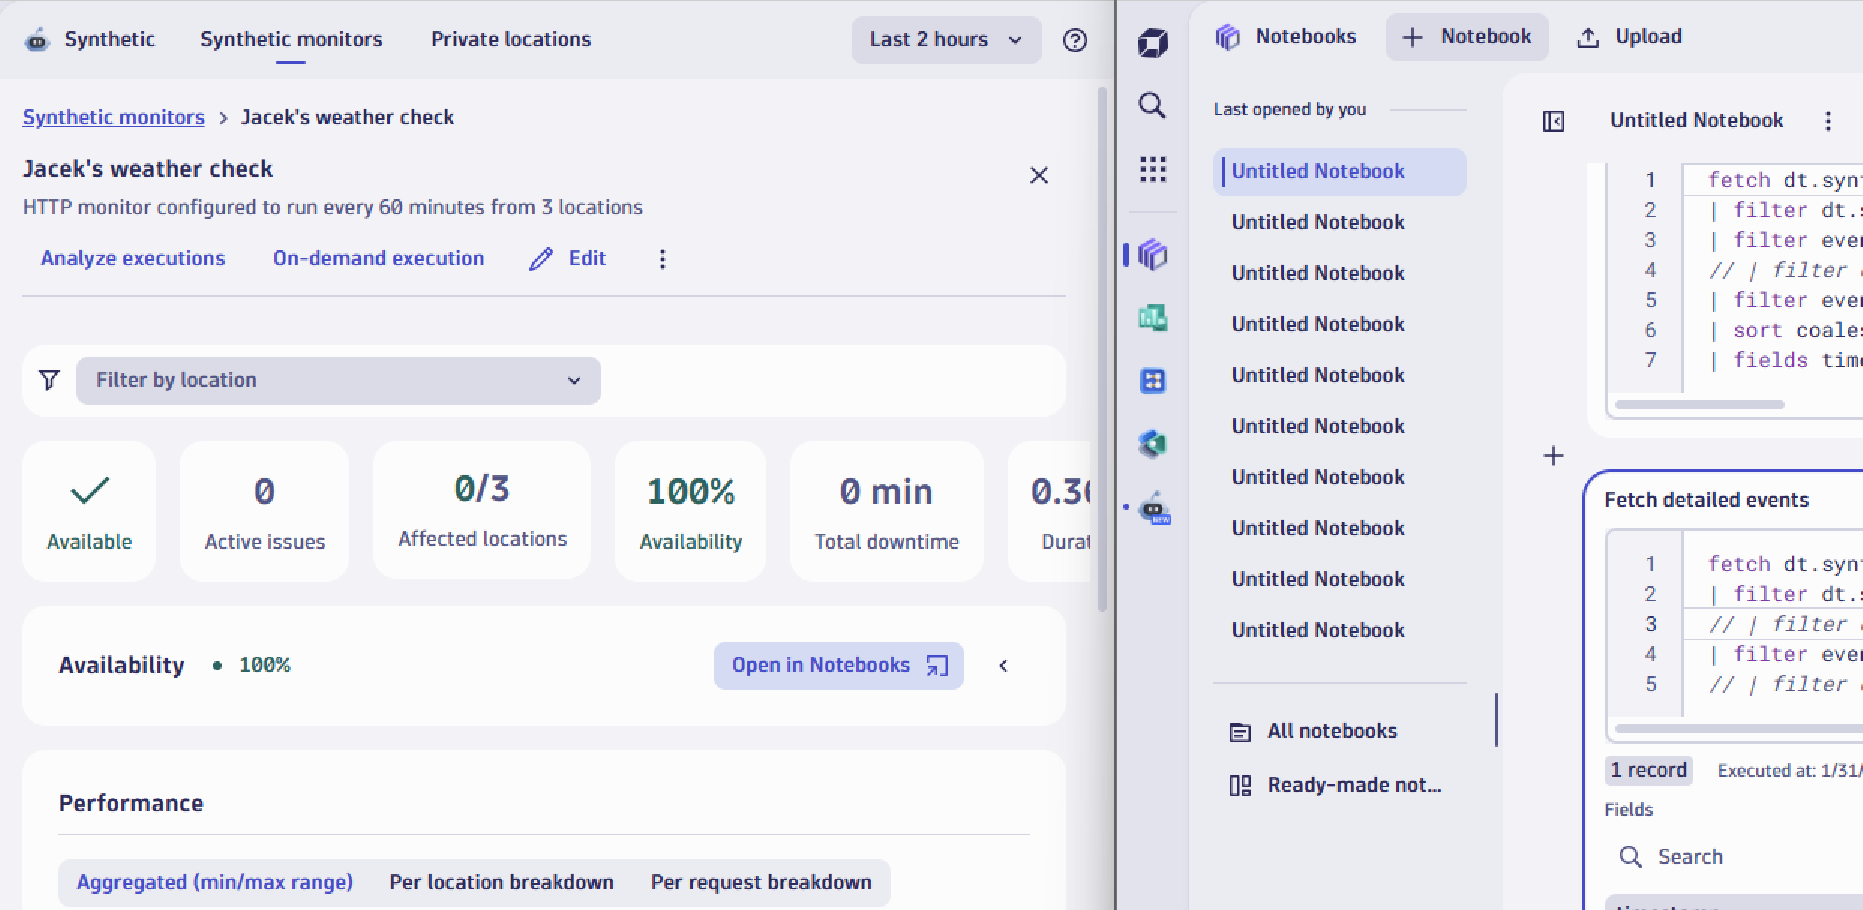
Let’s take a look at the three included queries:
Query 1: Get events with information about all executions of a selected monitor within a given time range
This query, the most basic of the three DQL queries, returns the list of all executions of a given monitor, which is identified by its unique ID (dt.synthetic.monitor.id). The fields clause identifies which fields should be shown as a query result. A filter for the location ID (filter dt.entity.synthetic_location), commented out by default, can be used to narrow down the results to only the executions from the selected location.
fetch dt.synthetic.events
| filter dt.synthetic.monitor.id  == "HTTP_CHECK-75952DA89EB1DB45"
| filter event.type == "http_monitor_execution"
| fields timestamp, result.status.message, result.statistics.duration, result.status.code, dt.entity.synthetic_location, execution.type, event.id
| sort timestamp desc
// | filter dt.entity.synthetic_location == "SYNTHETIC_LOCATION-0000000000000001"
Query 2: Get events with basic information about the results of each step within a selected monitor execution
The main difference with this query is the filter event.type == "http_step_execution" clause. This query returns basic information about all the steps of a single selected execution of the selected HTTP monitor. The execution is selected with the filter filter event.id == 100925201952 //event.id == execution id (Note that we’re using the ID from the latest execution as a default filter.)
fetch dt.synthetic.events
| filter dt.synthetic.monitor.id  == "HTTP_CHECK-75952DA89EB1DB45"
| filter event.type == "http_step_execution"
// | filter dt.entity.synthetic_location == "SYNTHETIC_LOCATION-0000000000000001"
| filter event.id == 100925201952 //event.id == execution id
| sort dt.synthetic.execution.end_timestamp desc
| fields timestamp, result.status.message, result.statistics.duration, result.statistics.connection_time, result.statistics.tls_handshake_time, result.status.code, result.statistics.time_to_first_byte, dt.entity.http_check_step
Query 3: Get events with full details describing a selected HTTP monitor execution
This query fetches data from different event type from dt.synthetic.detailed_events. It can be used to find detailed information about a selected monitor execution, which can be helpful during troubleshooting.
Commented-out clauses can be used to narrow the scope to a particular step of the executed monitor, and the step ID value (dt.synthetic.step.id) can be retrieved, for example, from the results of Query 2.
fetch dt.synthetic.detailed_events
| filter dt.synthetic.monitor.id  == "HTTP_CHECK-DD85DA9C14659614"
| filter event.id == 4184255792508795805 //event.id == execution id
// | filter dt.synthetic.step.id == "HTTP_CHECK_STEP-0000000000000000"
Synthetic results available in Grail also offer additional possibilities from a reporting and visualization perspective, combining various metrics and events on a single dashboard
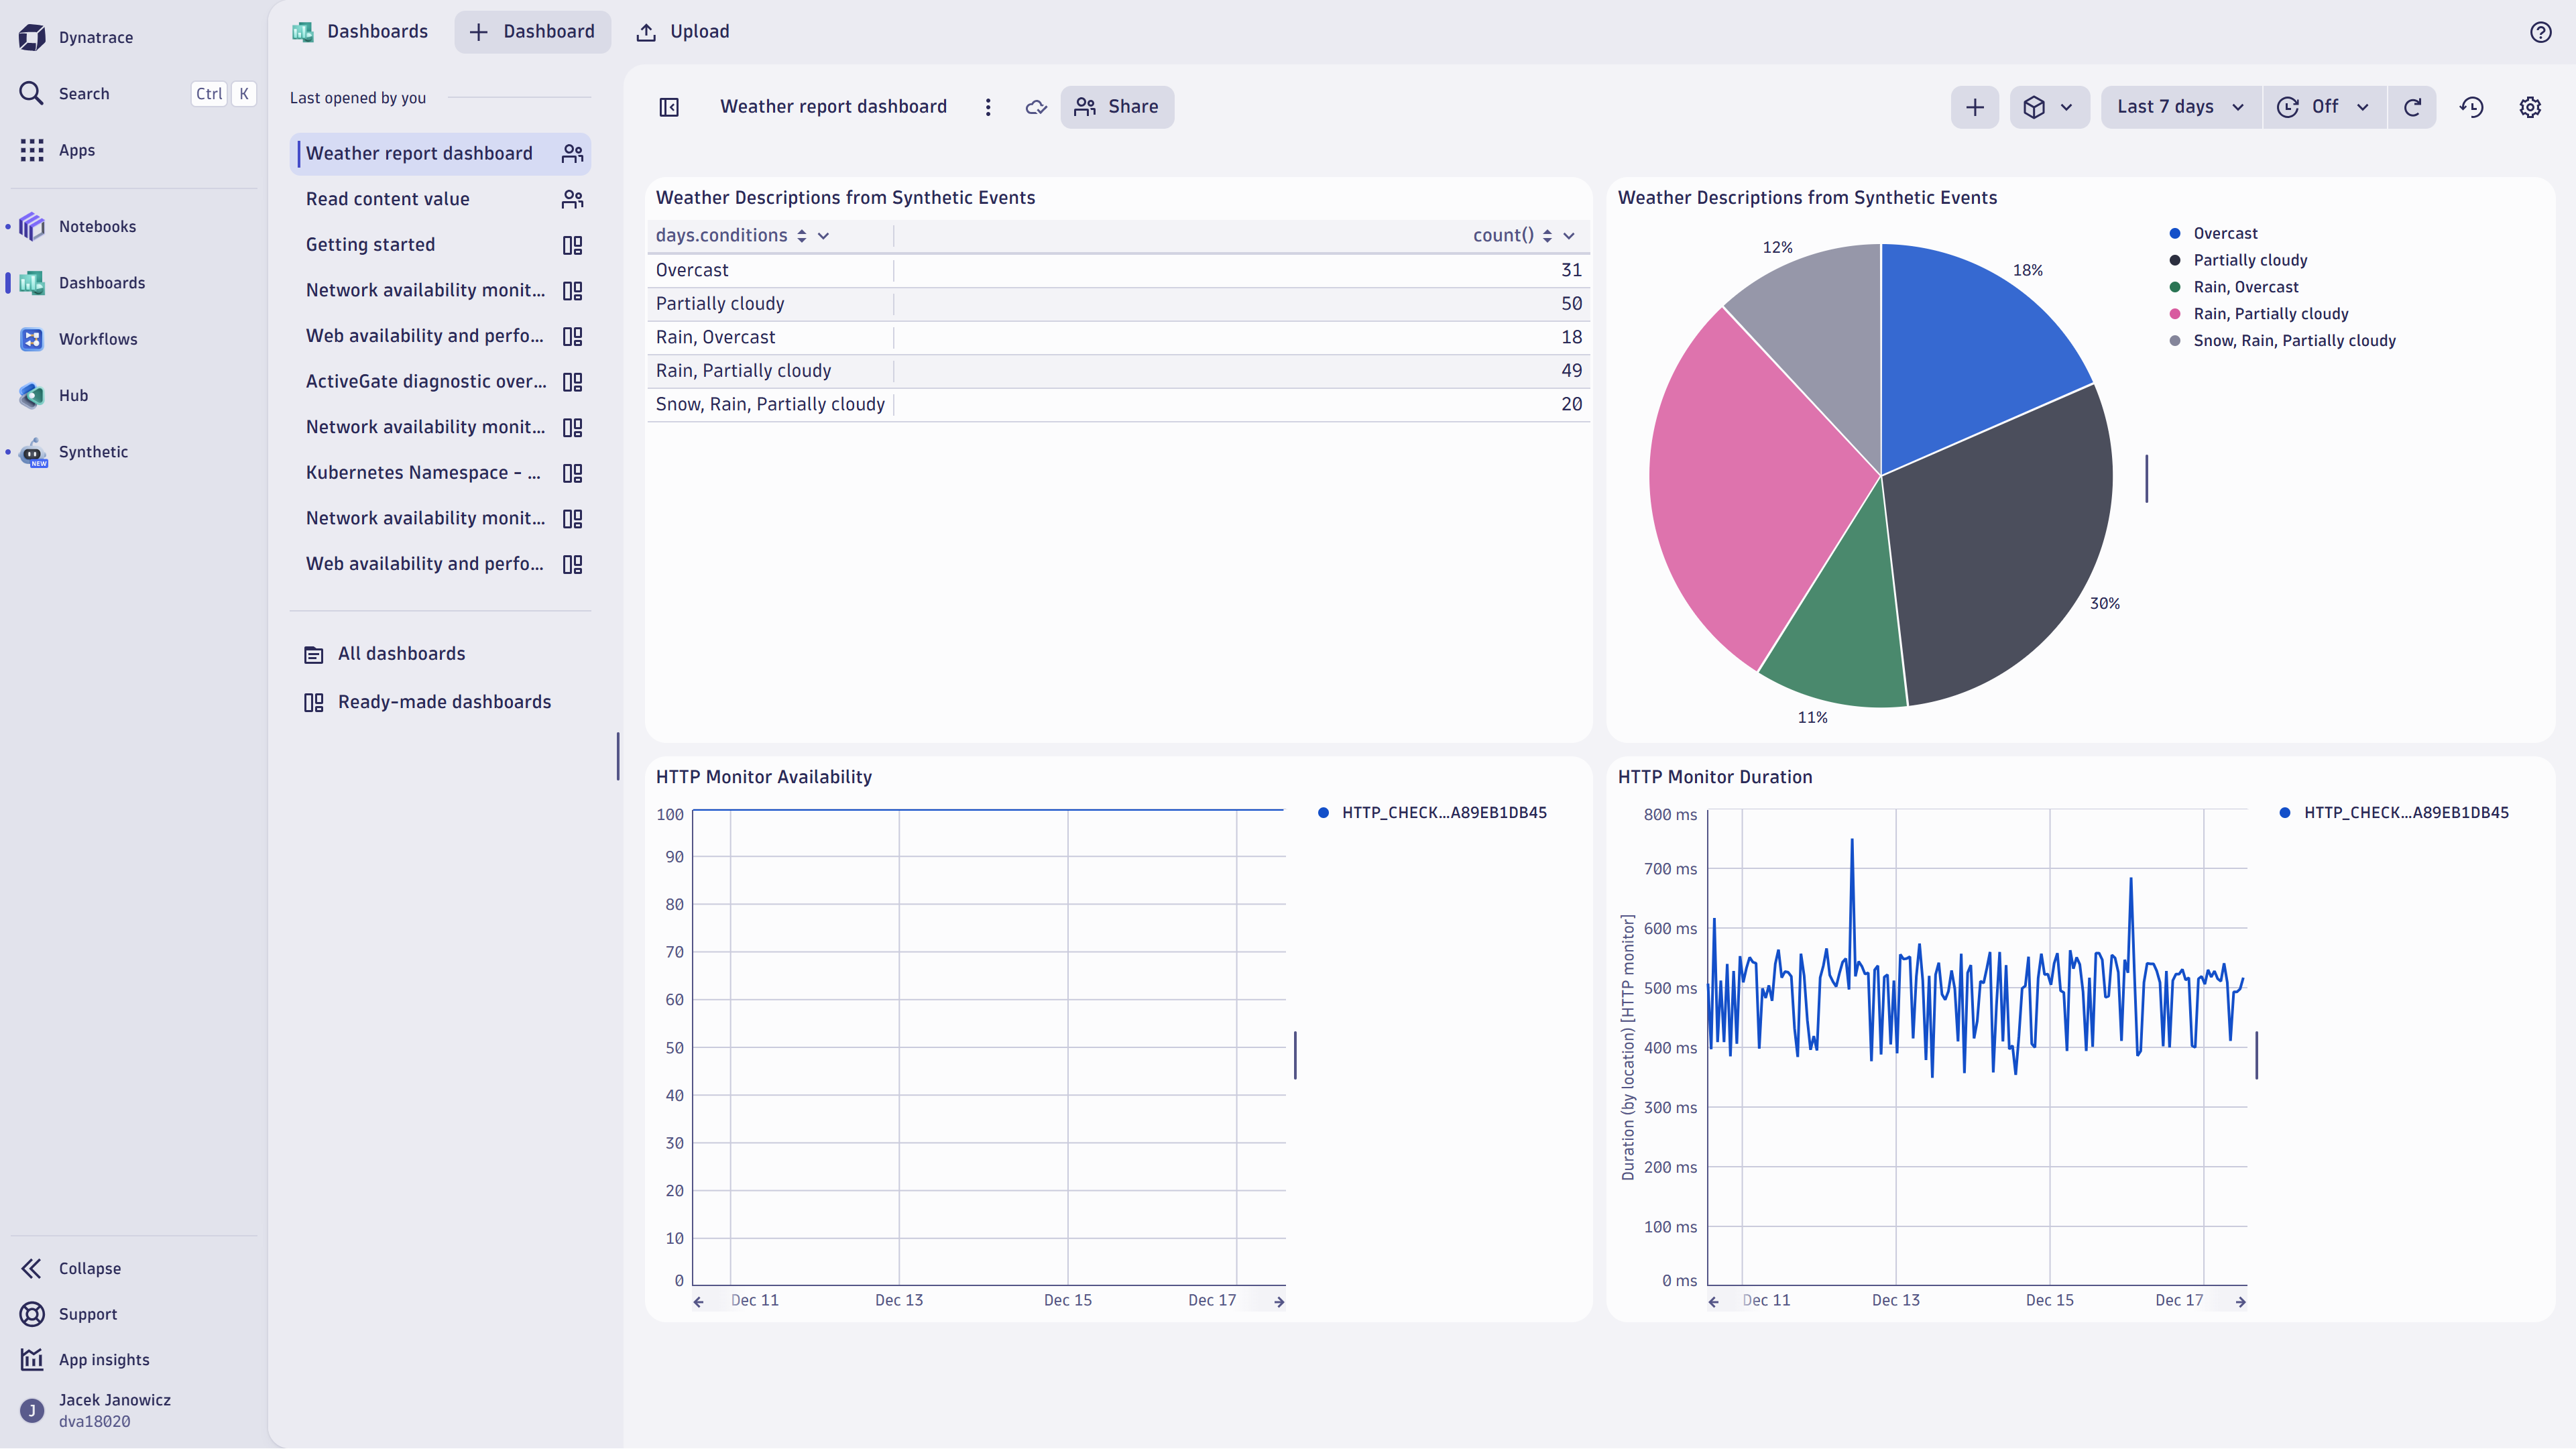
Look at the example dashboard in Figure 5, built on the results of a synthetic monitor that checks the health of a popular weather service. Apart from metrics indicating availability and service performance, we created a pie chart showing the forecast weather for Gdańsk, Poland. Input data for the chart was extracted from the payload of responses provided by the weather service.
“It is great to see those events also for historical executions. We’d like to use it for our dashboards.”
— Engineer from a leading workforce solutions organization
The Dashboard presented above is an example of combining data retrieved with HTTP monitors execution within the response body (here, the information about the weather) with metrics describing the health of the service used for retrieving that data (in this case, availability and duration reported by HTTP monitor)
Here’s an example DQL query illustrating how to use DQL language to retrieve data from events (containing, among other values, the response body)
fetch dt.synthetic.detailed_events | filter dt.synthetic.monitor.id == "HTTP_CHECK-75952DA89EB1DB45"
| fieldsAdd content = result.statistics.response_body
| parse content, "JSON:query"
| fields timestamp, dt.tenant.uuid, query
| fieldsFlatten query
| fieldsAdd days = query.days[0]
| fieldsFlatten days
| summarize count(), by:{days.conditions}
Content of the response body collected from all executions of the HTTP monitor is collected and parsed as JSON. Then, the number of executions that returned a forecast of a particular weather type (returned in days.condition field) is counted.
Discover what you can do with HTTP monitors on the latest Dynatrace platform
- Create your HTTP monitors with the new Synthetic application.
- Check the results of your new (and existing) HTTP monitors.
- Get familiar with the out-of-the-box synthetic dashboard delivered with the new Synthetic. app! Check out the new dashboard within the Dynatrace Playground environment.
- Use the power of DQL to query synthetic data and report it with Notebooks and Dashboards.
- Share your feedback with us using our Feedback channel in the Dynatrace Community.


Looking for answers?
Start a new discussion or ask for help in our Q&A forum.
Go to forum