Dynatrace helps cloud-native teams monitor, manage, and troubleshoot complex systems built on Kubernetes® and cloud technologies. With new bespoke apps for Ops and SRE teams, Dynatrace provides familiar experiences with capabilities beyond those offered by popular open-source solutions. Immediate observability insights into workloads and platforms without configuration are complemented with automatic security assessments and AI analytics for predictive operations.
The complexity of modern cloud-native environments is ever-increasing. The latest State of Observability 2024 report shows that 86% of interviewed technology leaders see an explosion of data beyond humans’ ability to manage it. On average, organizations have twelve different platforms and services embedded in their multicloud environments.
To avoid drowning in data, it’s critical to ensure that organizations can seamlessly collect data from any source in a single place and in context. Visualizing data in context while supporting and automating decisions with causal, predictive, and generative AI—all while providing a seamless experience—is where the future of cloud-native observability lies.
With new and updated experiences for Ops and SRE teams, proactively managing your cloud environments has never been easier.
Cloud-native observability for monitoring your cloud
OpenPipeline™ is the Dynatrace platform data-handling solution designed to seamlessly ingest and process data from any source, regardless of scale or format. With OpenPipeline, you can effortlessly collect data from Dynatrace OneAgent®, open-source collectors such as OpenTelemetry, or other third-party tools. OpenPipeline then filters and preprocesses the data.
OpenPipeline also incorporates data contextualization technology, enriching data with metadata and linking it to other relevant data sources. By contextualizing data, OpenPipeline enhances the Dynatrace platform’s ability to offer AI-driven insights, analytics, and automation across observability, security, software lifecycle, and business domains.
Furthermore, OpenPipeline is designed to collect and process data securely and in compliance with industry standards. It features high-performance filtering, masking, routing, and encryption capabilities that are easy to configure and operate.
In the latest enhancements of Dynatrace Log Management and Analytics, Dynatrace extends coverage for
- Native Syslog support: Use Dynatrace ActiveGate to automatically add context and optimize network traffic to your Syslog messages.
- Seamless integration with AWS Data Firehose: address high-impact issues quickly through real-time, high-frequency log analytics. Dynatrace support for AWS Data Firehose includes AWS Lambda logs, Amazon Virtual Private Cloud (VPC) flow logs, Amazon S3 logs, and Amazon CloudWatch.
- Kubernetes log monitoring with Fluent Bit
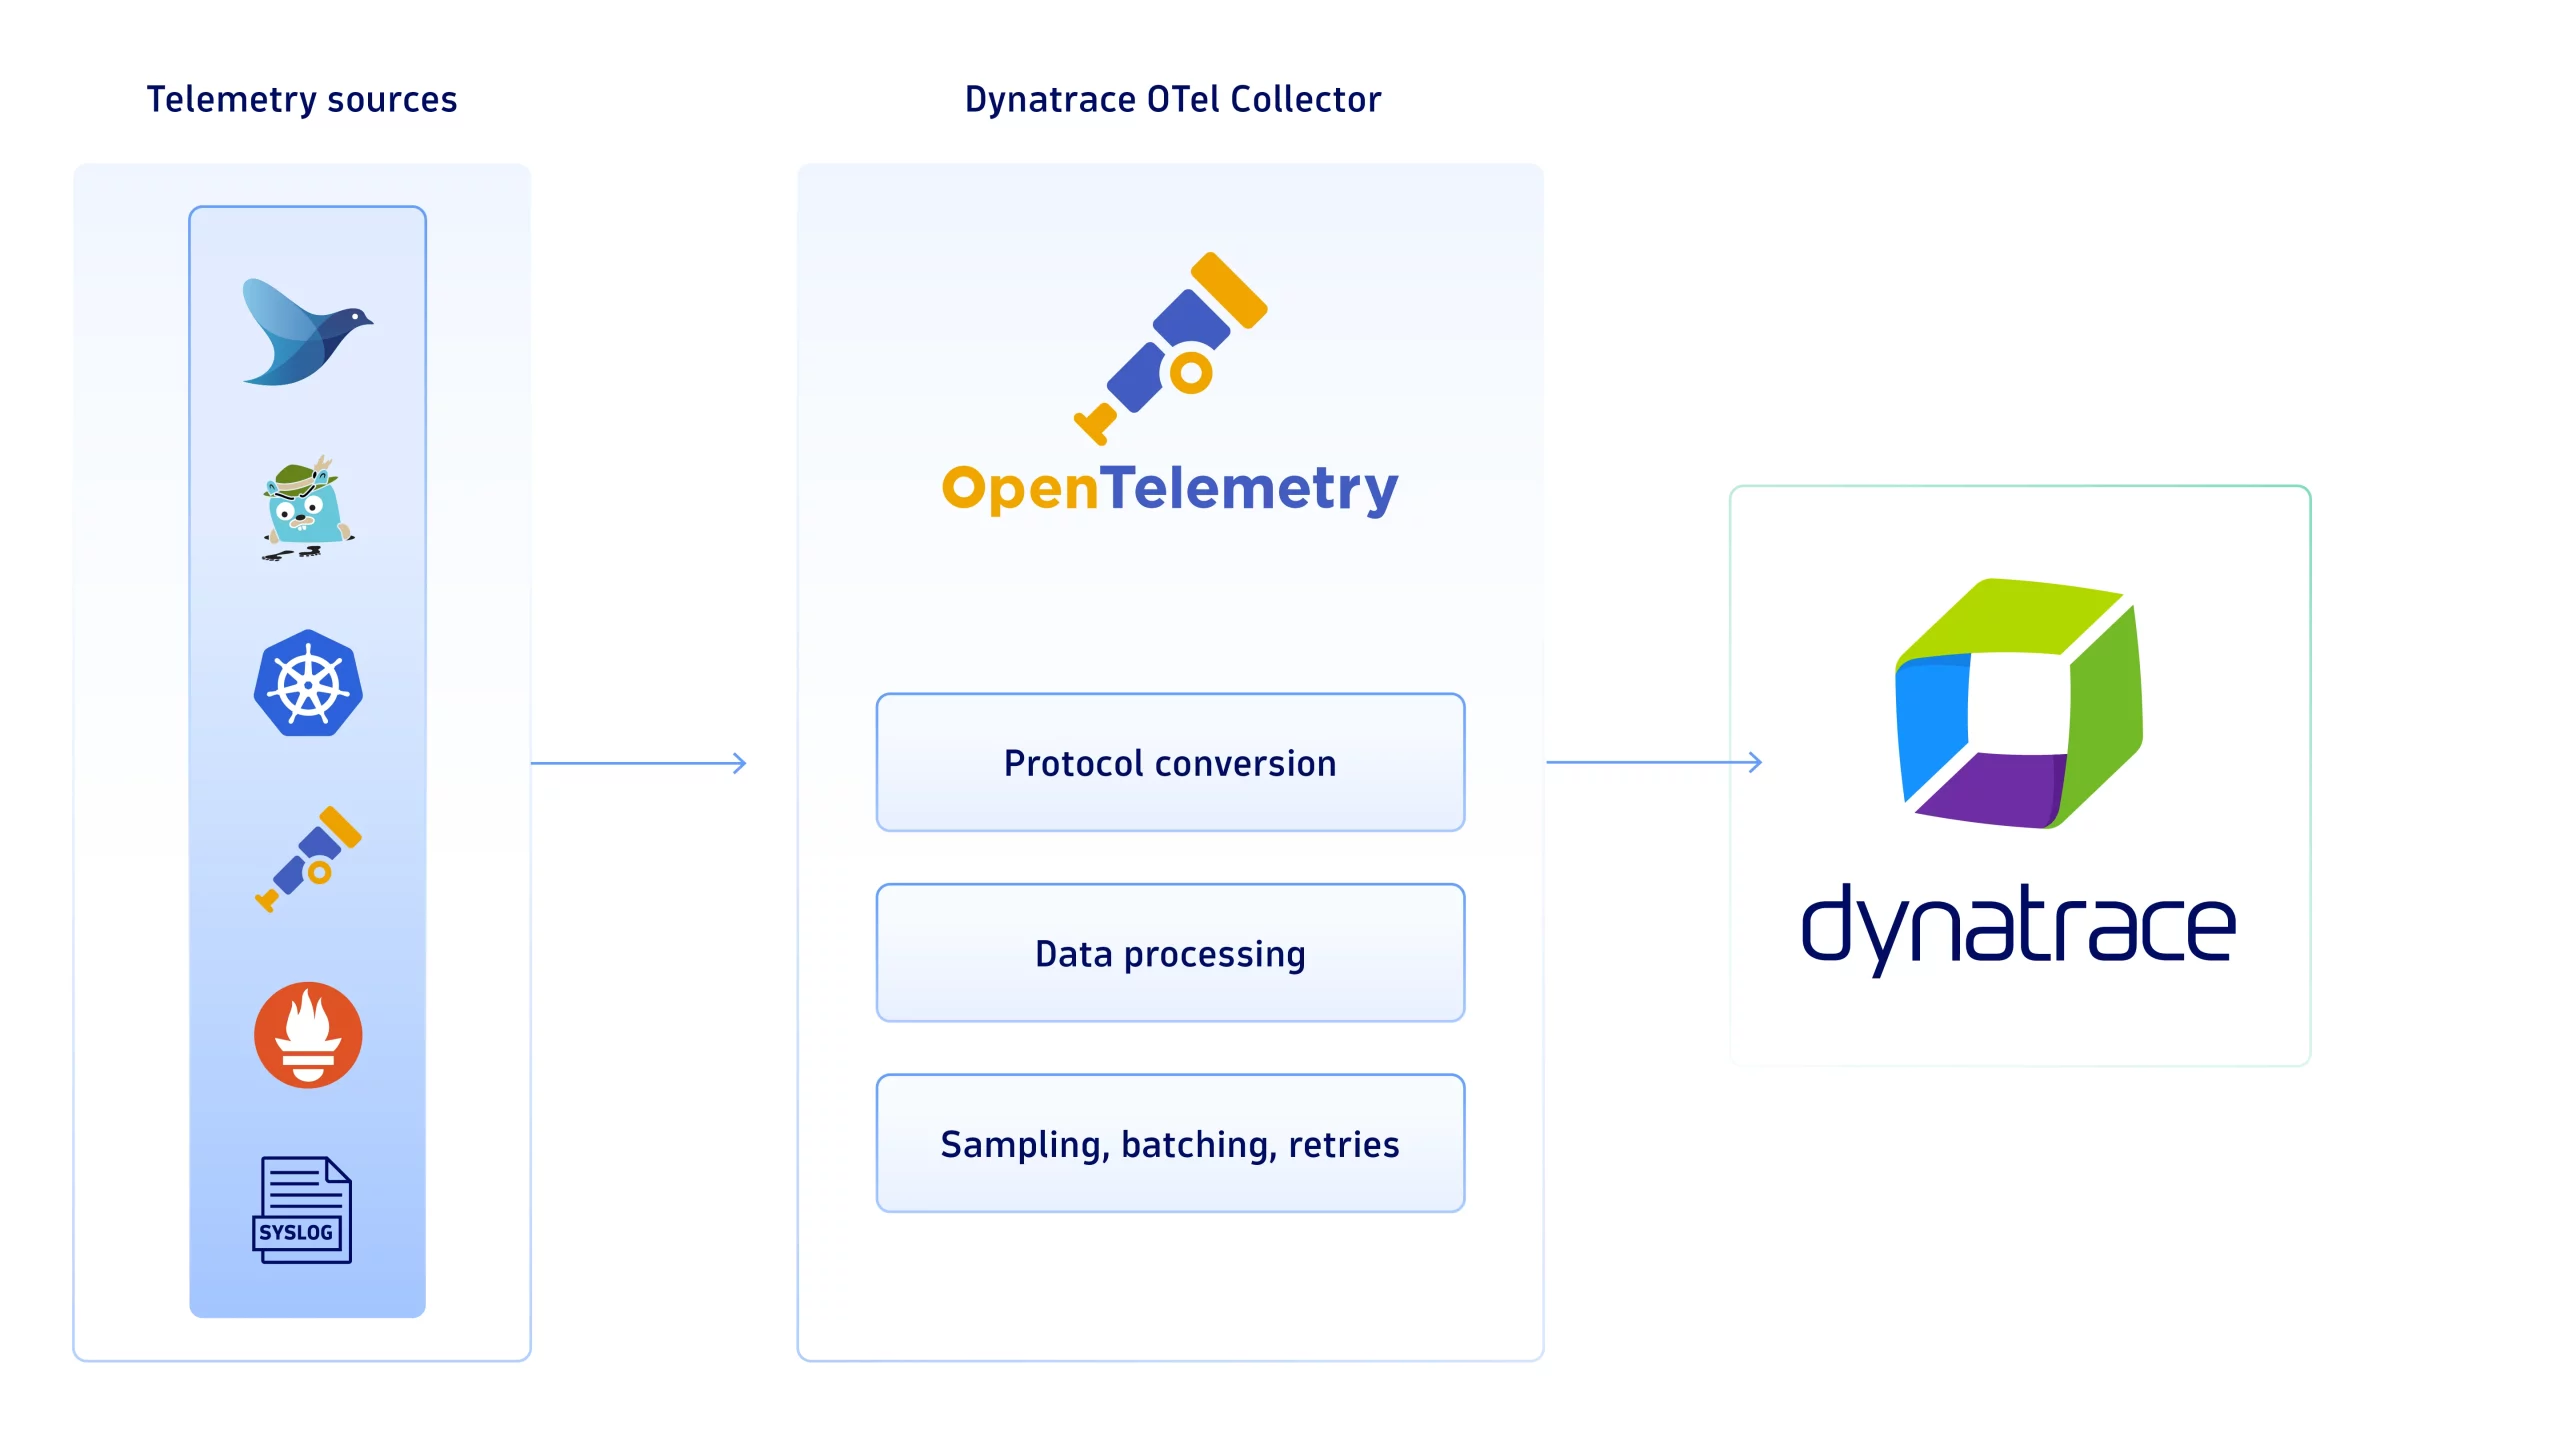
In an effort to further democratize data, Dynatrace provides a curated and supported OpenTelemetry collector. The Dynatrace Otel Collector includes collector components verified by Dynatrace for seamless operation. This removes the burden of manually validating each component and use case. The list of use cases is actively extended and includes batching and ingesting data from Syslog, Fluentd®, Jaeger™, Prometheus®, StatsD, and more.

Understand and secure your cloud
It’s critical to have easy and intuitive access to contextually relevant answers when working within complex cloud-native environments and the gold mine of information they provide. Dynatrace is essential for unlocking that gold mine of data, allowing you to enhance application performance, deliver better experiences, and optimize operational efficiency.
Kubernetes
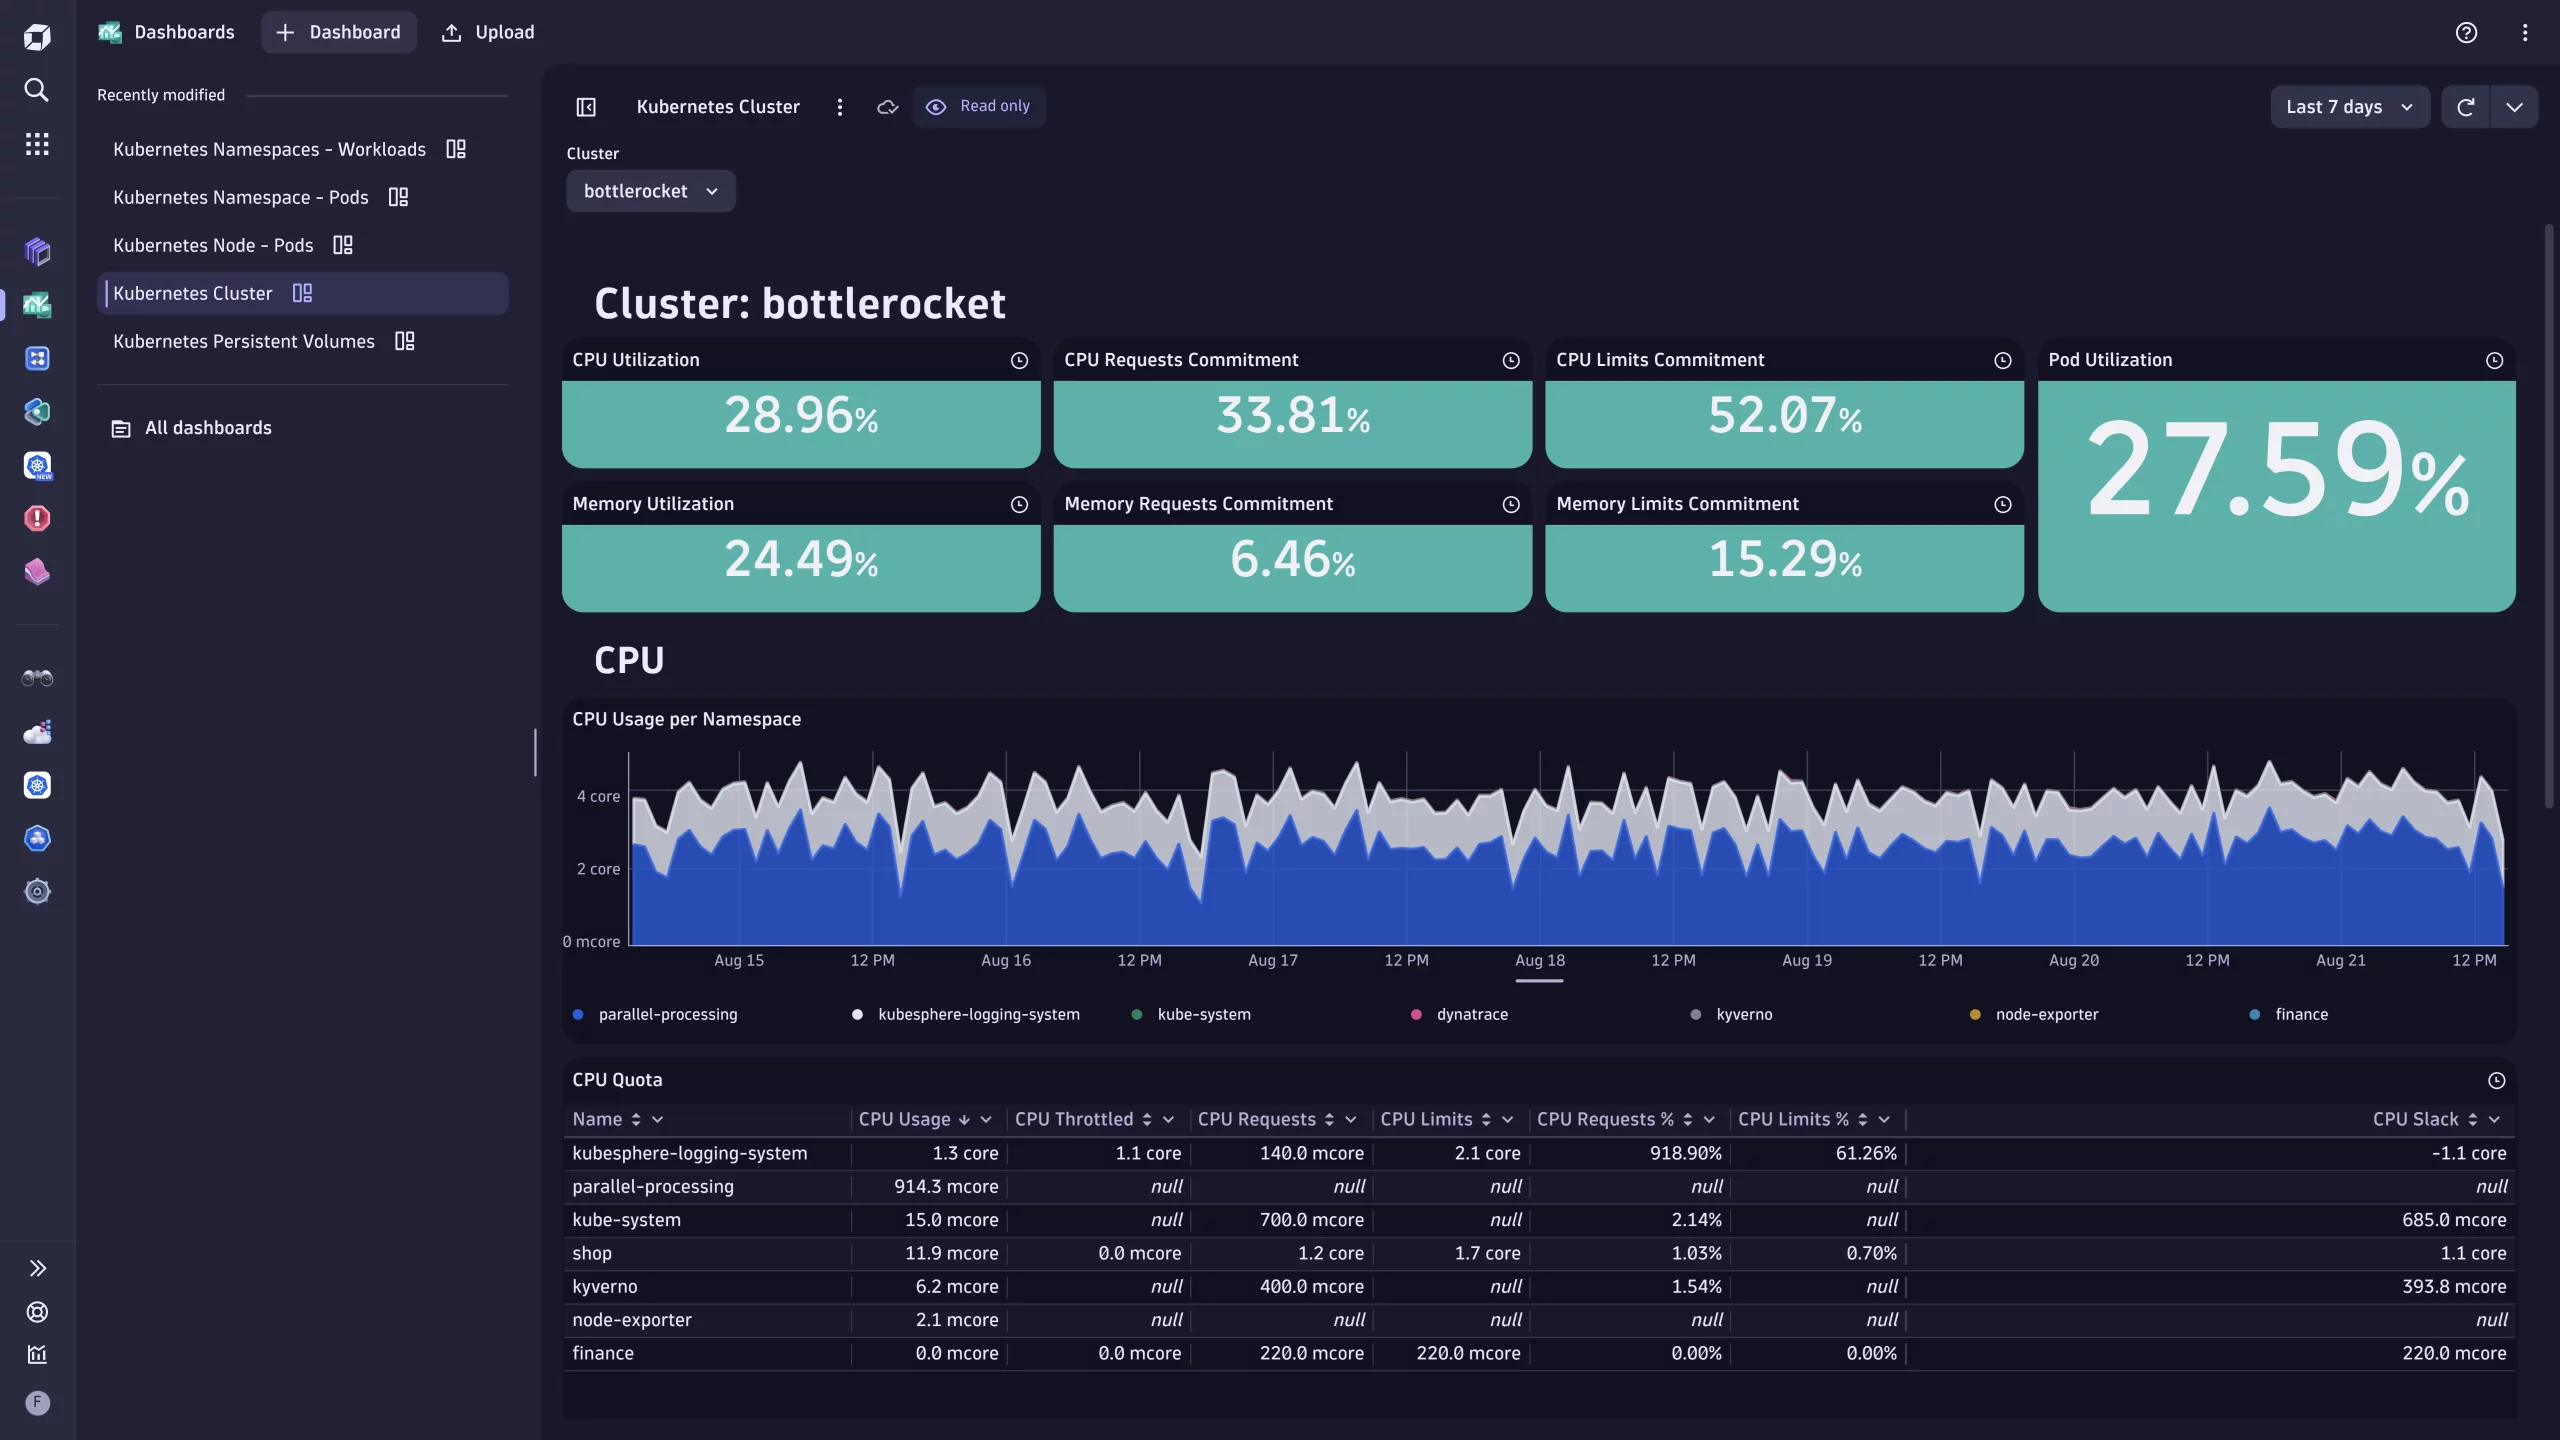
The Dynatrace Kubernetes experience for Site Reliability Engineers (SREs) and Platform Engineers focuses on providing insights into the health and performance of multicloud Kubernetes environments in the tailor-made Kubernetes app. Powered by Davis® AI, the Kubernetes app offers proactive monitoring and analysis, allowing automated monitoring and optimization of health and performance and providing simple and easy troubleshooting. In addition, ready-made dashboards are available for a quick and easy overview, allowing you to see the Kubernetes data you want alongside the cloud-native observability data you need, all in one place.

Clouds
Quickly onboard and manage cloud monitoring in one place across different cloud providers and observe multiple cloud environments, including their instances, resources, cost analysis, health, and optimization. Ingest data remotely through cloud integrations covering Amazon CloudWatch, Azure Monitor, Azure Liftr, and Google Cloud™ Kubernetes with GKE™ AutoPilot cluster.
Vulnerabilities
Prioritize and sort vulnerabilities based on Davis Security Score, detection time, or the number of affected entities. Quickly identify if public exploits, internet exposure, or reachable data assets are exposed. Get powerful insights into the true impact of vulnerabilities in your environment. The embedded Davis Security Advisor can help you enhance remediation for third-party vulnerabilities with AI-assisted and precise recommendations on remediation actions, allowing you to address several critical vulnerabilities simultaneously. Davis AI uses security intelligence and runtime context to determine risk and remediation based on criteria like internet exposure and access to sensitive data.

Service-Level Objectives
Measuring a system’s reliability can be complex and overwhelming. Indicators that provide insights into the environment’s health and performance vary across industries, products, and applications. Applying Service Level Objectives (SLO) to track these indicators is a common best practice within site reliability engineering. Still, an SLO’s quality lies in the significance of the underlying service-level indicator.
Dynatrace guides you in quickly setting up the most valuable SLOs—considering the typically used metrics but providing the freedom to use any data stored in Dynatrace Grail™ data lakehouse, such as logs and events.
It doesn’t matter if you need the typically used failure rate or response-time metrics to ensure your system’s availability and performance or if you need to rely on abnormal log drops to gain insights into raising problems—SLOs leveraged with Grail provide all the information you need.
Automate your cloud
Answer-driven Dynatrace Automation is further extended by providing direct interaction with your cloud and cloud-native ecosystem:
- Kubernetes: Read manifests, free up resources (for example, delete failed terminations), and restart deployments.
- AWS: Automate your AWS infrastructure with actions across EC2, S3, Lambda, and more.
- GitHub®: Integrate with your GitHub repositories. Automate issues and pull requests (for example, to change configuration files for sizing).
- GitLab™: Integrate with your GitLab projects. Automate issues and merge requests (for example, to change configuration files for sizing).
Example: Predictive auto-scaling for Kubernetes workloads
Kubernetes provides flexibility but also introduces complexity. For instance, manual scaling is time-consuming, reactive, and prone to errors. Using Dynatrace Automation and Davis AI helps you predict bottlenecks and automatically open pull requests to scale applications. This proactive, automated approach minimizes downtime, ensures your applications perform at their best, and helps optimize resource utilization and cost.
The Auto-Scaling tutorial provides a step-by-step guide to automatically scaling Kubernetes workloads up or down, horizontally or vertically.

Try out cloud-native observability yourself
Proactively manage your environments to increase performance and reduce cost. It’s never been easier to truly own your cloud!
The capabilities highlighted in this blog post will be available in Dynatrace SaaS environments in the coming weeks.


Looking for answers?
Start a new discussion or ask for help in our Q&A forum.
Go to forum