Having released this functionality in a Preview Release back in October 2019, we’re now happy to announce the General Availability of our SAP ABAP real user monitoring.
If you work with SAP ABAP, you may have noticed that finding information about SAP application and transaction performance involves scaling a high barrier to entry. While powerful, SAP performance management tools like the SAP Solution Manager are also complex.
So how are non-SAP Operations engineers to understand basic SAP performance counters and have a common platform for dialog with the SAP Basis team? These Ops engineers need shortcuts and normalization—just enough information to know if SAP is slow and if users are affected. If users are affected, in which transactions is this happening? How many users are affected? Which users, and on which systems?
We listened to our customers, and with our recent update, we’ve added real user visibility to our SAP ABAP monitoring extension.
Understand real user experience in your SAP ABAP system—SAP ECC and S/4HANA
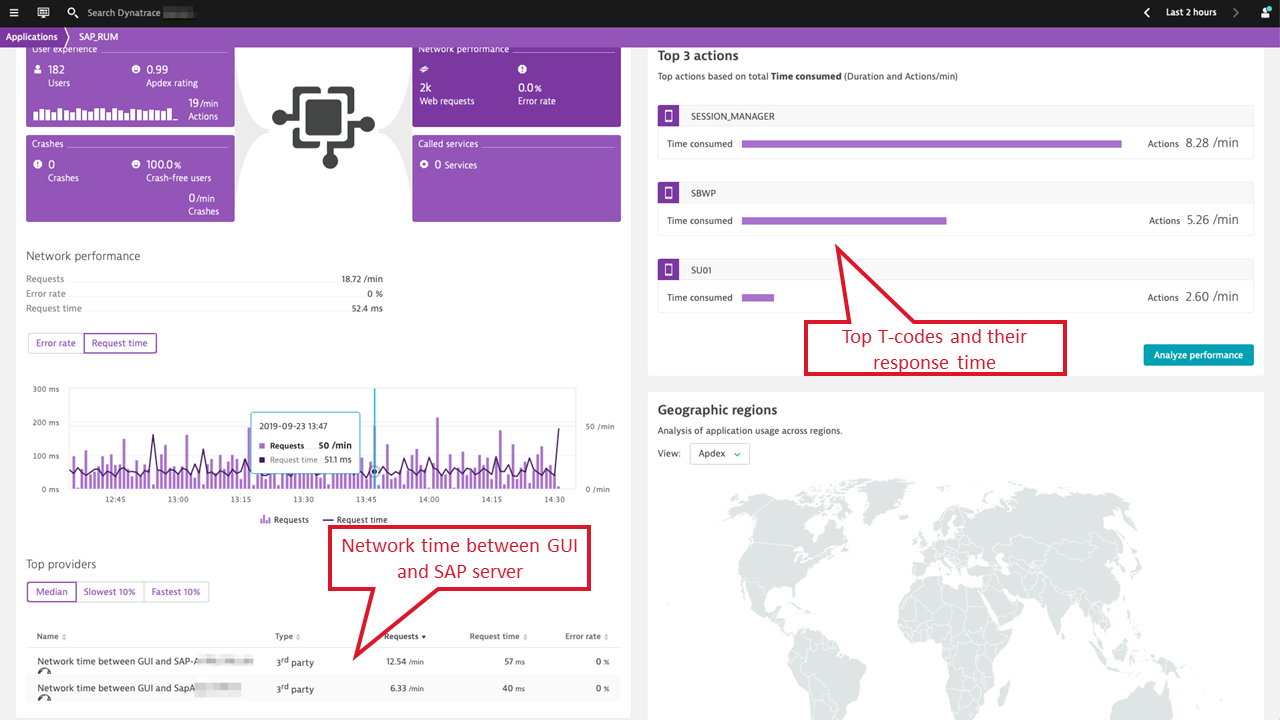
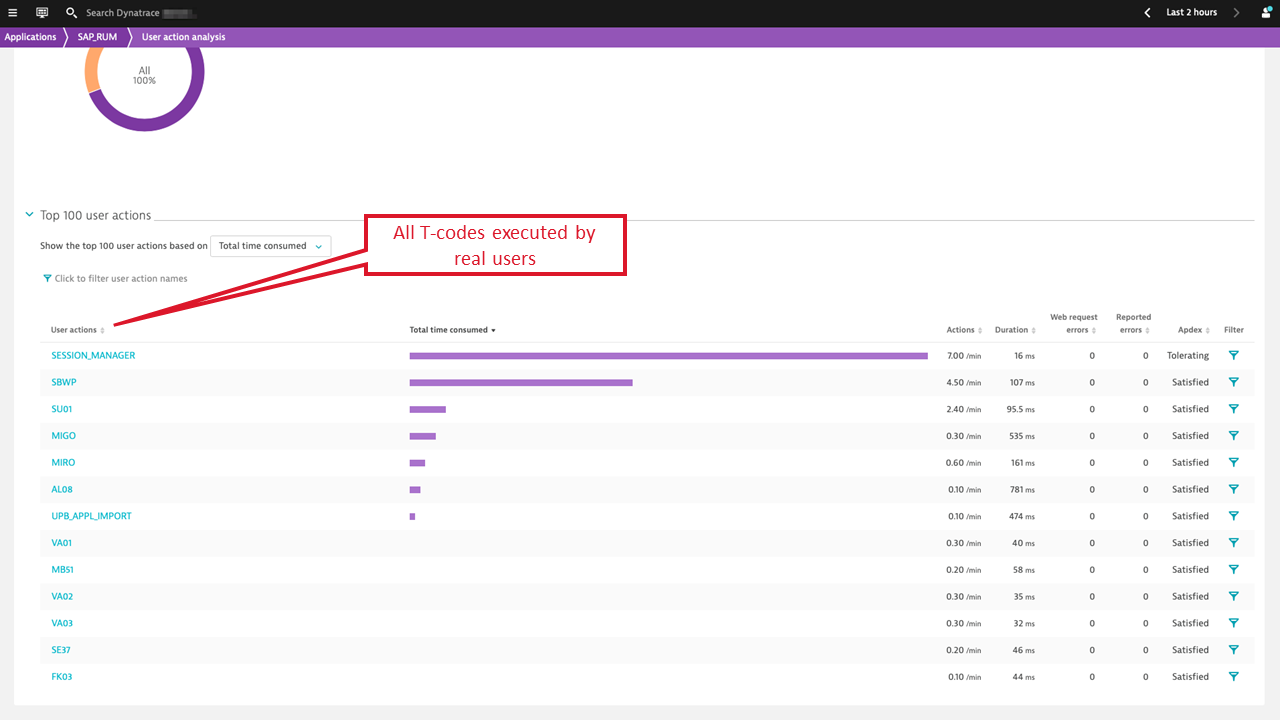
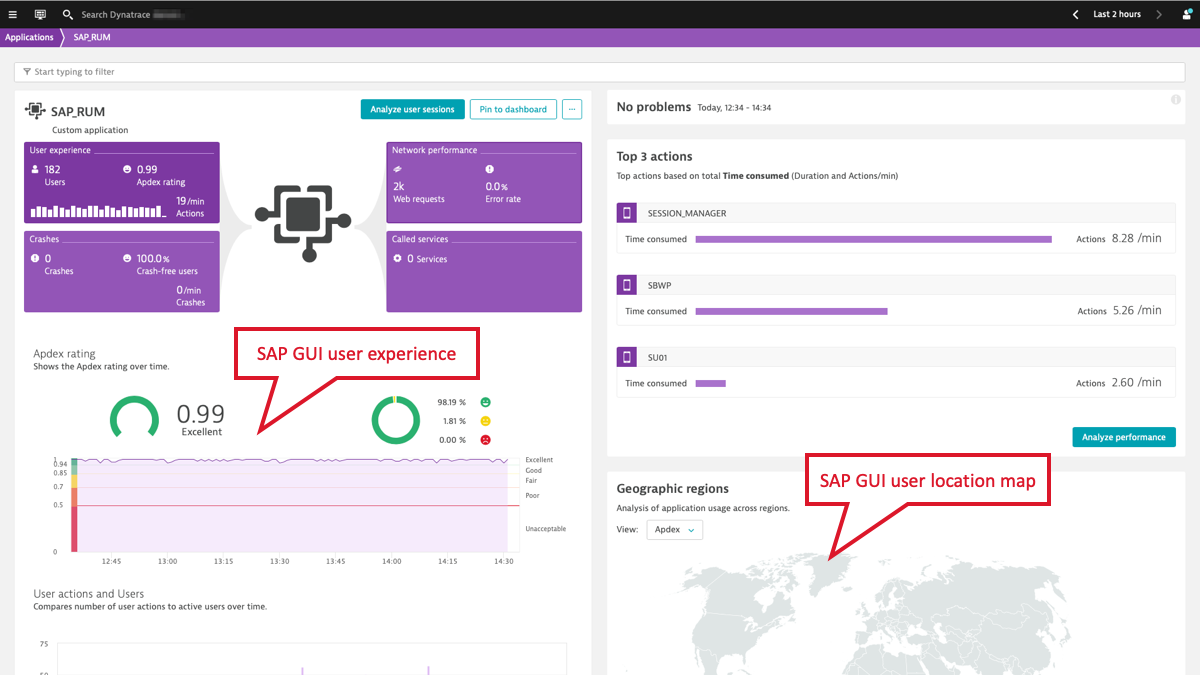
The Dynatrace SAP ABAP monitoring extension now gives you instant, easy-to-digest insights into how your SAP system’s performance is experienced by all users. We do this by reporting on every T-code execution of every SAP user (SAP T-code, or transaction code, is a shortcut key that provides direct access to the desired transaction from anywhere within the SAP system). The screenshot below shows an overview of SAP GUI user performance in Dynatrace.
This enables both your SAP Basis team and your Operations engineers to cooperate based on a common understanding of the issues at hand. Thus, performance incidents can be resolved more quickly, and future SAP infrastructure and system sizing can be aligned with real needs. This also helps the Operations teams that are tasked with SAP user performance problem triaging, which usually requires cross-disciplinary knowledge, ranging from network monitoring through infrastructure load and dependencies to SAP application and transaction specifics.
Create the best end-user experience with all your SAP ABAP applications, on SAP ECC and S/4HANA
- Assess problem impact and focus on the pressing issues first
Aggregated T-code scorecards give you immediate insights (for example, the slowest performing T-code) so you always know where to look first.
- Troubleshoot individual SAP GUI user sessions in detail
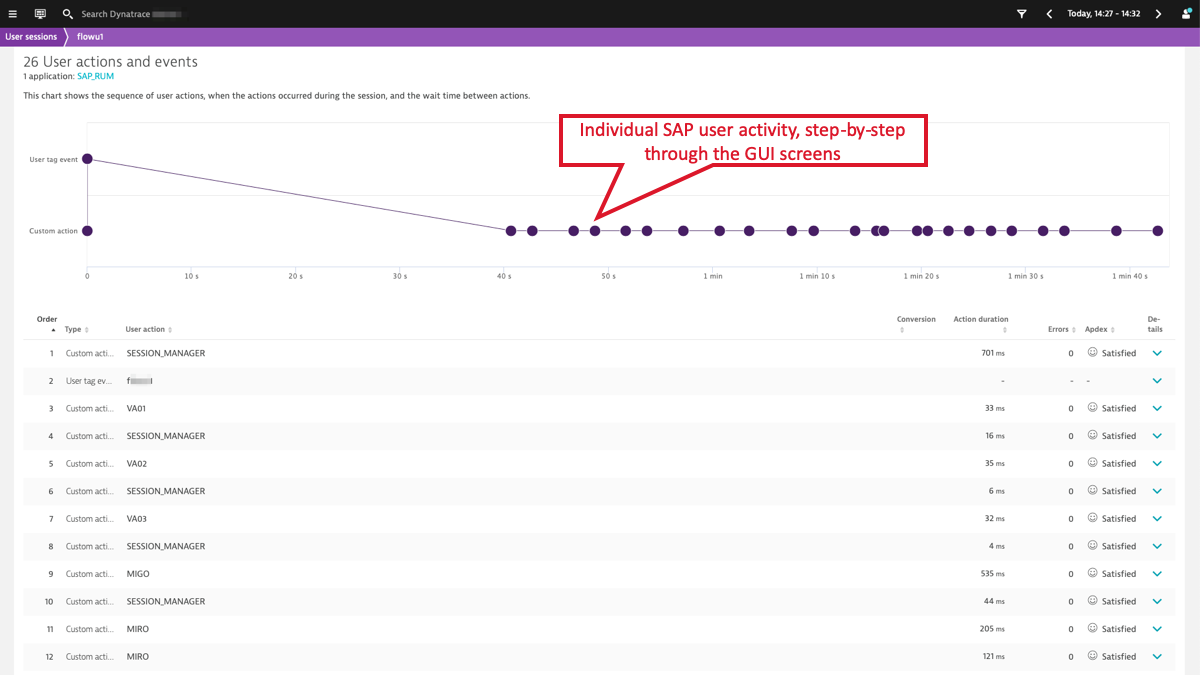
By understanding which T-codes were executed by a user, when they were executed, and what the response time was, you can troubleshoot each individual user session.
- Understand the root cause of the degraded GUI response time
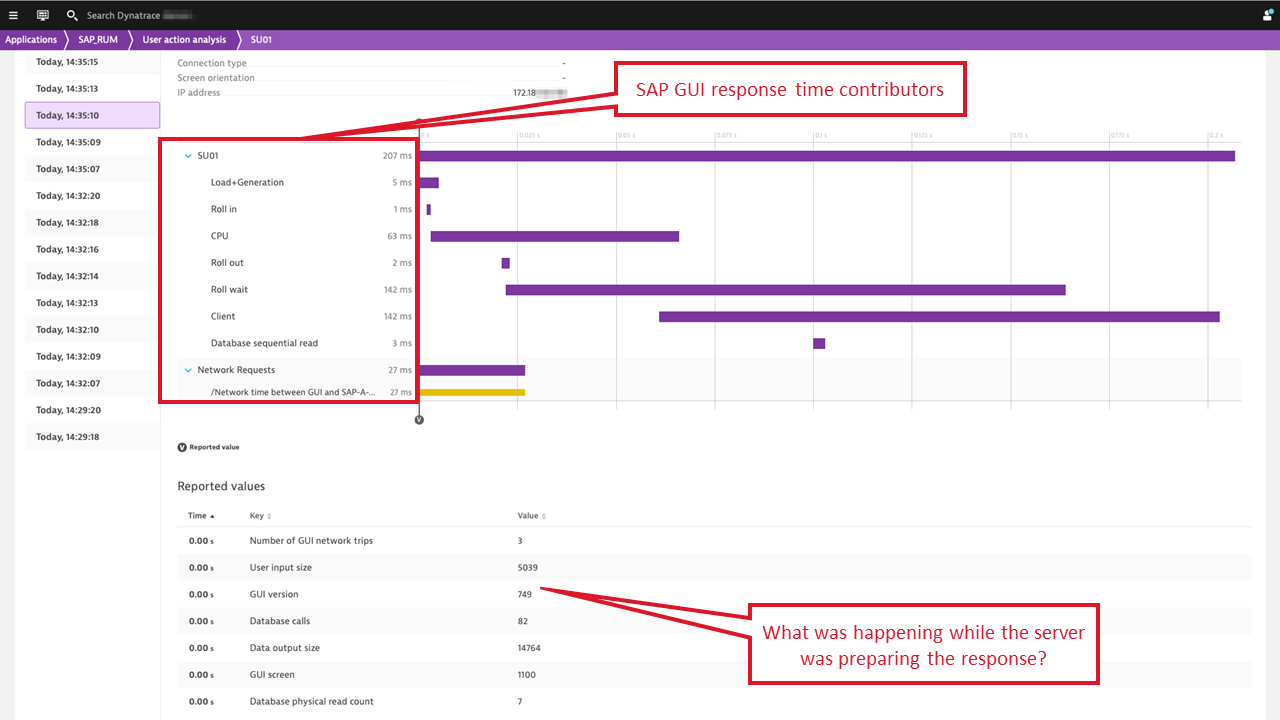
Was it the server, the network, or the database that caused the degraded response time? With Dynatrace, you get insights into the breakdown of response time for each individual T-code (time spent on CPU processing, in the database, in queues, on the network, and so on) so you immediately see where the root cause lies.
- Analyze how your users experience SAP GUI from various locations
Dynatrace recognizes each SAP GUI user and SAP system individually, by login name. With aggregated user experience metrics across user locations and SAP systems, you can analyze how your users experience SAP GUI performance at various locations.
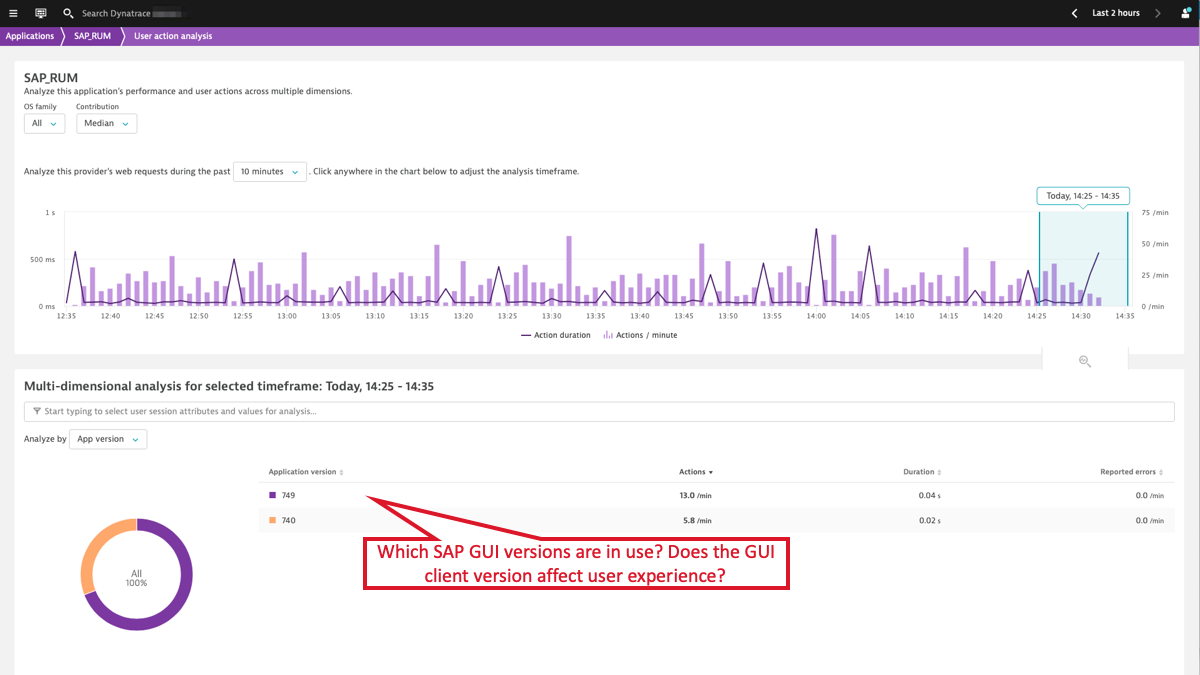
- Find out how client version affects user experience
User session and transaction execution attributes such as the GUI client version help you find out how client version affects user experience. The same applies to the number of network trips in a transaction, the data transferred, the number of database calls, or sequential reads.
- Create custom dashboards or ad hoc analyses of multidimensional problems, as you prefer
By running ad hoc and stored queries in the Dynatrace User Session Query Language (USQL), you can create any other aggregation of data that’s needed.
What you get
Non-intrusive SAP ABAP monitoring for SAP ECC and S/4HANA
Dynatrace SAP ABAP real user monitoring is non-intrusive and easy to set up. Our customers have been setting up our SAP ABAP monitoring extension for RUM by themselves in just a few minutes after downloading the instructions. See for yourself how easily you can deploy the SAP ActiveGate extension with Dynatrace.
SAP GUI user experience KPIs out of the box
Dynatrace provides immediate access to key performance indicators of SAP GUI user experience without the need to instrument SAP servers or understand SAP ABAP runtime intricacies.
Just the data you need to collaborate efficiently
Dynatrace gathers a minimal viable set of data required to triage and size SAP performance challenges. But we leave the transaction tracing in ABAP code to SolMan (that is, the SAP Basis team) who are the subject matter experts and use expert tools.
What if I use Citrix to deliver SAP GUI?
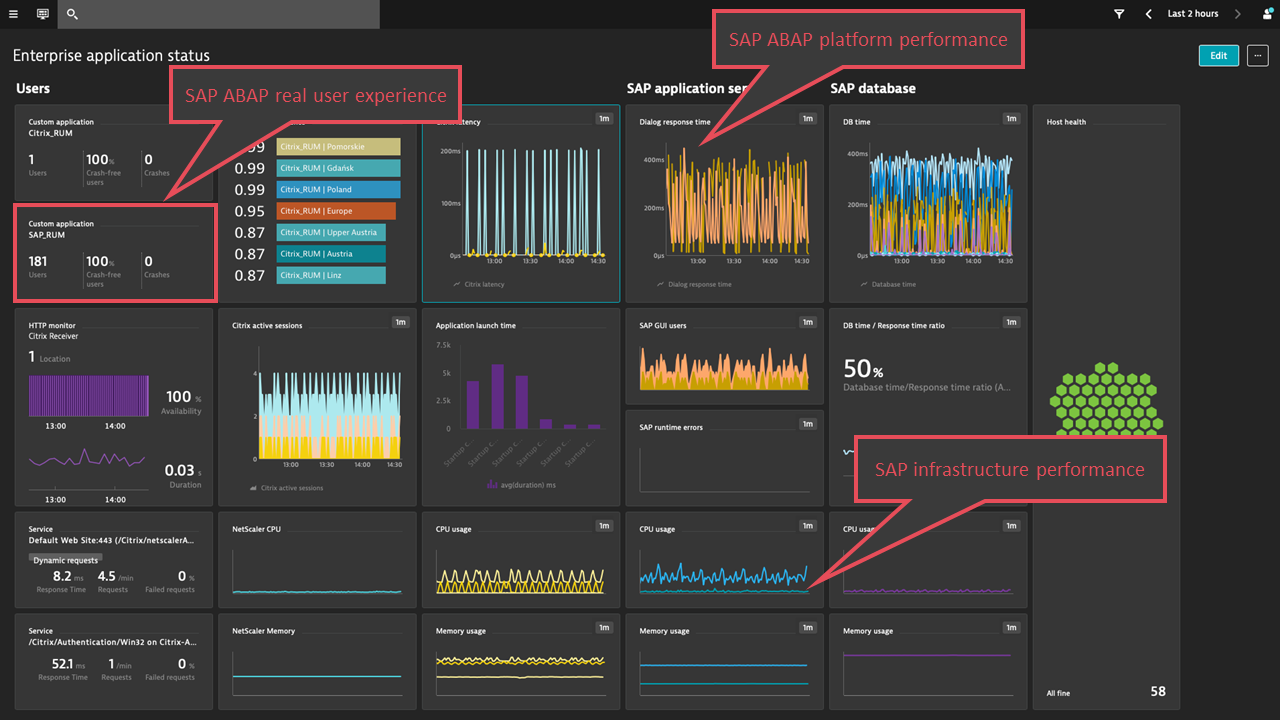
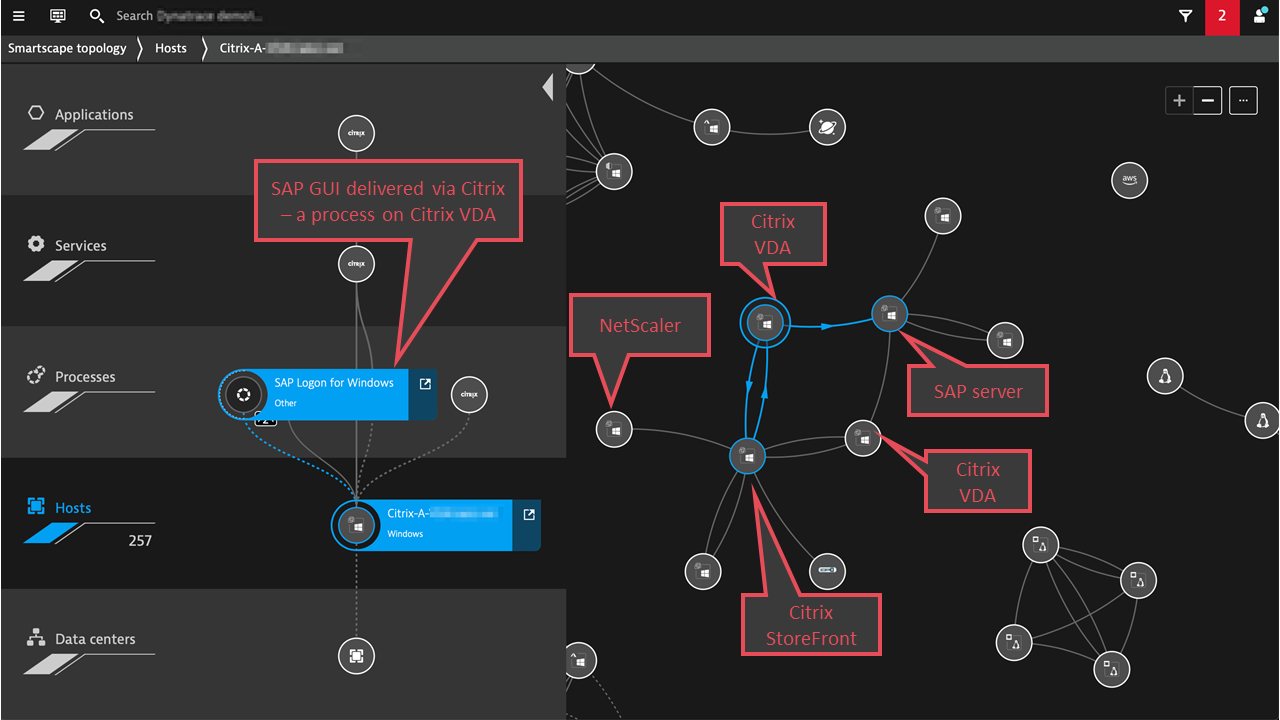
SAP GUI is often delivered via Citrix. The good news is that we also have an extension for Citrix real user monitoring. Use both Dynatrace extensions to measure the performance of both the application (SAP) and its delivery channel (Citrix). You can test-drive both extensions today! The Smartscape view shown below reveals dependencies between SAP and Citrix infrastructures.
Support and availability
Dynatrace RUM for SAP GUI is included in the newest versions of the SAP ABAP monitoring extension. The extension is fully supported by Dynatrace; it’s installed on an ActiveGate and is easy to deploy. Prerequisites include remote access to the SAP ABAP server over RFC, with the user permitted to execute standard monitoring functions. See Dynatrace extensions help for details.
Our remote monitoring technology ensures that you don’t have to install agents on SAP ECC or S/4HANA servers or client machines to start monitoring SAP ABAP platform with Dynatrace, including RUM for SAP GUI. However, installing OneAgent would enable Dynatrace to examine infrastructure performance fully and open visibility into system dependencies, so we strongly recommend it.
Interested in extending Dynatrace to monitor SAP ABAP real user experience?
The quickest way to get started is by contacting a Dynatrace ONE product specialist. Just select the chat button in the upper-right corner of the Dynatrace menu bar.



Looking for answers?
Start a new discussion or ask for help in our Q&A forum.
Go to forum