With the rapid adoption of SaaS vendor-provided applications in the enterprise (for example, Salesforce, Workday, Sharepoint, and Office 365), companies are increasingly looking for ways to ensure the customer experience and performance of the SaaS applications that their employees and customers rely on. Unfortunately, it’s usually not possible to install Dynatrace OneAgent on the web servers that SaaS vendors use to serve their applications. This is why Dynatrace now offers a browser extension that enables you to gain user experience insights into the performance of SaaS applications without access to the underlying web servers. The new Dynatrace Real User Monitoring (RUM) browser extension allows you to capture all the application performance and user behavior data that you need. Once configured, the RUM browser extension delivers complete Dynatrace real user monitoring capabilities.
We’re happy to announce the availability of the public Beta of the Dynatrace RUM browser extension. During the Beta period, this feature is available for Google Chrome browsers only.
Monitoring the SaaS-vendor applications you rely on enables you to pin down the root causes of certain elusive user-experience issues. You can now easily determine when SaaS-application performance problems only affect individual users and when such problems affect all your users. The browser extension is also a great way to monitor how the adoption of new SaaS products affects the user experience of your existing customers.
How to set up monitoring via the RUM browser extension
Monitoring applications via the browser extension is easy. For all the technical details and setup instructions, see Dynatrace help. Following are the high-level steps to get you started.
-
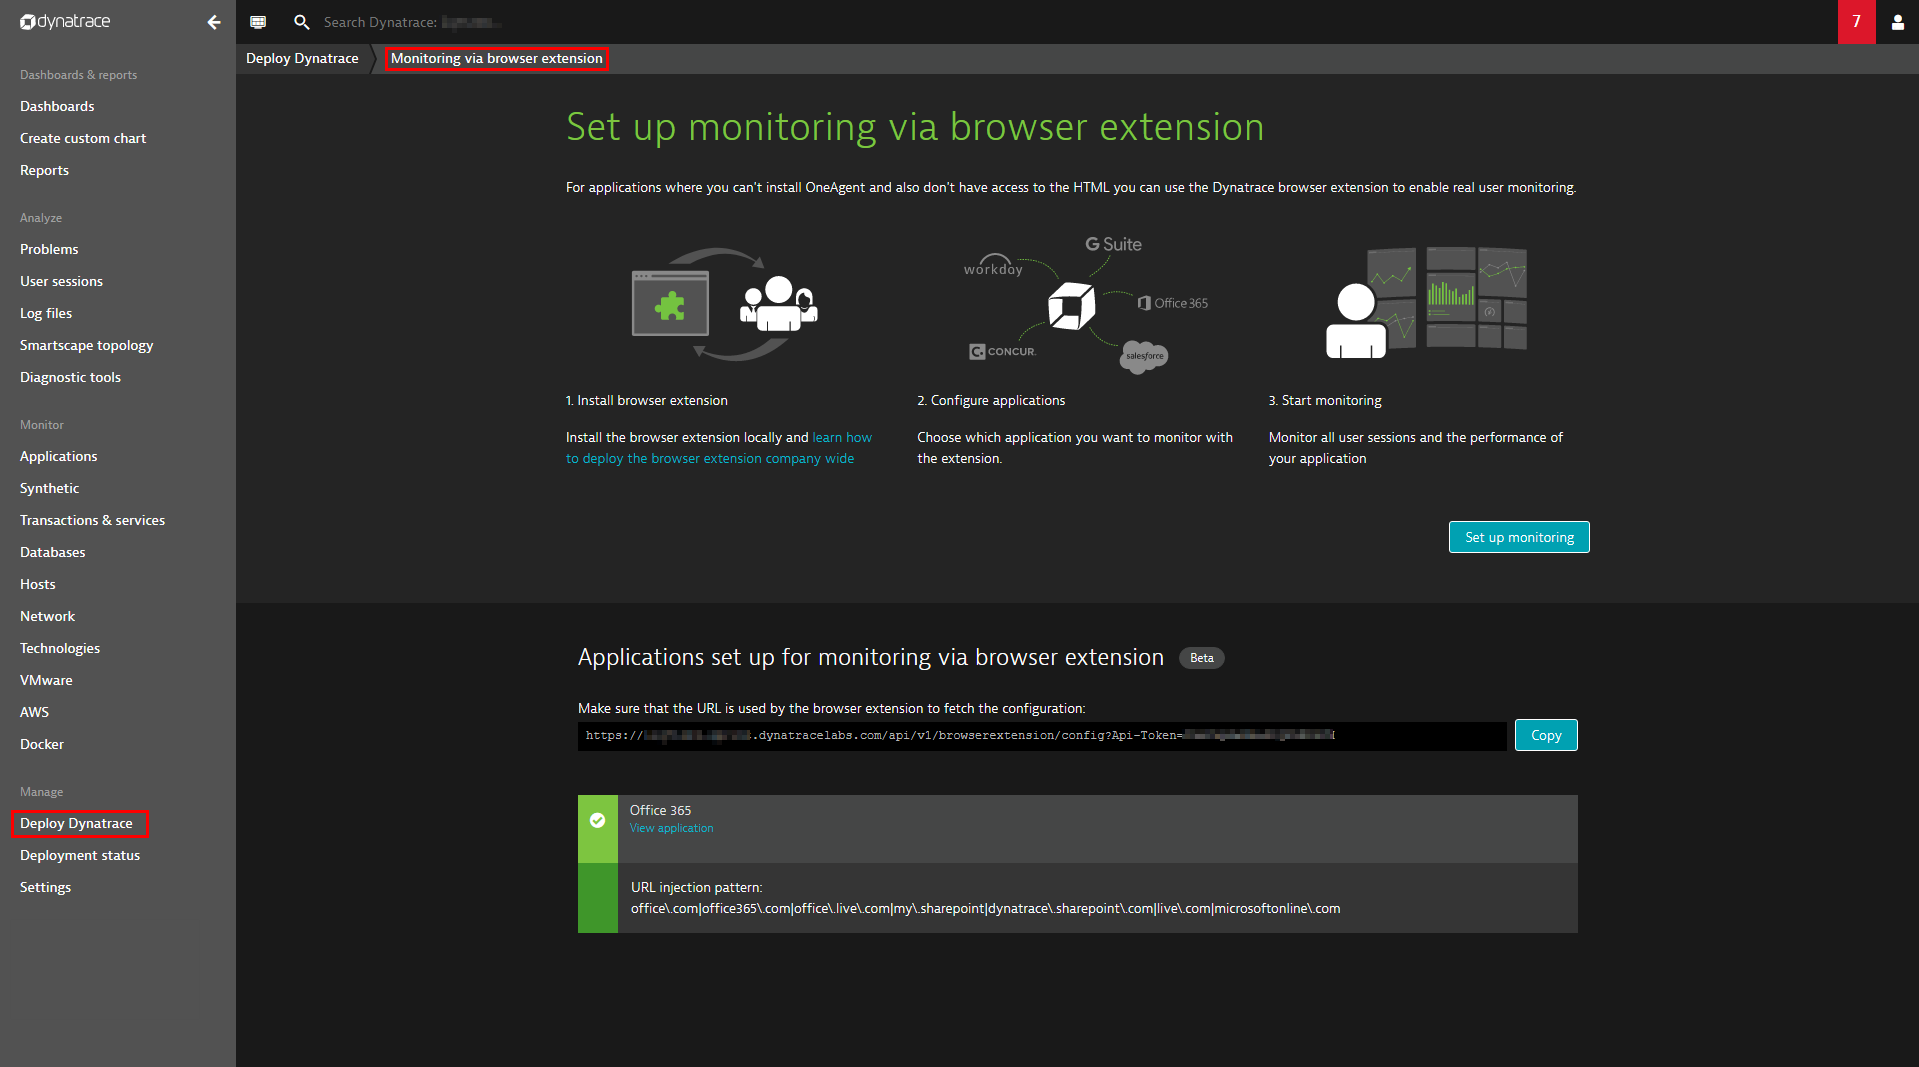
- Login to your Dynatrace environment and select Deploy Dynatrace from the navigation menu.
- Click the Monitor via browser extension button.

- Install the browser extension locally to test and refine your configuration.
- Configure the applications you want to monitor using the browser extension.
- Deploy the RUM browser extension company-wide.
For full details, see How do I monitor the user experience of 3rd-party SaaS vendors?
Real user monitoring
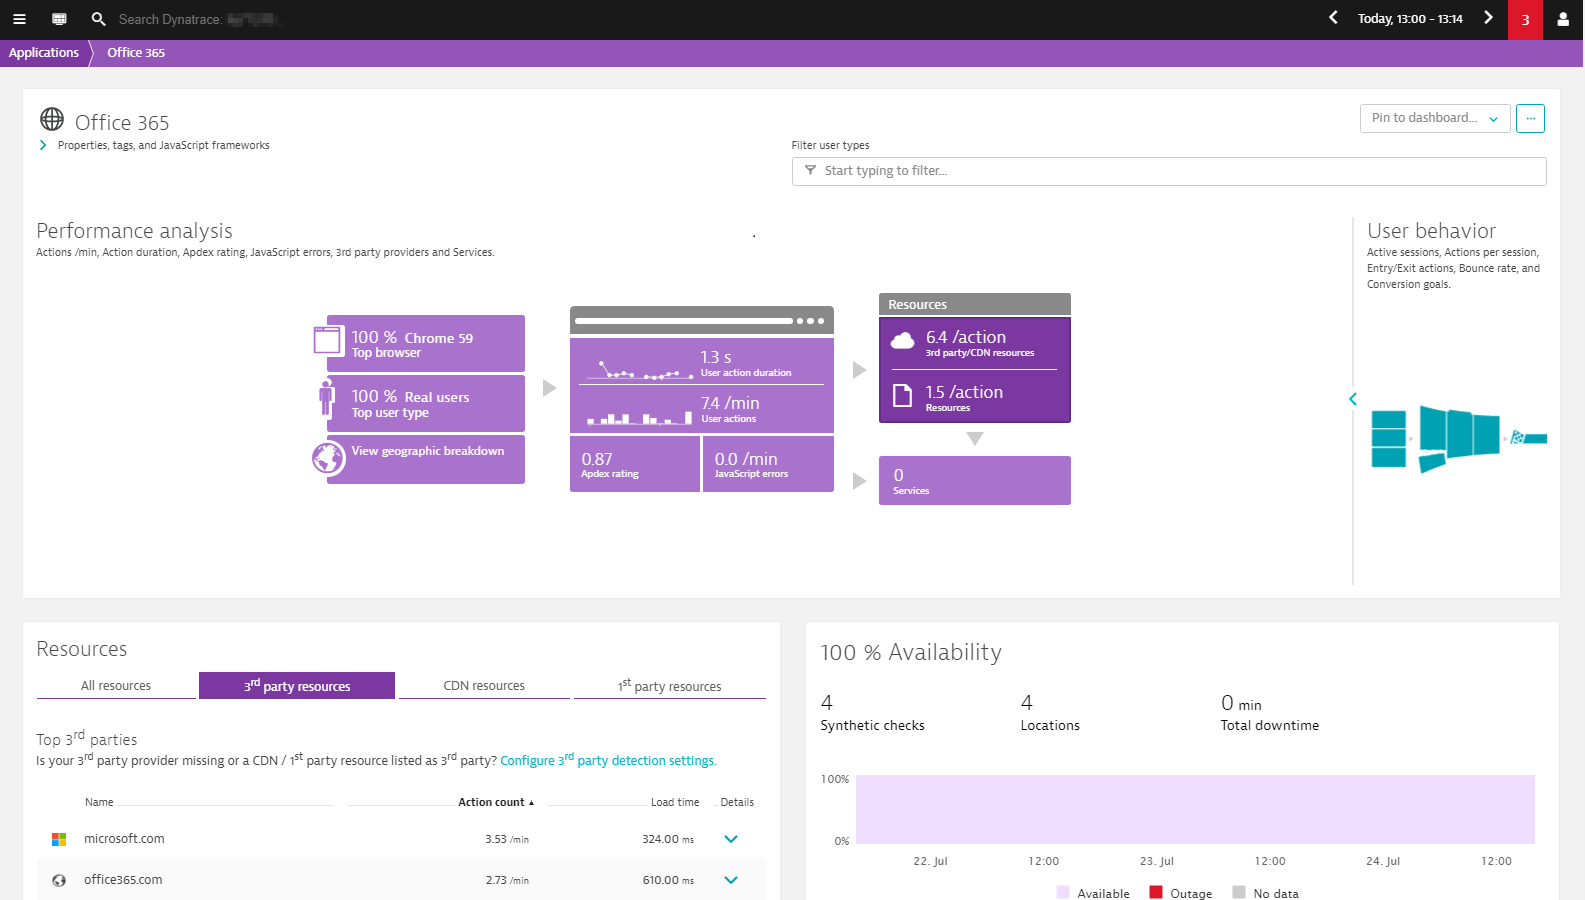
Monitoring data captured via the browser extension is analyzed and presented on your dashboards alongside all other Real User Monitoring data captured by OneAgent and agentless RUM.
To analyze data gathered via the RUM browser extension
- Select Applications from the navigation menu.
- On the Applications page, select the Injection type > Browser extension injected filter to view all applications currently monitored via the RUM browser extension.
- Proceed with user experience monitoring as explained in Dynatrace Help.

Deploy the RUM browser extension company-wide
Once you’ve configured your first applications, you’ll likely want to roll out the RUM browser extension to a larger group of users within your organization. The easiest way to roll out the extension—pre-configured and ready to go—is via two Google Chrome policies that are best deployed via windows group policies. Options for Linux & MacOS are also available. Head over to Dynatrace help for details on how to deploy the extension.
All deployed extensions automatically receive all configuration changes you make (for example, updated URL injection patterns or even completely new applications to be monitored). Also, any application-specific settings changes you make via the Dynatrace UI will be automatically picked up by the RUM browser extension.

Missing user actions or XHR actions?
If you don’t see all the user actions or XHR actions you expect to see, make sure you’ve enabled the relevant JavaScript frameworks in your application settings (Application settings > Async requests and single page apps).
Feedback
If you’re interested in using the RUM browser extension for Firefox or Edge, let us know. Have other feedback for the team? We’d love to hear from you!


Looking for answers?
Start a new discussion or ask for help in our Q&A forum.
Go to forum