Our continuous memory profiler allows you to see the actual method and execution tree that's responsible for creating the objects that cause frequent garbage collection.
Java Memory Management, with its built-in garbage collection, is one of the language’s finest achievements. It allows developers to create new objects without worrying explicitly about memory allocation and deallocation because the garbage collector automatically reclaims memory for reuse.
— Excerpt from How Garbage Collection works in the Dynatrace Performance eBook
However, garbage collection is one of the main sources of performance and scalability issues in any modern Java application. One of the most misunderstood parts of garbage collection is that it doesn’t actually collect dead or unused objects; it collects used ones, the so-called survivors. Garbage collection is slow if most objects survive the collection process. Depending on your application, you may be faced with one of these challenges:
- Slow garbage collection: This can impact your CPU massively and can also be the main reason for scalability issues. It prevents your application from fully leveraging the available CPU.
- Frequent garbage collection: This is triggered by the creation of a lot of objects. If these objects die quickly, then you might not have a scalability issue at all, as the garbage collection will be fast. This will, however, make your application slow.
Finding the root cause of these two garbage collection problems is difficult and, until now, has only been possible via either highly invasive and non-production-ready analysis tools or by simply knowing your application intimately—something that is almost impossible with large applications.
Optimize your code by finding and fixing the root cause of garbage collection problems
To give you the definitive root cause of these issues, we’re happy to announce our continuous memory profiler, which allows you to easily see the actual method and execution tree that’s responsible for creating the objects that are responsible for slow or frequent garbage collection.<

These details arm you with the knowledge necessary to find the respective code and remove unnecessary allocations. Any significant reduction in allocations will inevitably speed up your code. Let’s take a look at how this works.
Pinpoint garbage collectors that prevent your application from scaling
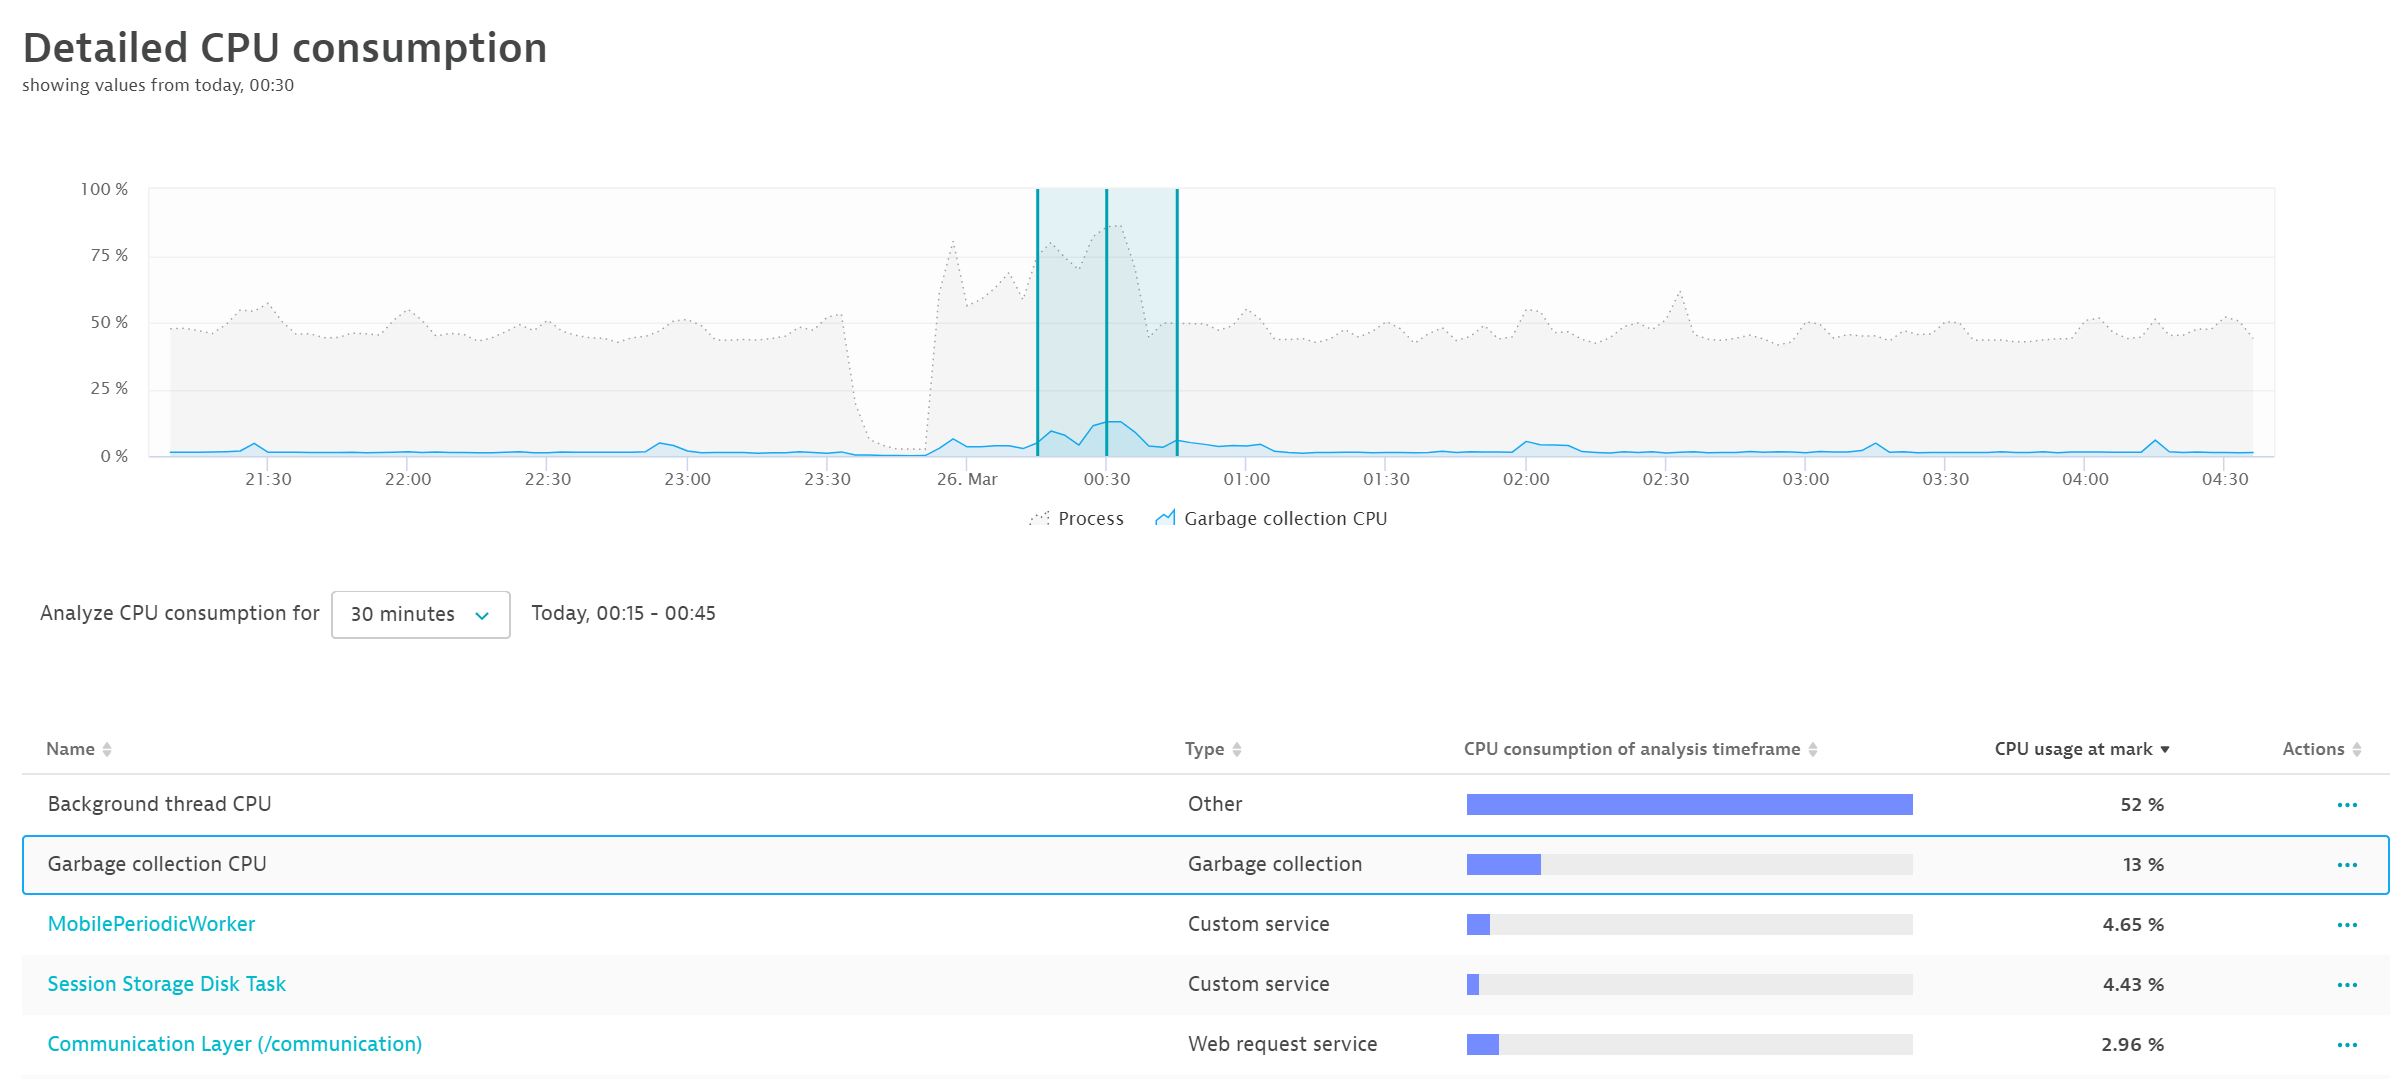
First, let’s use Dynatrace to find out if a garbage collector is preventing your application from scaling. There are several symptoms of inadequate scaling. One is that with increased load, the amount of CPU consumed by your JVM increases but the memory is used more by garbage collection than your application. You can easily see this in Dynatrace:
- From any Host page, select a Process page.
- Select View detailed CPU breakdown to open the CPU chart.
- Select the Garbage collection CPU service from the list beneath the chart.
As you can see in the example below, CPU usage rises just as CPU consumption by garbage collection rises. This resource is not available to your application.
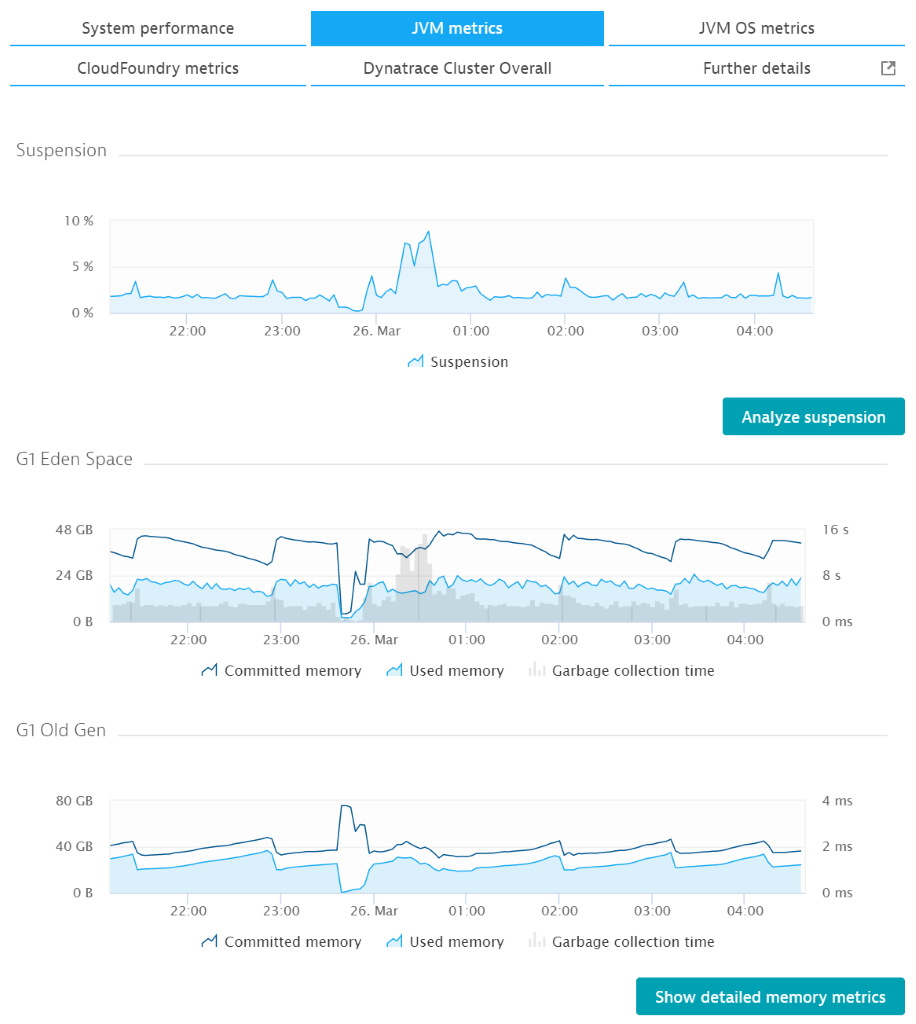
Even though there’s more CPU capacity available, your application can no longer make use of it. To see why, navigate to the Suspension chart on the JVM metrics tab.
The image above shows a peak that lines up perfectly with the increased garbage collection CPU demand as well as with the increased garbage collection time (see the G1 Eden Space chart). The suspension rate reaches almost 10%.
This means that for 6 seconds out of every minute, your JVM stops all application threads. The threads don’t just slow down—they’re halted completely. At this point, it doesn’t matter how many CPUs you have because you can’t use them. Actually, the situation becomes even more challenging with more CPUs.
By selecting Analyze suspension here, you can go directly to the new memory profiler and see why your garbage collection and suspension times are so high.
Find and fix the root cause of slow or resource-intensive garbage collection
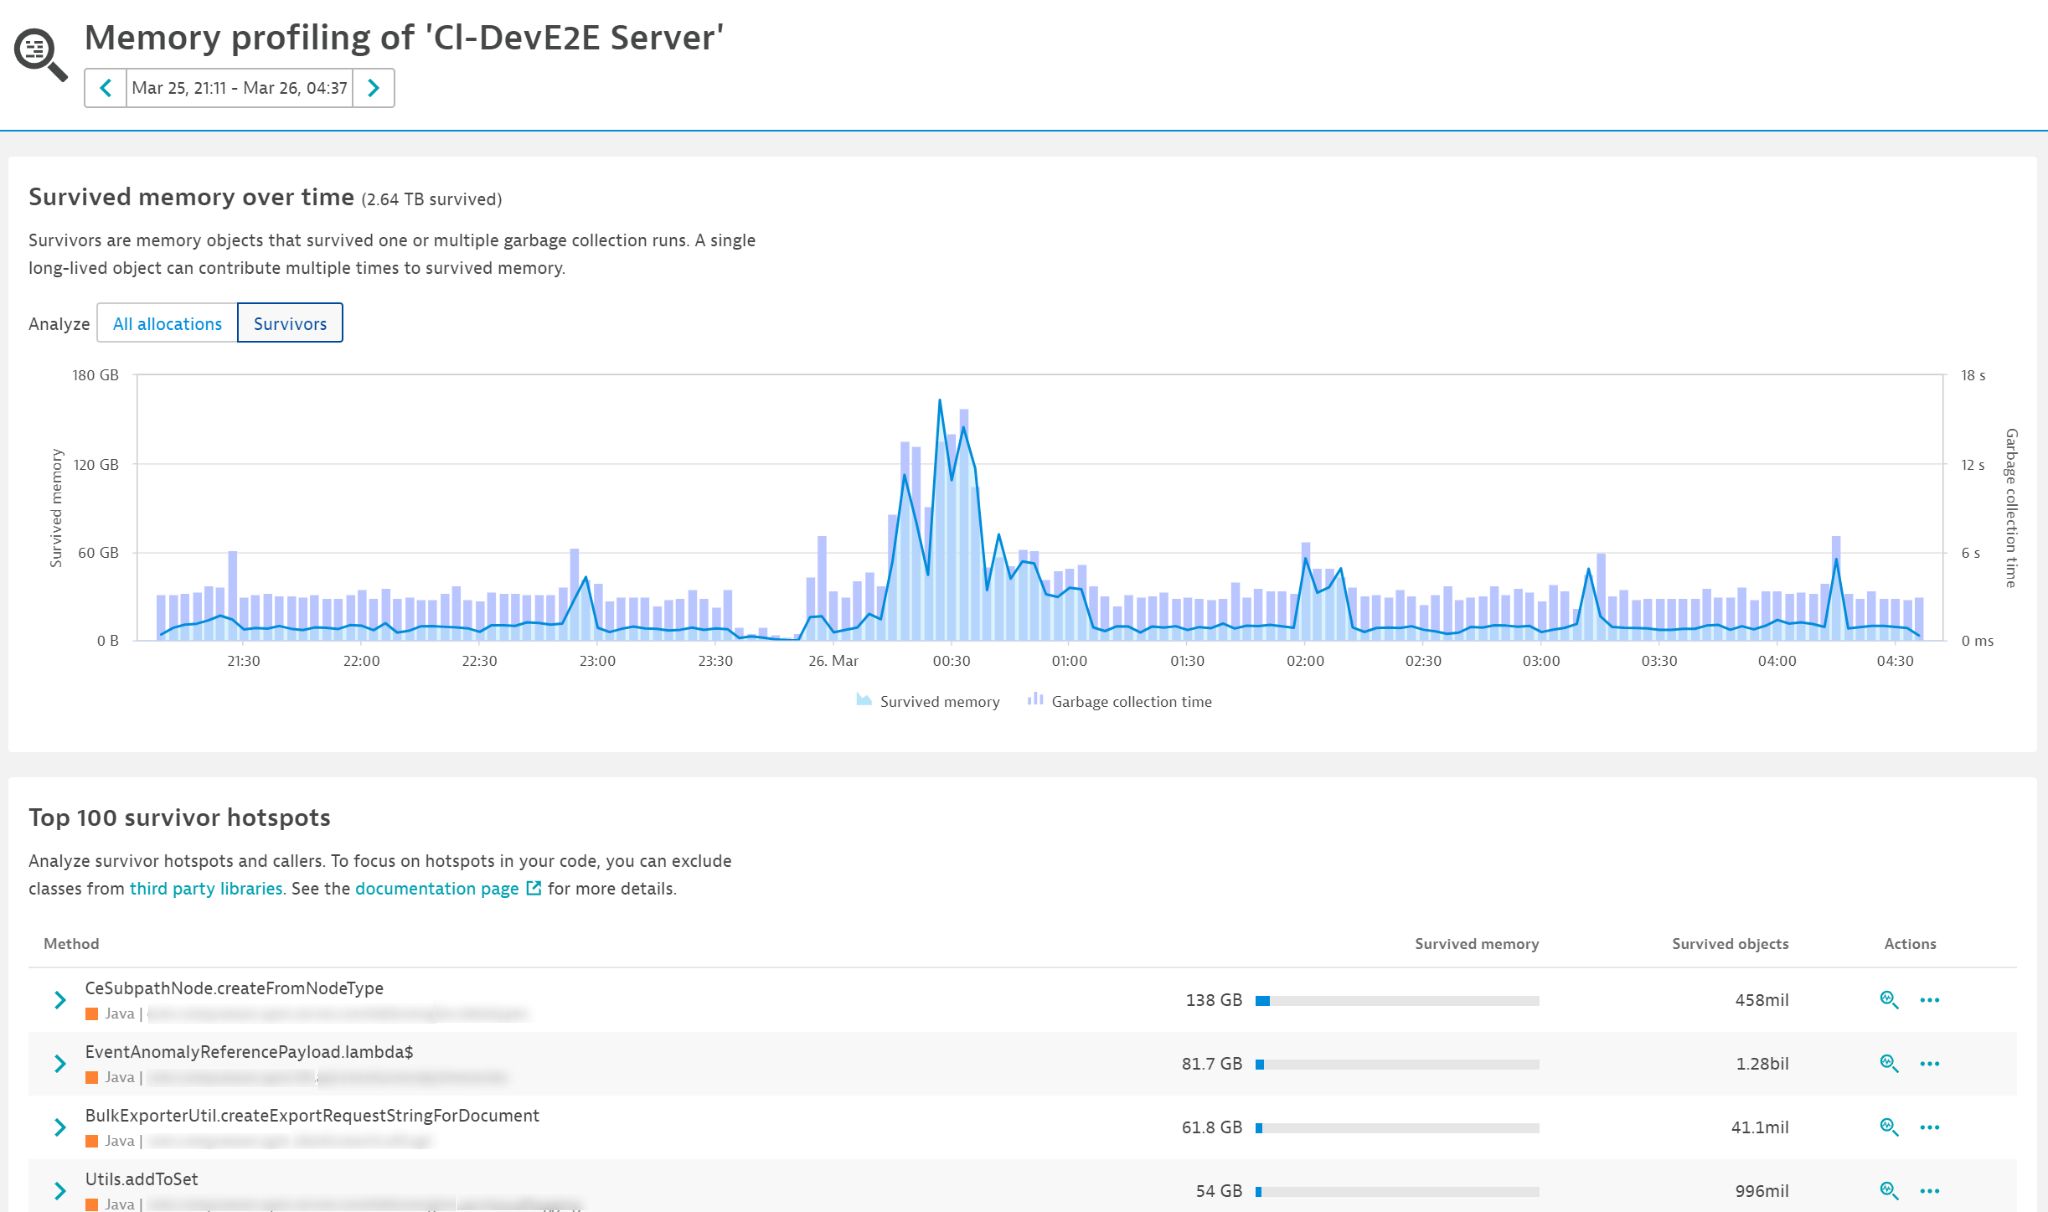
The memory profiler allows you to compare the amount of newly allocated memory that survives one or more garbage collections to the time it takes to execute such garbage collections. As you can see in the chart below, the two line up almost perfectly. At the bottom of the chart, you can see a list of the allocation method hotspots that are responsible for garbage collection times. These are methods and stack traces in your code (each with the respective amounts of memory and objects) that were allocated by the code and survived garbage collections.
The Top 100 survivor hotspots list tells you exactly which part of your code is responsible for the high garbage collection time. You can even reduce the analysis timeframe to get a more accurate picture of what’s going on (see below).
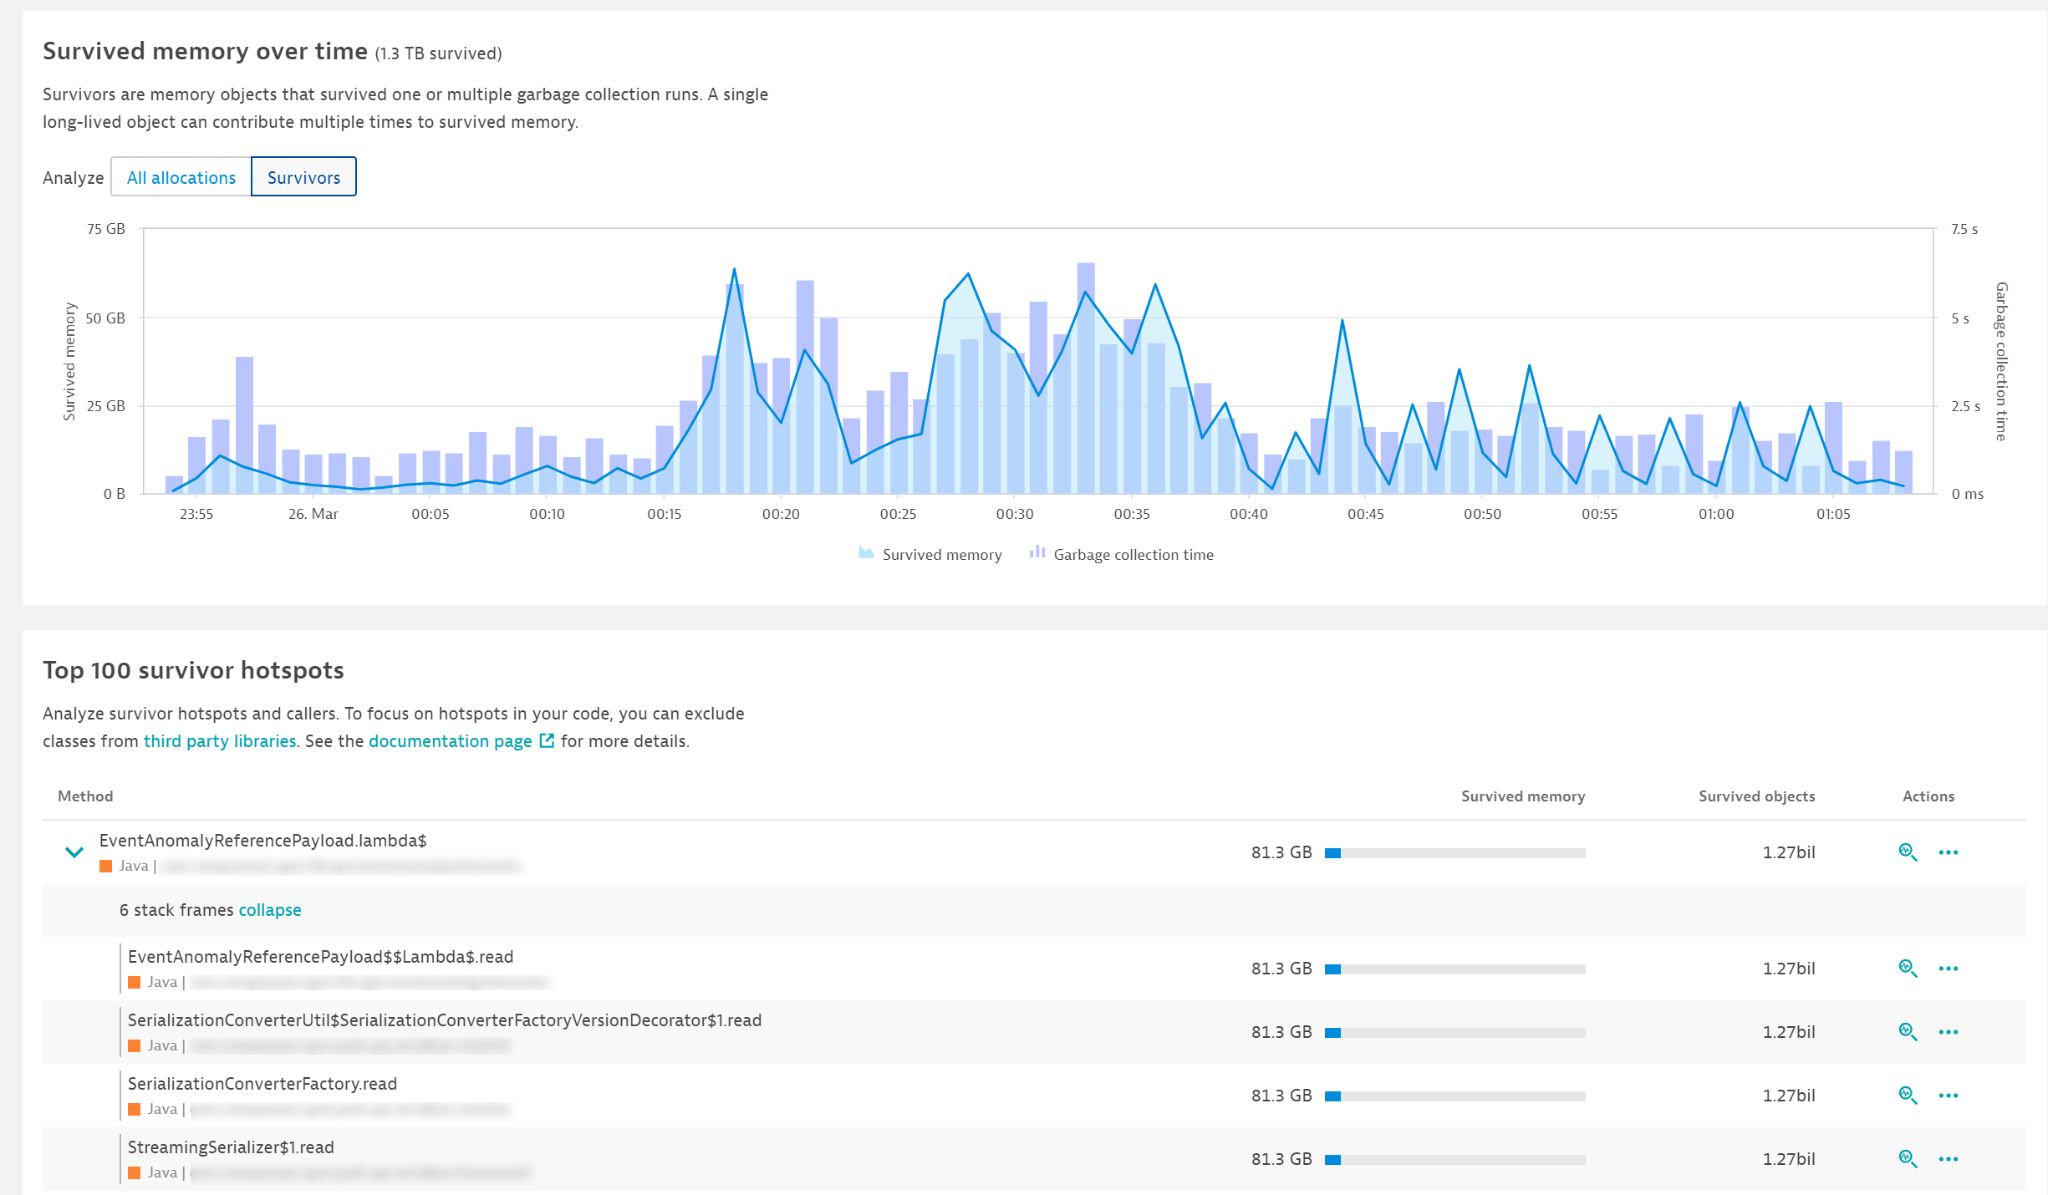
Reducing the analysis timeframe narrows down the method and stack trace to what appears to be the main hotspot:
So what’s going on here? Somewhere within the lambda call, the code allocated about 80 GB and 1.27 billion objects in the span of an hour that could not be garbage collected immediately. It thus had to be copied and moved by the garbage collector. Select the Analyze button (magnifying glass icon at the right end of each row) to look at the details here. By doing so, you get an execution tree that tells exactly which method has allocated which object type.
You might be surprised that the numbers differ. The image above shows the stack trace of the identified hotspot. However, the method can be executed via many different execution paths, and this is what we see below. This means that the optimization potential is actually even 2.5 times more than what we assumed at first glance. You can even look at the source code directly.
With this information, you can immediately make the necessary changes that will directly have a positive impact on your garbage collection times. You can then use Dynatrace to verify that the changes have a positive effect on your application performance.
Find and fix the root cause of fast but too frequent garbage collection
The root cause of high-frequency garbage collection is object churn—many objects being created and disposed of in short order. Nearly all garbage collection strategies are well suited for such a scenario; they do their job well and are fast. However, this still consumes resources. The root cause of object churn is high object allocations. By reducing the number of allocated objects, you can both speed up your code and reduce object churn and garbage collection events. That said, frequent fast garbage collection events point to a high optimization potential in your application. You can:
- Reduce the garbage collection frequency
- Save on CPU resources
- Speed up application code itself
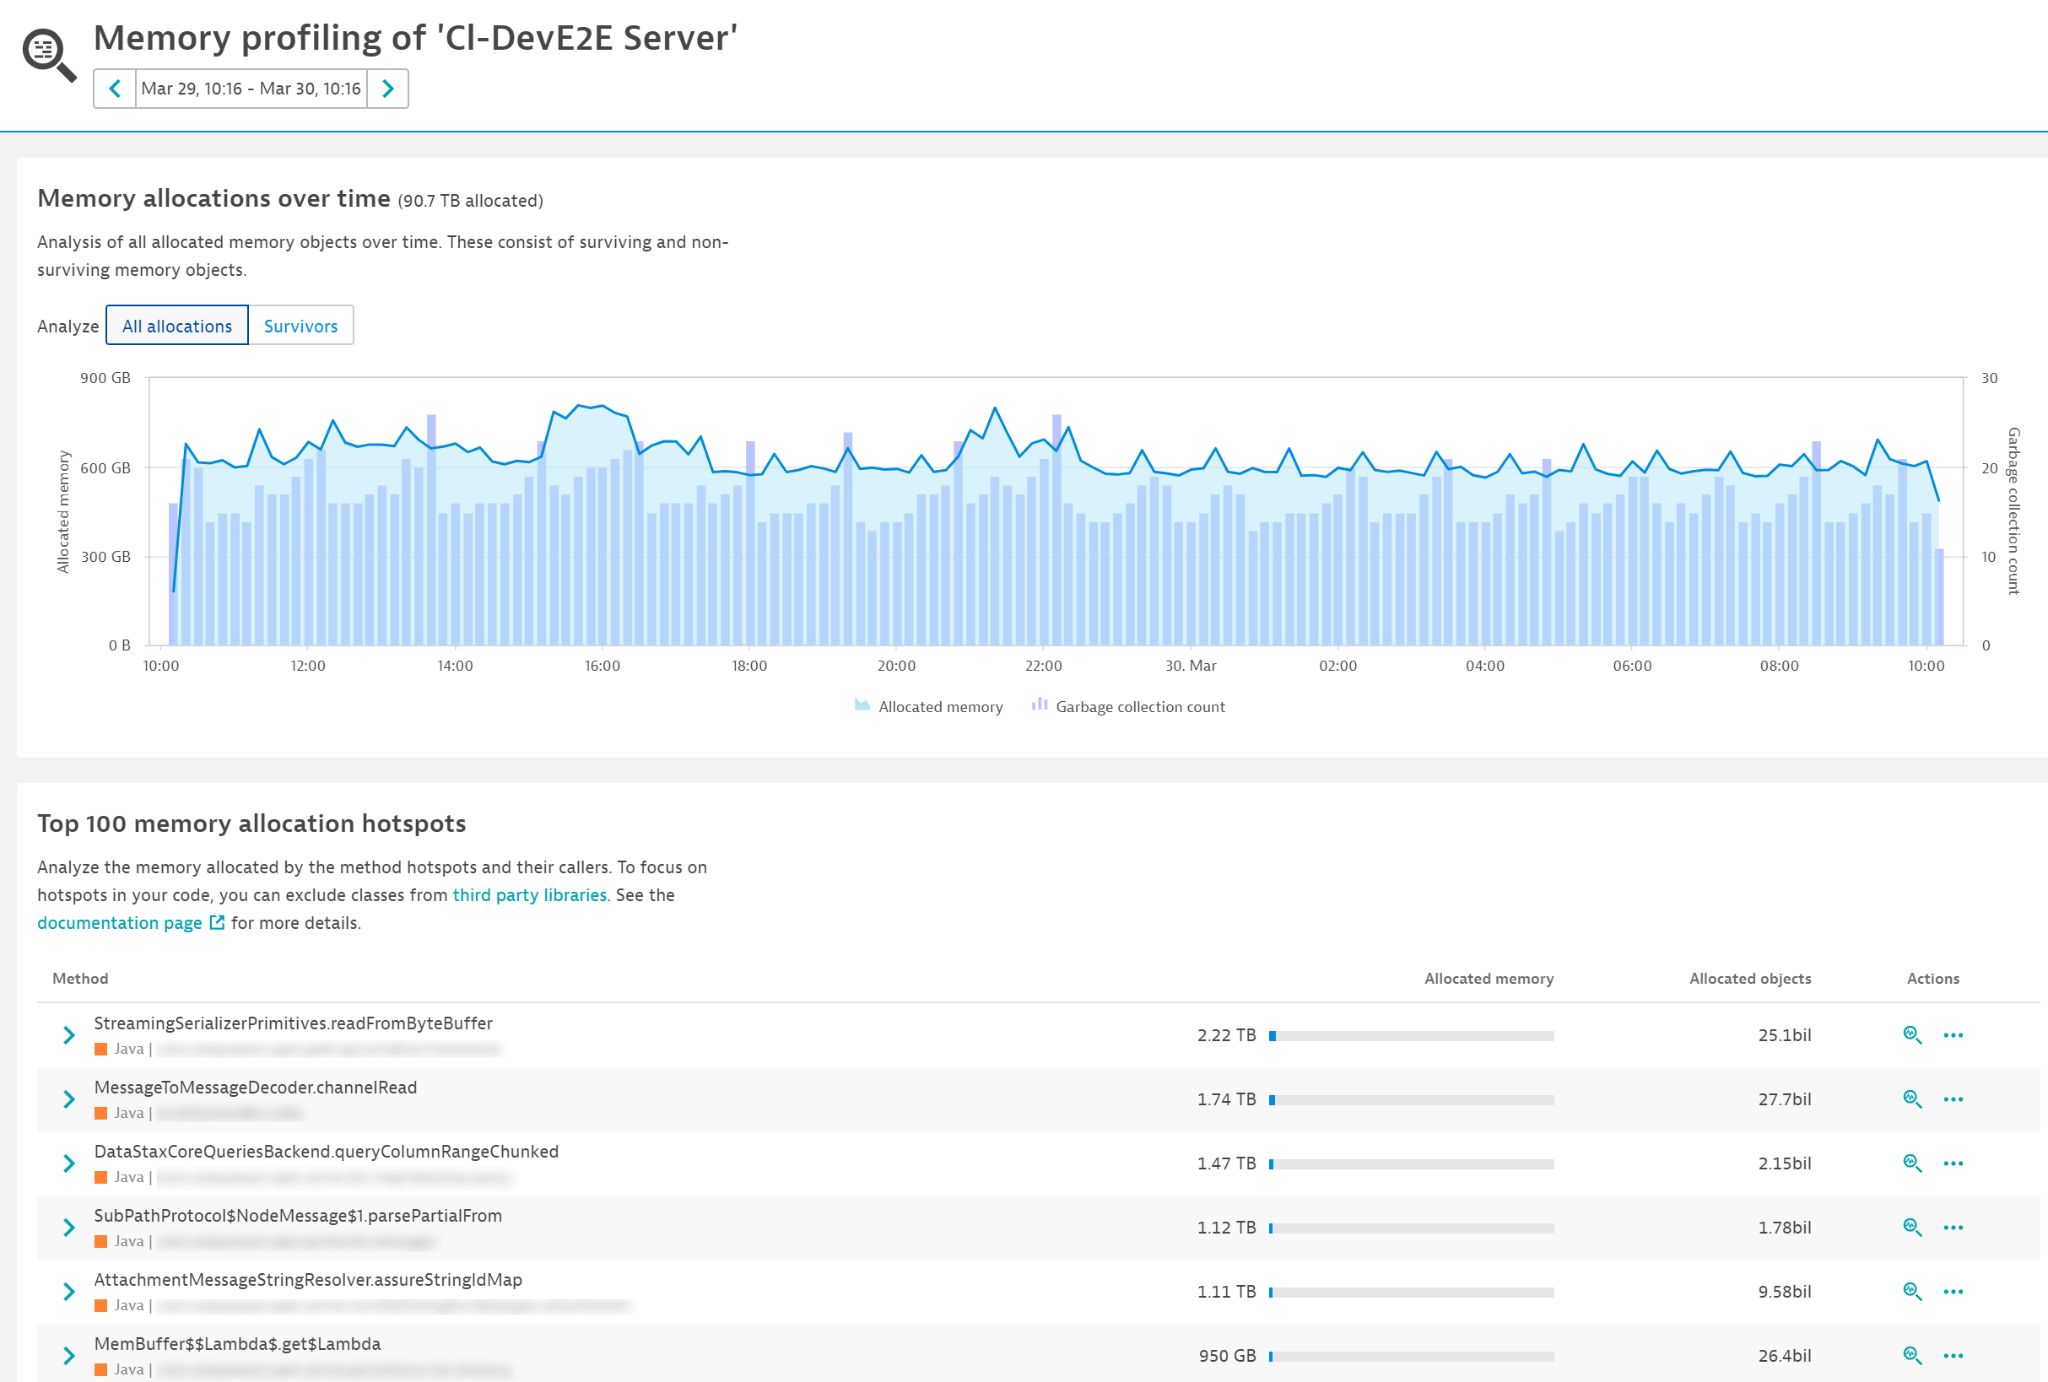
To see how Dynatrace helps here, select the All allocations tab. You can now see the correlation between all allocated memory and garbage collection frequency (see the chart below).
The list at the bottom shows the Top 100 memory allocation hotspots. The difference in this tab is that it shows all hotspots, not just those whose objects that survived the first garbage collection cycle. As you can see, the memory numbers are huge, which means that any hotspot here has huge potential for improvement.
You can also look at the details of each hotspot to find the best way to optimize it. In the example below, you can deduce that the biggest benefit would be from reducing the number of times we create a new DataInputStream.
Note: This way of looking at the data doesn’t indicate problems with your code. It merely points to optimization potential. Any significant reduction in allocations will inevitably speed up your code. It might lead to lower garbage collection frequency as a result. However, when your code runs faster, garbage collection frequency might not really change because it just gets compressed further.
You should also be careful when adding any sort of cache or object reuse strategy. While these are useful at times, they have their own drawbacks and can lead to bigger issues as such objects will inevitably end up in the old generation and fill it up over time. The best optimization strategy is to simply remove unnecessary allocations by optimizing the code. This will always speed up your code, and the memory profiler will help you find the right code to optimize.
How to enable the continuous memory profiler
You can enable the memory profiler by going into Settings > Server-side service monitoring > Deep monitoring > New OneAgent features. Search for Continuous memory profiling and enable it. Note that you must restart your application JVM for this feature to become active.
Prerequisites
This feature requires Java 11+.
Feedback?
As always, we welcome your feedback and comments. Please share your thoughts with us via Dynatrace Community, or from within the Dynatrace web UI—just start a chat with a Dynatrace ONE representative. We’d love to hear from you.




Looking for answers?
Start a new discussion or ask for help in our Q&A forum.
Go to forum