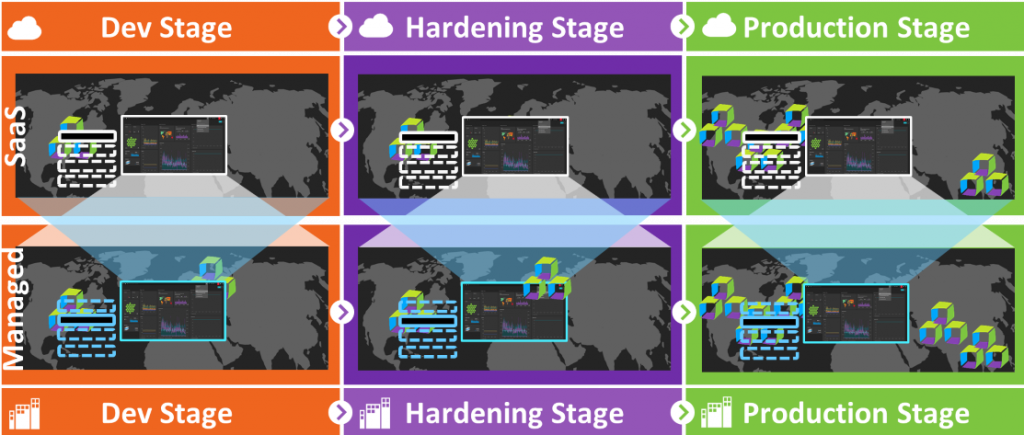
Every other week Dynatrace ships a new version of our Software Intelligence Platform into production. It’s done through what I would refer to as “Progressive Delivery at Cloud Scale”. What does that mean? The new version that comes out of our hardening stage gets rolled out to a small initial set of Dynatrace clusters. Through automated self-monitoring, we observe whether the update succeeded within a certain time window and whether the cluster runs within our defined Service Level Objectives (SLOs). If that’s the case, the update process continues to the next set of clusters and that process continues until all clusters are updated to the new version.

An individual Dynatrace cluster update is done through a rolling update of each individual cluster node. As you may know – a Dynatrace cluster always has at least 3 nodes – this is true for our Dynatrace Managed installations as well as our Dynatrace clusters that power our SaaS offering.
During such a rolling update, one node after the other is brought down, updated, and restarted. When a node comes back up, several initialization steps happen for each Dynatrace Tenant / Environment that runs on that Dynatrace Cluster. Normally, initializing such a Tenant / Environment takes about 1-2 seconds and is not a big deal, even if we have hundreds or more tenants on one node!
During one of our recent upgrades, our teams observed that a node in one of our Dynatrace SaaS clusters took much longer than normal to restart. While all other nodes took about 10 minutes to initialize ~1200 tenants, one of the nodes took about 18 minutes to initialize one specific tenant. That raised some questions: Was this an isolated issue just for one tenant or could it also come up when rolling out the version to all our other clusters that were still waiting for the new version?
As all our Dynatrace clusters – whether deployed in dev, staging, or production – are automatically self-monitored using Dynatrace, it was easy to answer this question! Our Cluster Performance Engineering Team in collaboration with our Autonomous Cloud Enablement (ACE) and development teams quickly identified the root cause and fixed the problem in no time! All thanks to the data Davis® already had ready for them when analyzing this slow startup problem.
This is a great example of how valuable Dynatrace is for diagnosing performance or scalability issues, and a great testimony that we at Dynatrace use our own product and its various capabilities across our globally distributed systems. And the code-level root cause information is what makes troubleshooting easy for developers.
Best of all – all this work was done with zero customer impact 😊
Now, let me walk you through the actual steps the team took so you can see for yourself how not only we at Dynatrace but any engineering organization can benefit from Dynatrace in any stage of the software delivery cycle:
Step 1: Dynatrace thread analysis
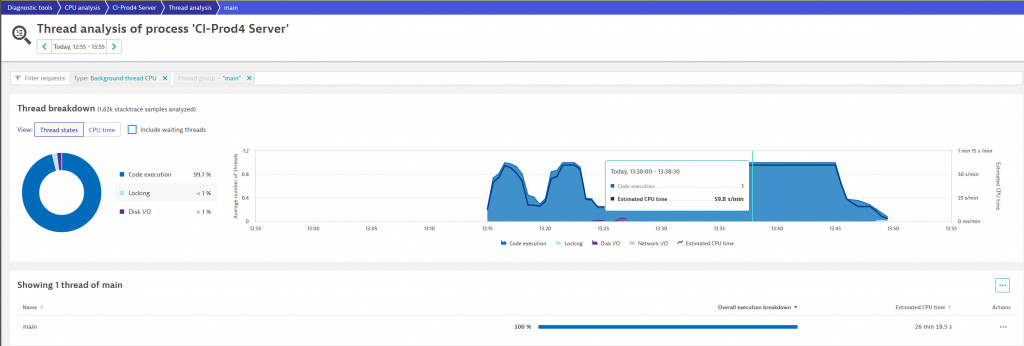
Dynatrace thread analysis is a great starting point to identify CPU hogging or hanging threads in your application. For our teams, the analysis immediately pointed out that the “main” thread spiked with 100% CPU utilization during the problematic startup period. You can see this yourself in the following screenshot where the “Estimated CPU time” of 59,8s / min clearly tell us that this Java main thread is fully utilizing one of our cores:

From here it’s a single click to the CPU Method Hotspot analysis!
Step 2: CPU hotspot analysis
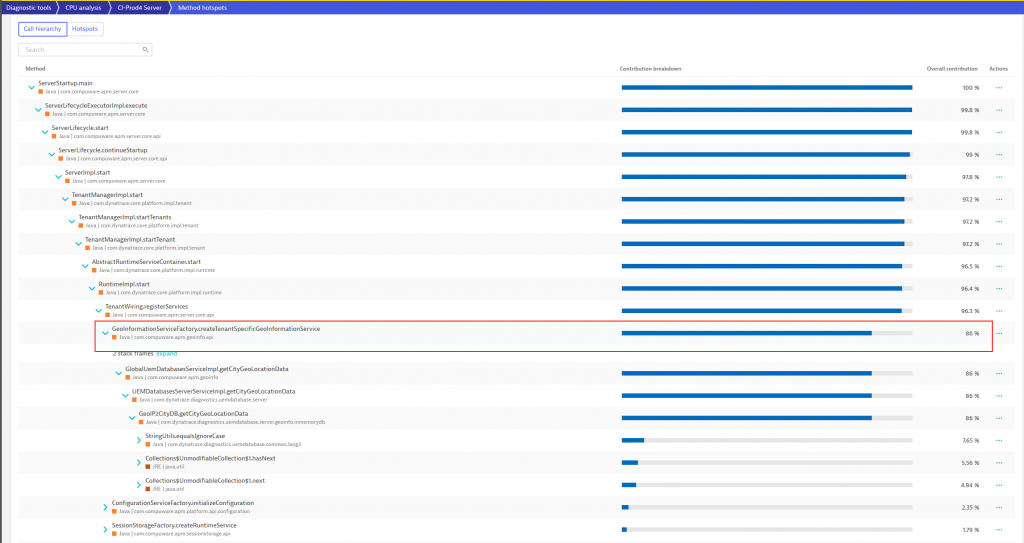
As Dynatrace automatically captures stack traces for all threads at all time the CPU Hotspot analysis makes it easy to identify which code is consuming all that CPU in that particular thread. In our case this could be attributed to the service that initializes tenant-specific Geo-Information as you can see from the following screenshot:

The method “hotspot view” provides many additional capabilities like decoding or downloading the byte code right here on the spot.
Step 3: Identifying root-cause in code
With Dynatrace already pointing to the problematic line of code, and the additional captured contextual information including the problematic tenant that caused this spike, it was easy to find the root cause.
It turned out that the method in question was recently added and was new in the latest rolled. The method was reading custom geographical locations for Dynatrace’s RUM geo-mapping capability and then validated against the Geographical Database Service. By default, checking these configurations is not a performance problem as a standard tenant only has a handful of these custom locations configured. The problematic tenant on that Dynatrace cluster node, however, had well over 15,000 custom locations configured, which caused the spike in CPU and long execution time as each location was checked individually against the database!
Step 4: Fixing the issue
To solve this problem several strategies were discussed. One of them being a small cache that would have brought the initial startup time down by about 95%. Another one was to rethink the whole requirement for this check during startup.
In the end, the team was able to provide a fix to this issue solving the startup time issue for this and for future updates to Dynatrace clusters.
Conclusion: Dynatrace for Developers
I’m honoured to be able to share these stories on how we use Dynatrace internally in our everyday development, performance engineering, and progressive delivery processes. It shows how Dynatrace makes life so much easier for performance engineers and developers that need to ensure our code is highly optimized for speed and resource consumption.
Special thanks to all the teams involved in bringing us this story: Cluster Performance Engineering (CPE), ACE, Development and of course our product team who is not only building great features for our customers but also features that we truly need in our own day two-day work!


Looking for answers?
Start a new discussion or ask for help in our Q&A forum.
Go to forum