Over the past couple of years, we’ve discovered that classifying detected problems based solely on impact to related services and applications is insufficient. For example, serious application availability problems can sometimes be difficult to recognize amidst unrelated infrastructure resource problems. This is why we’ve introduced problem severity levels to help you focus on severe problems (for example, application availability problems) while ignoring insignificant resource issues.
The latest Dynatrace release introduces a new severity-based classification for detected problems. We’ll explain the different severity types here and discuss how this severity classification system will affect Dynatrace problem alerting in future releases.
Severity classifications
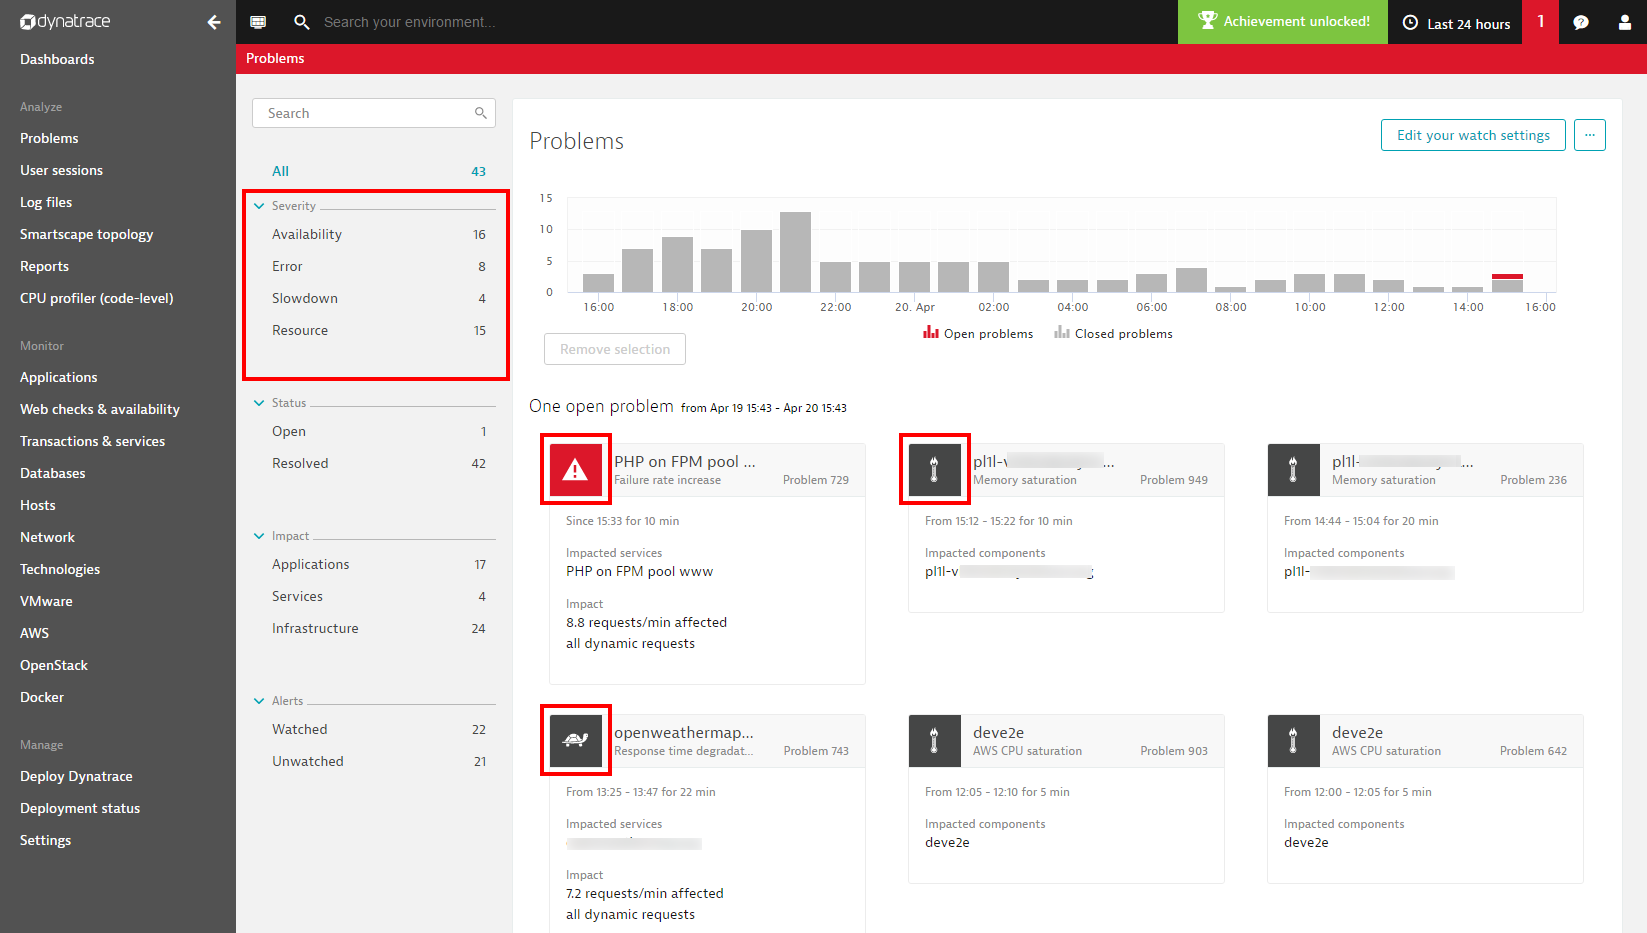
The new problem severity classifications distinguish between Availability, Error, Slowdown, and Resource severity types.
Availability problems

Availability problems are raised when important resources, such as hosts, processes that support services, or applications stop responding. Possible reasons for availability problems included crashed processes, unexpected shutdowns, and failing synthetic tests. A typical availability problem pattern might begin with Dynatrace detecting a service slowdown of a service, followed by a slowdown in the underlying process, and finally resulting in a CPU spike that crashes the process. Such a problem would begin as a service slowdown and then be automatically raised to the severity level of ‘Availability’ once the process crash is detected.
Other possible availability problem patterns include global application outages, which are raised when all monitoring locations of a WebCheck fail concurrently (see example below). 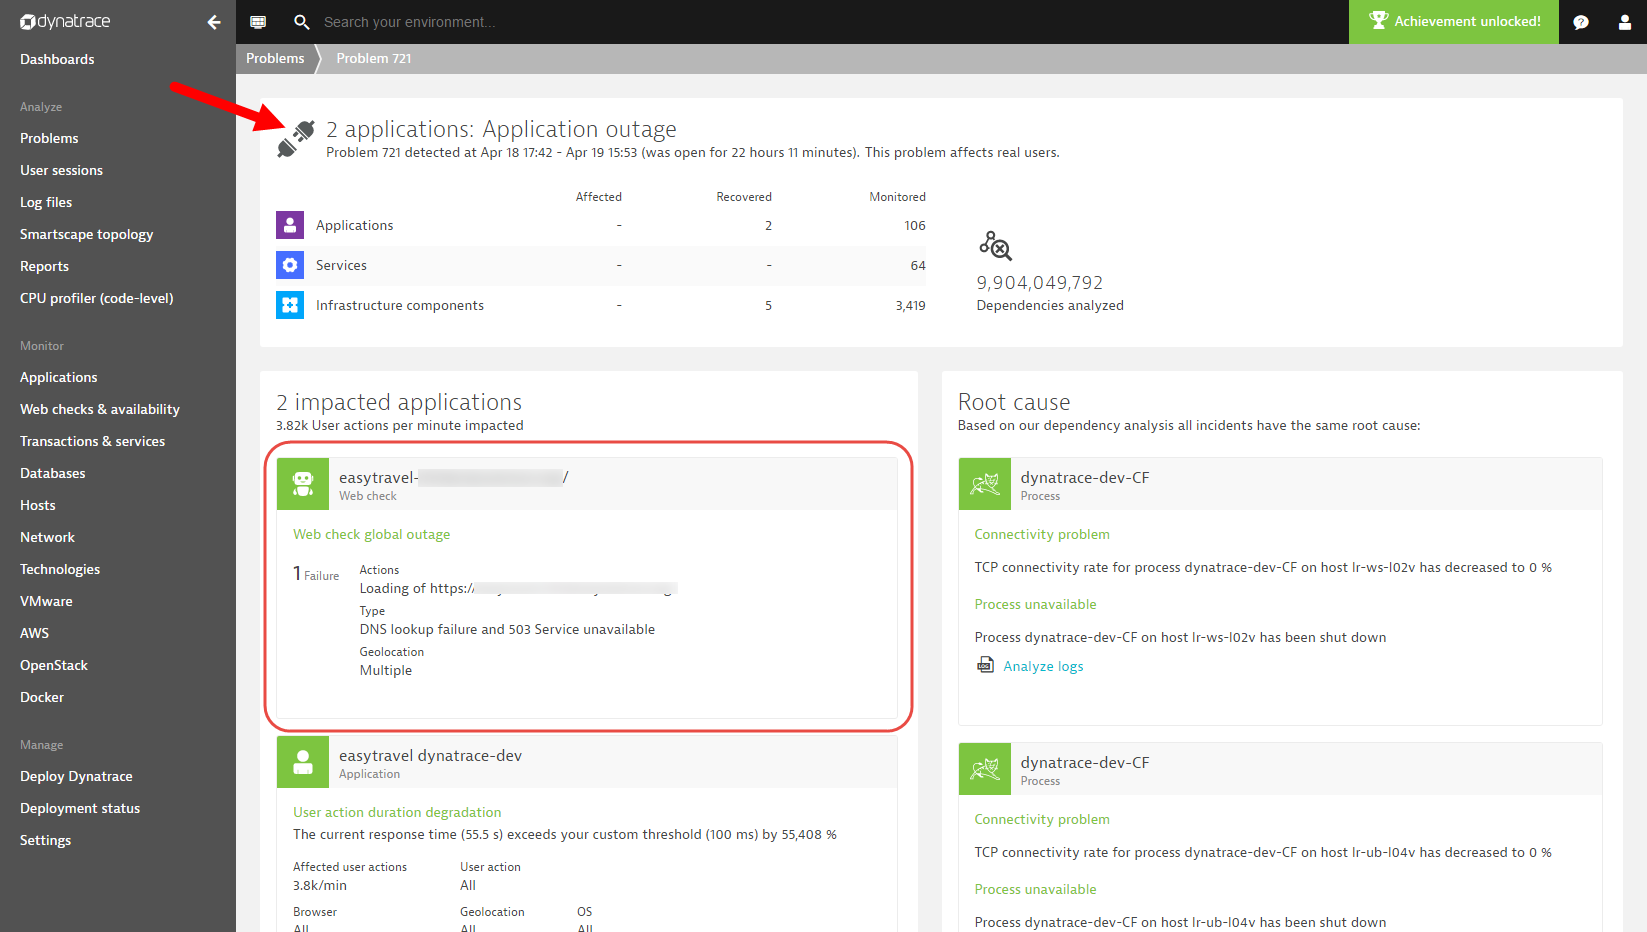
Error problems

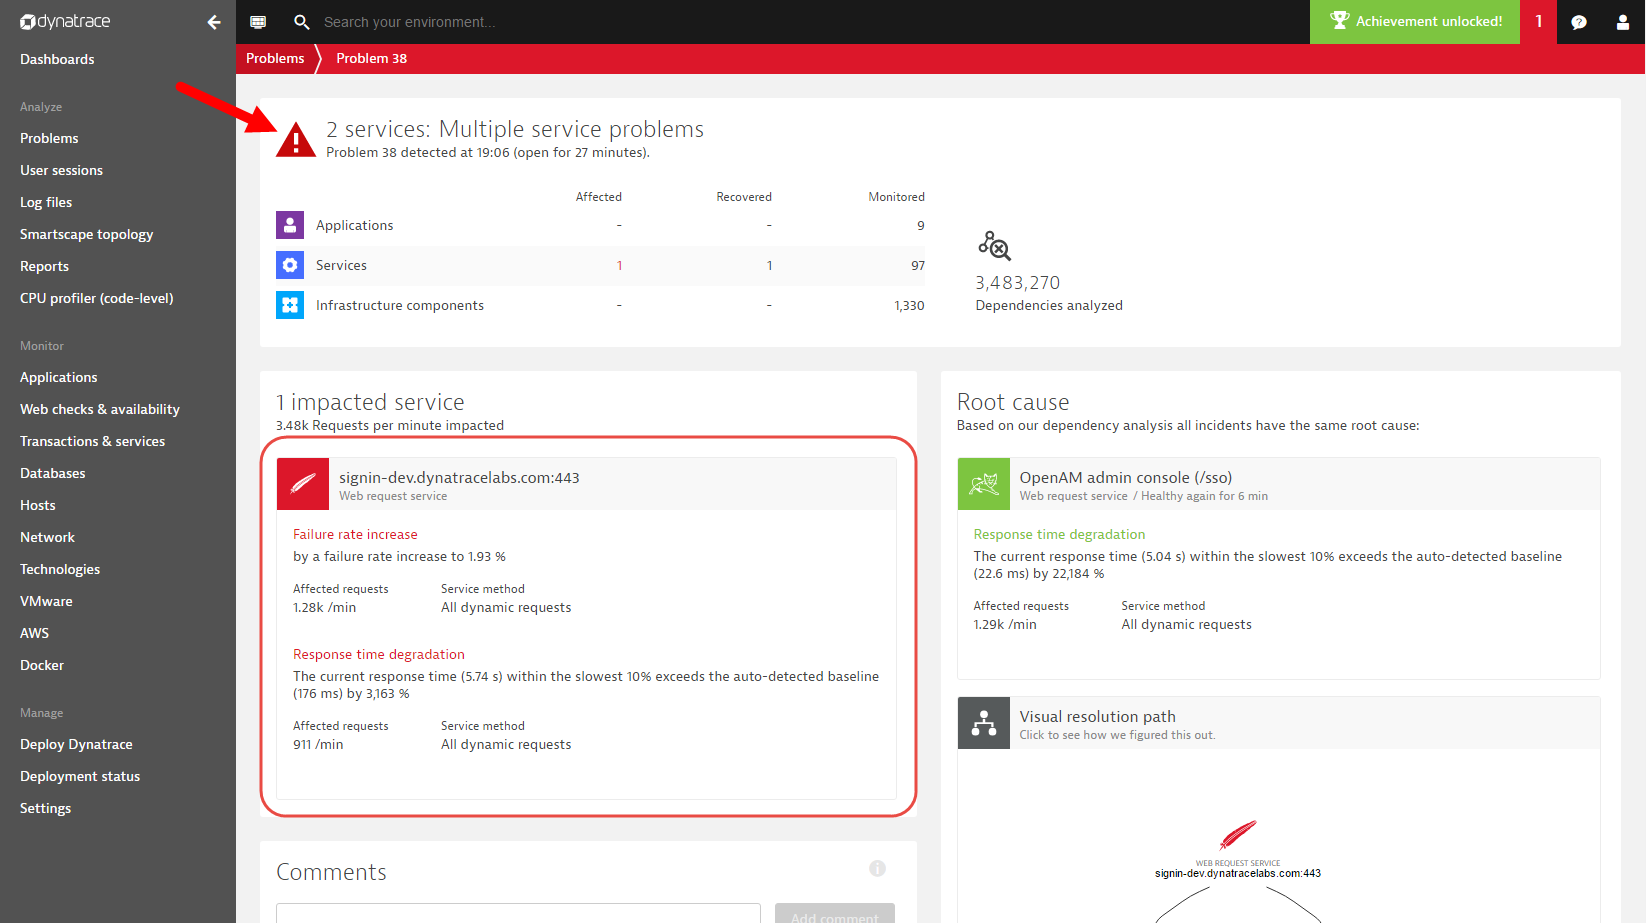
Error problems are detected when an application or service experiences a significant increase in error rate. Error-problem patterns include increased service and database error rates and JavaScript error rate increases detected via real user monitoring. Error problem patterns are used to inform you of severe errors related to entities that are still responsive and operating (see error problem example below).
Slowdown problems

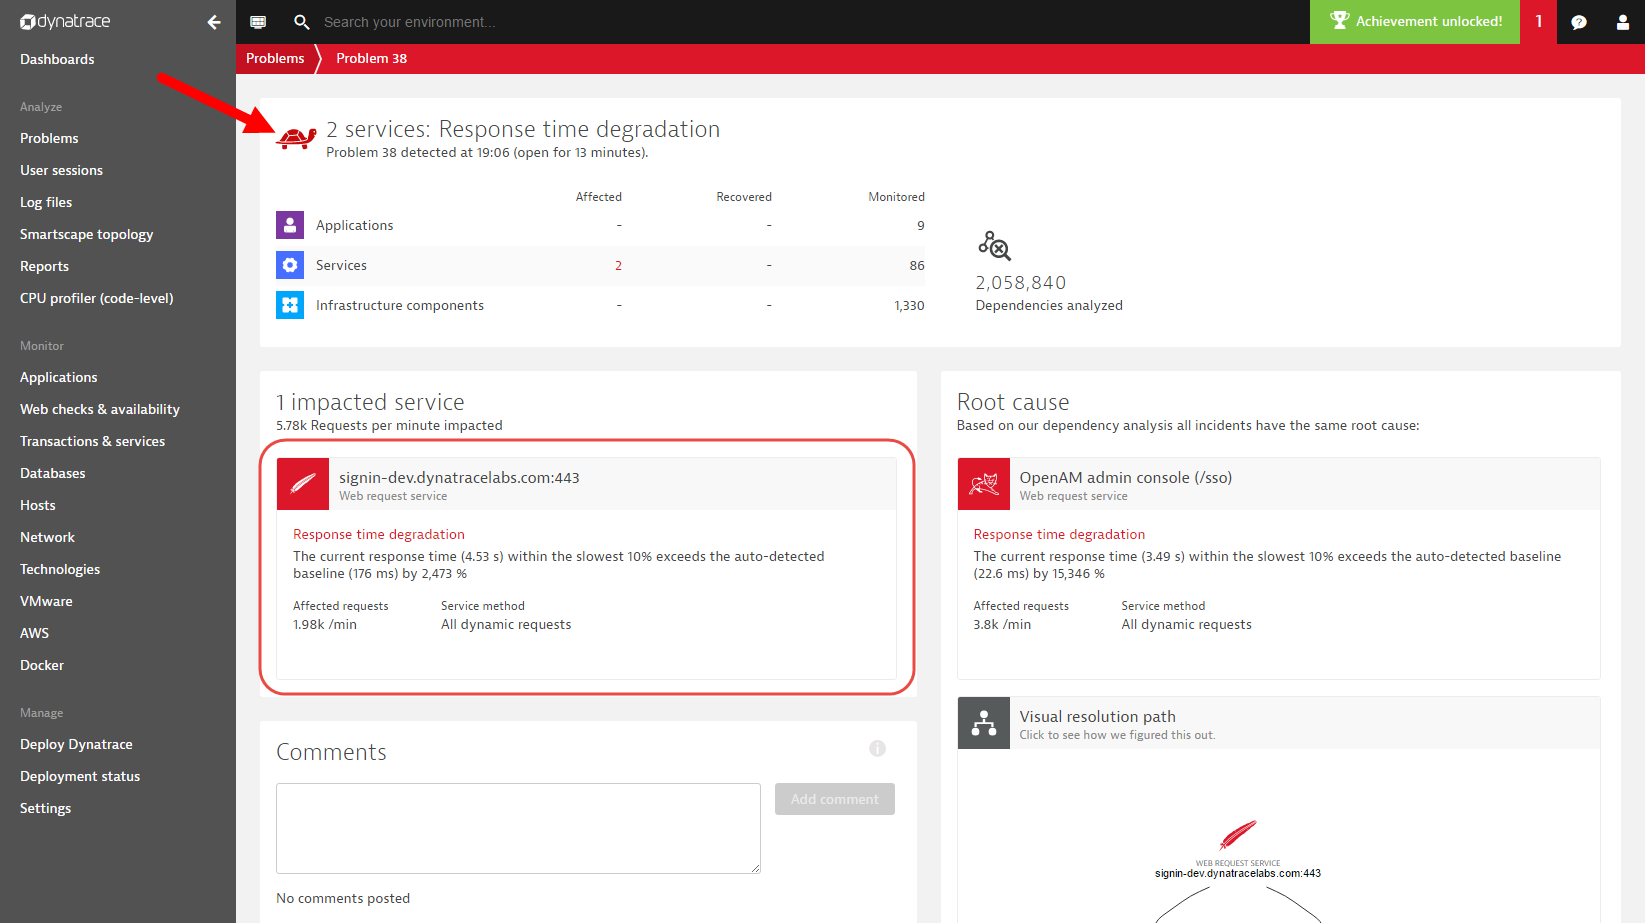
Any problem that causes the performance of an application, service, or database to significantly degrade is automatically classified as a slowdown problem. Depending on the duration of the associated performance degradation, a slowdown problem may result in severe customer impact. Slowdown problem patterns are however not as severe as availability problem patterns, which indicate complete outages of applications or services. Dynatrace automatically detects a wide spectrum of slowdown problems related to web applications, backend services, as well as database services (see slowdown problem example below).
Resource problems

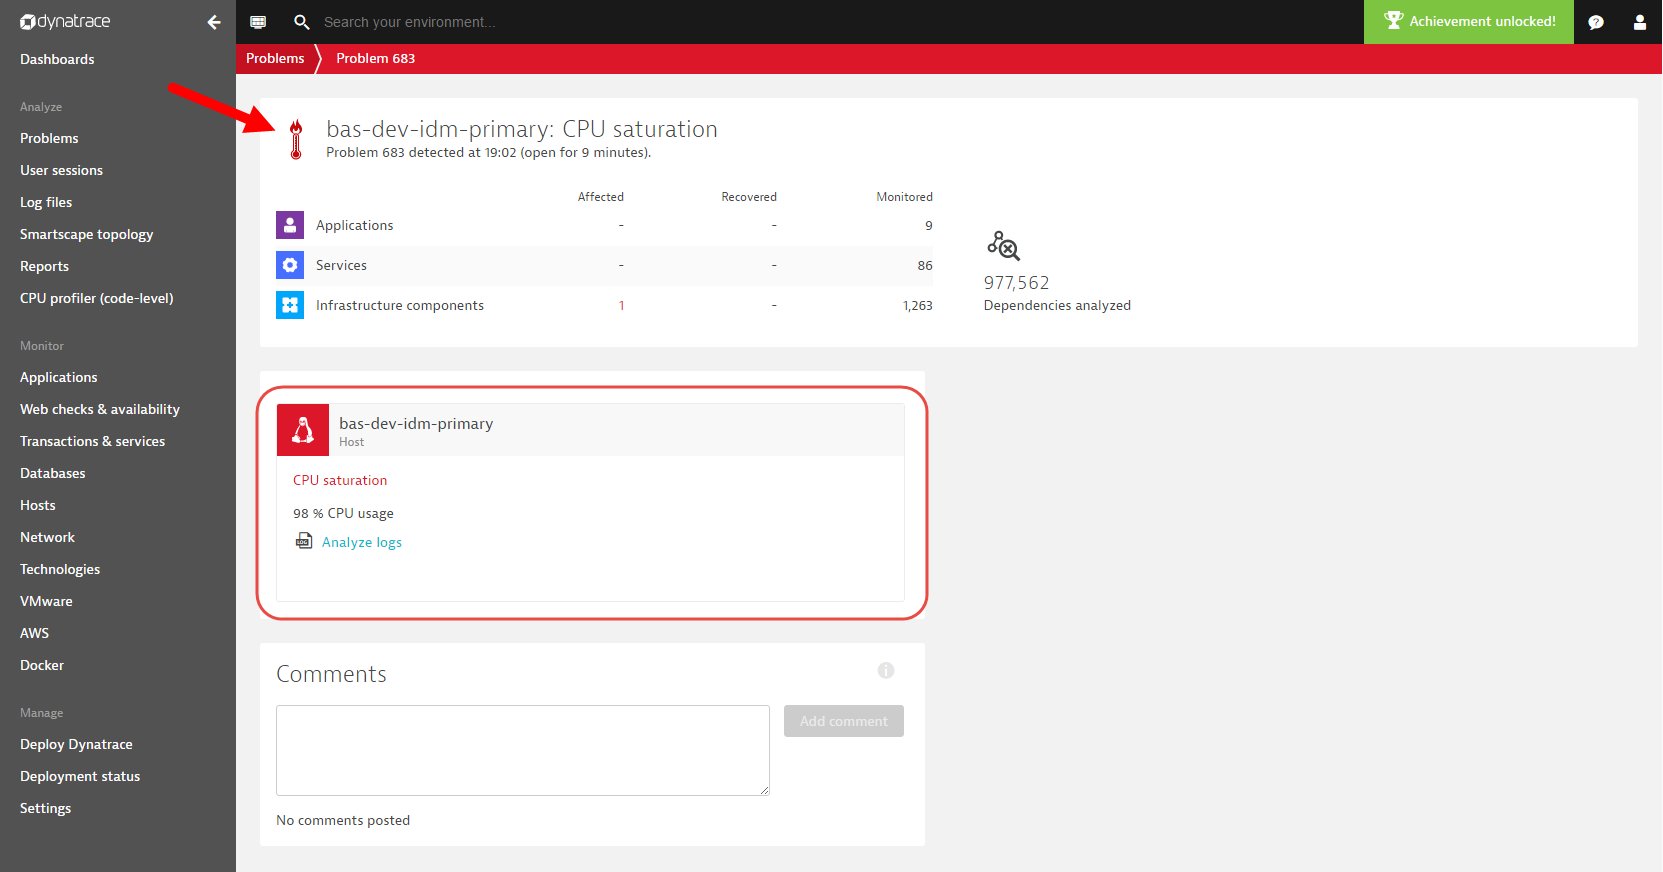
Resource problems are raised when a shortage of a resource in your monitored environment is detected (for example, memory, CPU, or disk space issues). Resource problems are automatically reported by Dynatrace when resource contention is detected and no other component in your environment is experiencing a problem. So, resource problems should be evaluated, but they’re typically not something that requires urgent attention (see example resource problem below).
Filter problems based on severity
We’ve changed some of the icons on the Problems page because Dynatrace now tags each problem with the appropriate severity-classification icon, as shown below. We’ve also introduced a new filter section on the left side of the Problems page to enable you to filter for problems based on severity level.
Spoiler and warning!
One upcoming change related to the new severity levels is a completely redesigned approach to alerting that includes problem notifications for problems based on severity levels. This change will deprecate your existing problem watch settings. Watch settings will be redesigned around severity-level alert profiles that are more flexible and allow for fine-grained delivery and filtering of problem notifications. Unfortunately, you’ll need to manually migrate your personal watch settings into new alert profiles to make this work.
The migration process from watch settings to alerting profiles will begin next month. Of course, we’ll guide each step of the way with a detailed blog post and updated instructions on the Watch settings page.


Looking for answers?
Start a new discussion or ask for help in our Q&A forum.
Go to forum