Many of our customers—the world’s largest enterprises—have embraced the Dynatrace SaaS approach to monitoring, which provides critical business insights powered by AI and automation for globally-distributed, heterogeneous IT landscapes. With Dynatrace SaaS deployments, customers don’t need to concern themselves with scaling the Dynatrace platform or its underlying infrastructure.
Some companies and industries must however comply with privacy rules and regulations that require them to keep their data in a private cloud or on-premises. Dynatrace provides these organizations with the Dynatrace Managed deployment model, which delivers the simplicity of SaaS while allowing customers to maintain control over the environment where their data resides.
We recently extended the pro-active self-monitoring capabilities of Dynatrace Managed, making it easy to ensure the highest availability and proactive management of such installations.
New self-monitoring environment provides out-of-the-box insights and custom alerting
A dedicated self-monitoring Dynatrace environment called Local self-monitoring is now enabled by default on all Dynatrace Managed Clusters. The Local self-monitoring environment collects and aggregates all the self-monitoring metrics that are captured from the other environments on the cluster. The Local self-monitoring environment provides an out-of-the-box dashboard to help you manage cluster utilization while enabling precise observability via proactive data capture.
The new environment also allows you to tailor dashboards and alerting for deeper, proactive insights based on your needs. All Dynatrace Managed monitoring data resides on-premises on your cluster. The self-monitoring environment does not contribute to monitoring consumption or costs. It’s also protected from accidental deletion.
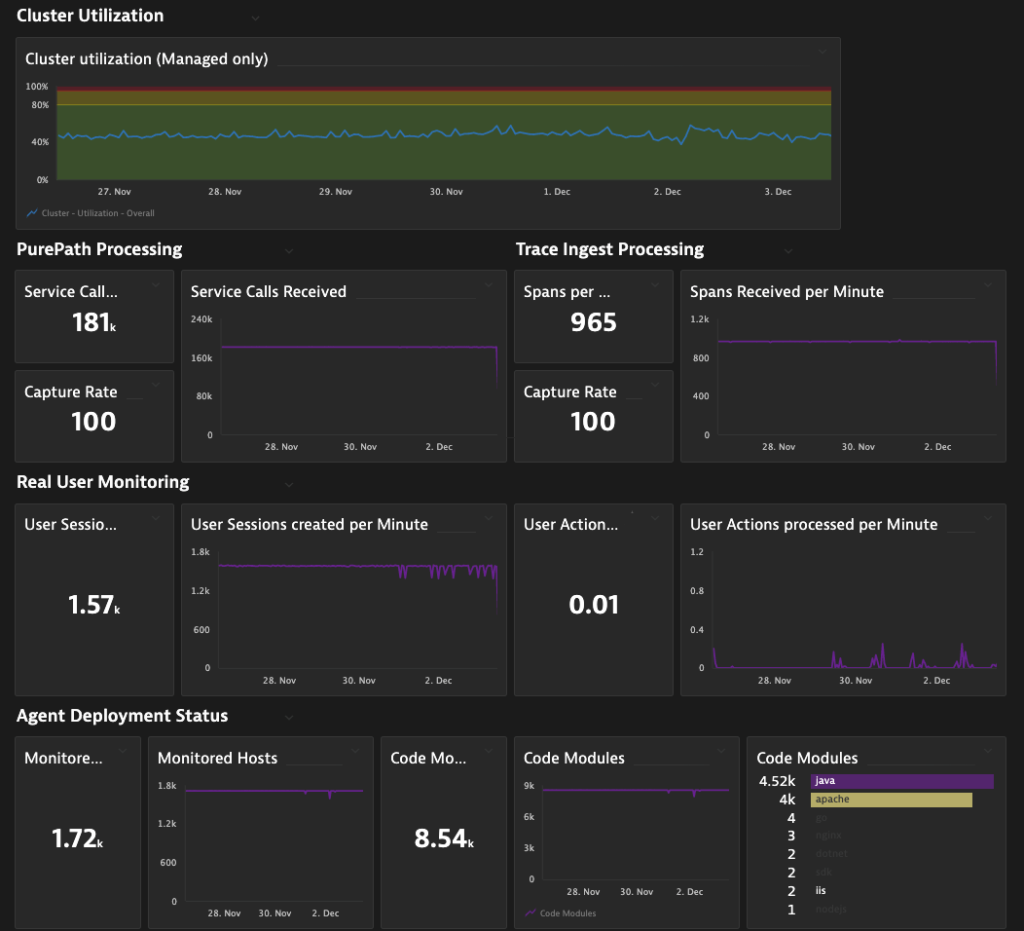
Manage cluster utilization proactively to onboard new applications and handle peaks
The cluster utilization dashboard tiles show you how much additional load the cluster can handle and when you should consider scaling up capacity. For example, a cluster utilization of 50% should allow you to roughly double the currently processed load before the cluster reaches its maximum capacity.
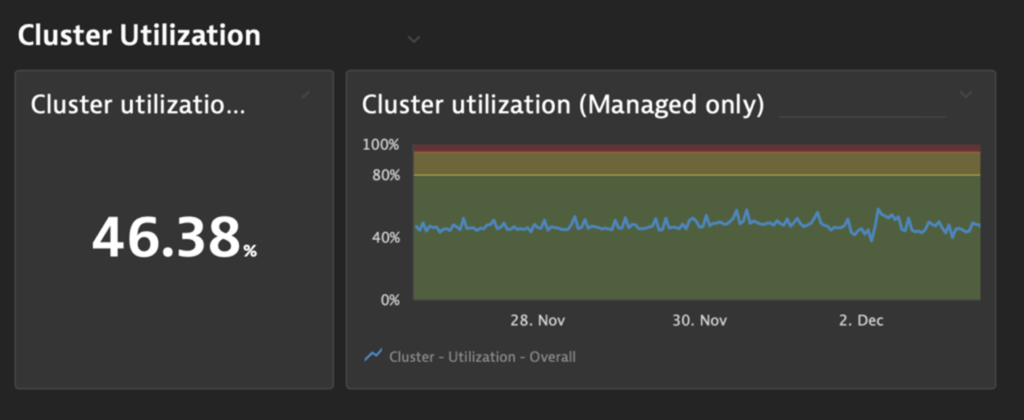
Insights into cluster utilization help you evaluate proper sizing of your Dynatrace Managed Cluster when:
- Planning for additional load: It’s good practice to always have available capacity (green status) in case you need to quickly increase the cluster utilization:
- Green status: If cluster utilization does not exceed the green area, then more monitoring is possible and more OneAgents, log ingest, or other can be added.
- Yellow status: When utilization reaches the yellow area, it’s time to consider scaling up the capacity of the cluster for additional load.
- Red status: When utilization reaches the red area, the cluster is at maximum capacity. Scaling the cluster is highly recommended.
- Planning for daily and seasonal peaks: Proper sizing based on recurring or seasonal peaks, rather than average utilization, ensures that the cluster can handle the load.
- Onboarding new applications: The self-monitoring dashboard immediately shows you the impact of newly added applications. Every new application monitored with Dynatrace increases utilization of the cluster at different levels (for example, a new application might generate more service calls or ingested metrics than your existing applications).
Proactively ensure high fidelity data
While the cluster utilization tiles display the utilization of your cluster, Dynatrace Managed also implements mechanisms that assure the healthy operation of your cluster even when it becomes overloaded. To do this, Dynatrace reduces the capture rate of incoming data when your cluster’s utilization reaches the red status.
In this way, cluster utilization might show healthy operation (green status) when only 80% of the service calls are captured and the other 20% are dropped to prevent overload.
The new self-monitoring dashboard provides all cluster utilization information in context with other metrics and enables you to consider the current data capture and drop rates:
Monitoring trace-ingestion processing ensures precise distributed tracing
When the capture rate for metrics is at or near 100%, data capture is in progress and all incoming data is covered.
If the Service calls received capture rate drops significantly below 100%, the cluster is most likely overloaded. In such a case, you should inspect the cluster utilization to see if it increased to critical levels before the capture rate was reduced. If that is the case, it’s time to scale up the capacity of your cluster. If not, deeper analysis is required.


Capture all real user sessions to enable Dynatrace Digital Experience and Business Analytics use cases
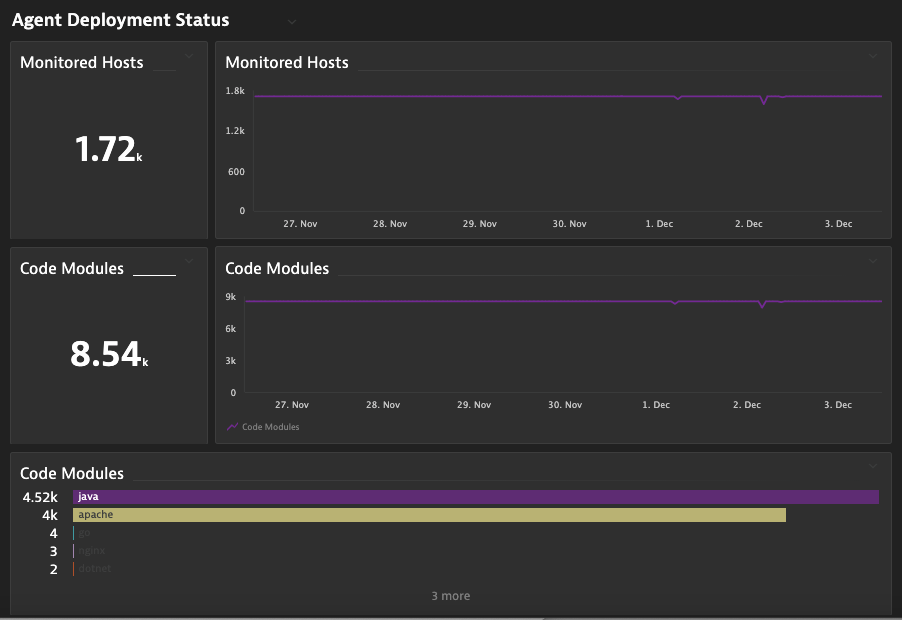
Real User Monitoring provides information about all user sessions and user actions that are monitored in the Dynatrace Managed environments on your cluster. Especially for Business Analytics use cases or Digital Experience investigations, it’s crucial to ensure that all relevant sessions are captured. The Local-Self-Monitoring dashboard provides information on the volume of individual data points but, more importantly, it shows you if any data was dropped from processing.
The new self-monitoring dashboard enables you to see if cluster utilization increased to critical levels before the capture rate was reduced. In such cases, it’s required that you scale up the capacity of your cluster.
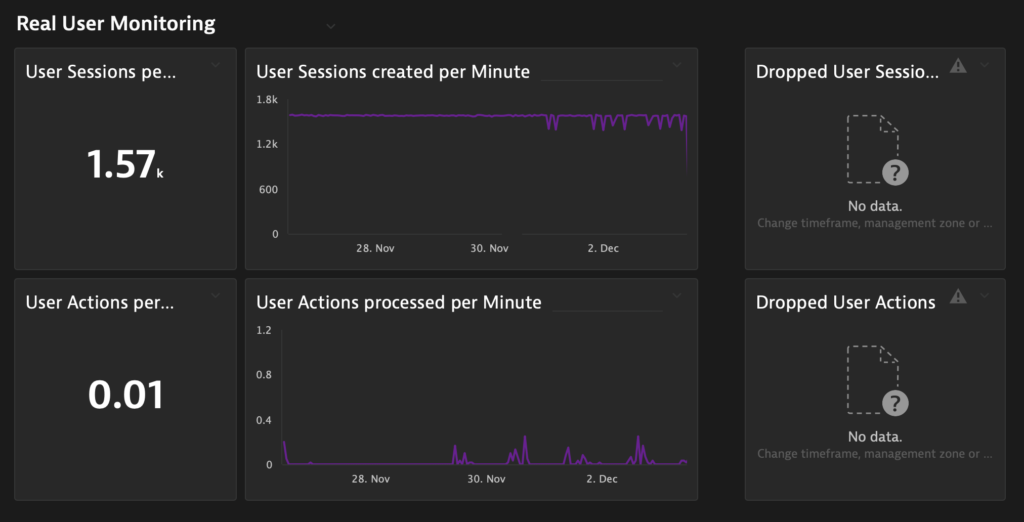
Track observability coverage across heterogenous environments with OneAgent deployment status
The Monitored Hosts metric shows the number of hosts monitored by OneAgent OS modules (“OS agents”) for the specific time frame (pre-selected are 7 days) across all environments. The Code Modules metric show the deployment status of the OneAgent code modules.
A steady number of monitored hosts and modules prove that all Dynatrace Agents were able to report to the Dynatrace cluster. A significant drop in these metrics might indicate a problem, in which case you should contact Dynatrace ONE to determine the root cause.
Ready to enable the new self-monitoring dashboard?
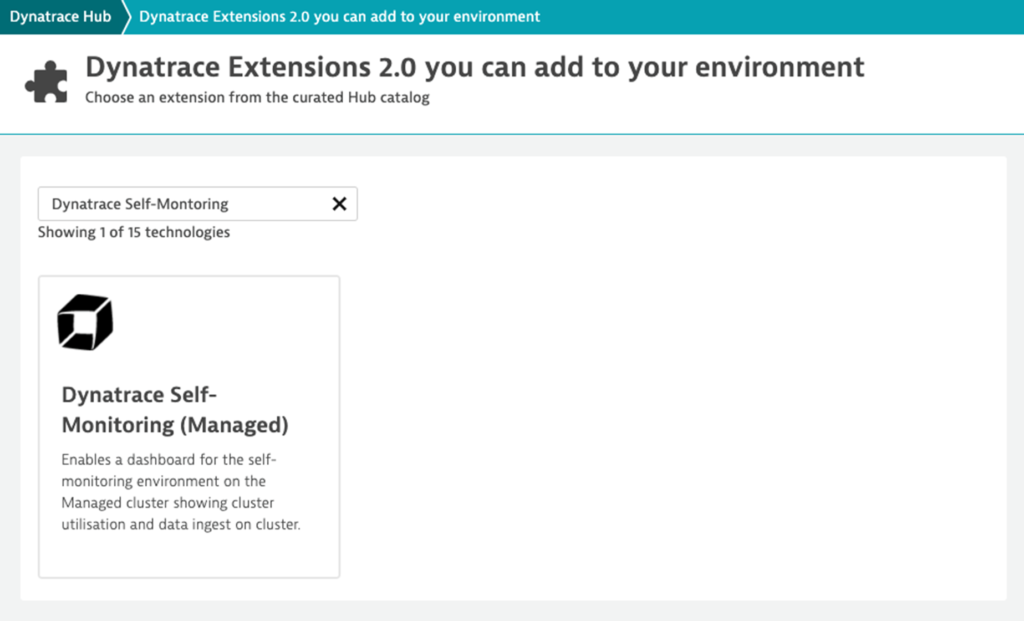
To benefit from the new self-monitoring dashboard (available with the release of Dynatrace Managed 1.230), open your Dynatrace Managed self-monitoring environment and select Dynatrace Hub from the menu. Then select the Extensions 2.0 in your environment tab and look for the Dynatrace Self-Monitoring (Managed) extension, as shown below. Add the extension to your environment.
Get proactive insights now
If your organization’s corporate policies require data to be kept in a private cloud or on-premises, you can benefit from advanced observability capabilities. Consider signing up for your Dynatrace free trial today!
- For more information about self-monitoring, see Self-monitoring documentation.
- For a description of the Local self-monitoring environment on your Dynatrace Managed cluster, see Local self-monitoring environment.
- For more details and examples on how to use the new self-monitoring metrics to monitor a Dynatrace environment or ActiveGate, see Self-monitoring metrics documentation.
- For a demo of the new Local self-monitoring environment, watch Self-Monitoring for Dynatrace Managed: Proactive Insights into your Observability Platform (Dynatrace Observability Clinic, YouTube).
- Dynatrace ONE Premium customers can request access to a Dynatrace SaaS self-monitoring environment to get deeper insights into the health of their Dynatrace Managed Cluster.
Don’t forget to share your feedback with us by posting your questions and comments in our Dynatrace Community feedback channel.


Looking for answers?
Start a new discussion or ask for help in our Q&A forum.
Go to forum