Automated business processes are the heart of modern organizations, and IT operations teams play an essential role in ensuring end-to-end process efficiency.
Recent platform enhancements in the latest Dynatrace, including business events powered by Grail™, make accessing the goldmine of business data flowing through your IT systems easier than ever. One of the more popular use cases is monitoring business processes, the structured steps that produce a product or service designed to fulfill organizational objectives. By treating processes as assets with measurable key performance indicators (KPIs), business process monitoring helps IT and business teams align toward shared business goals. This collaboration increases process efficiency and improves customer satisfaction by identifying opportunities for process improvement and detecting process anomalies in real time.
Business process monitoring leverages business events, a new data type designed to support the real-time accuracy and long-term granularity demands common to business use cases. Business events can come from many sources, including OneAgent®, external business systems, RUM sessions, or log files. Of particular note, OneAgent can now extract business data from in-flight application payload, prioritized to ensure the lossless precision that business use cases demand. OneAgent business events require no code changes, just a simple configuration to define capture rules. Business events are automatically enriched with Smartscape® topology context, connecting them to their source systems and applications for effective BizOps collaboration.
The Business Flow app
Business Flow, built with AppEngine, simplifies the configuration, monitoring, and analysis of business processes. Business Flow uses business events to define and track each process step or milestone. Correlation IDs—an order number, transaction ID, or any unique identifier—connect steps to create an end-to-end business flow that can span hours, days, weeks, or longer.
Business Flow reports four KPIs:
- Flows completed
- Business exceptions or process errors
- Average process completion time
- A configurable business performance indicator such as revenue, extracted from a business event.
Let’s examine a few practical business process monitoring examples.
Order fulfillment
In this example, an e-commerce company wants to track its order fulfillment business process. Important metrics include end-to-end measures of delay in tracking an order fulfillment service level goal and delay between each step to highlight anomalies and identify opportunities for process improvement. While the process includes many steps, the company started by tracking three milestone steps: order placed, order shipped, and order delivered.
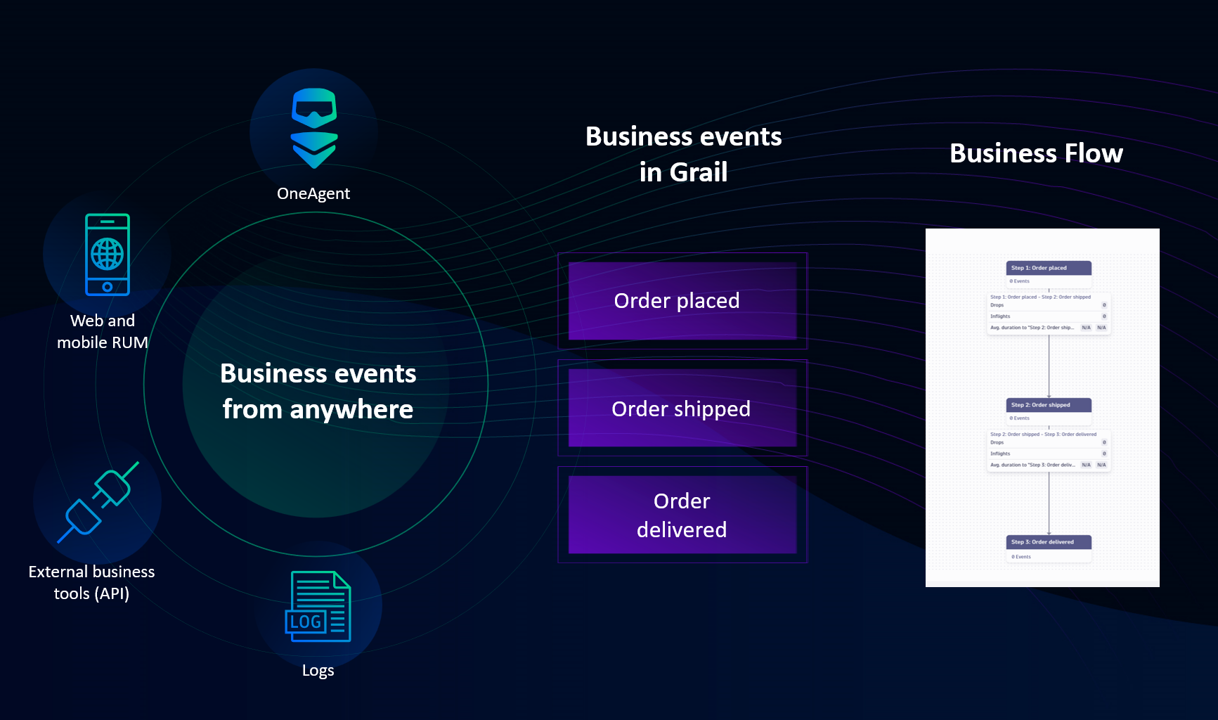
Getting started is simple.
- Define a business event for each milestone step. The event source determines the configuration steps; see our business analytics documentation for details.
- In Business Flow, choose a configured business event to represent each step.
- Choose an attribute from a business event (for example, order_amount) to represent the business flow KPI.
- Choose an attribute common to each business event (for example, order_id) as the correlation ID.
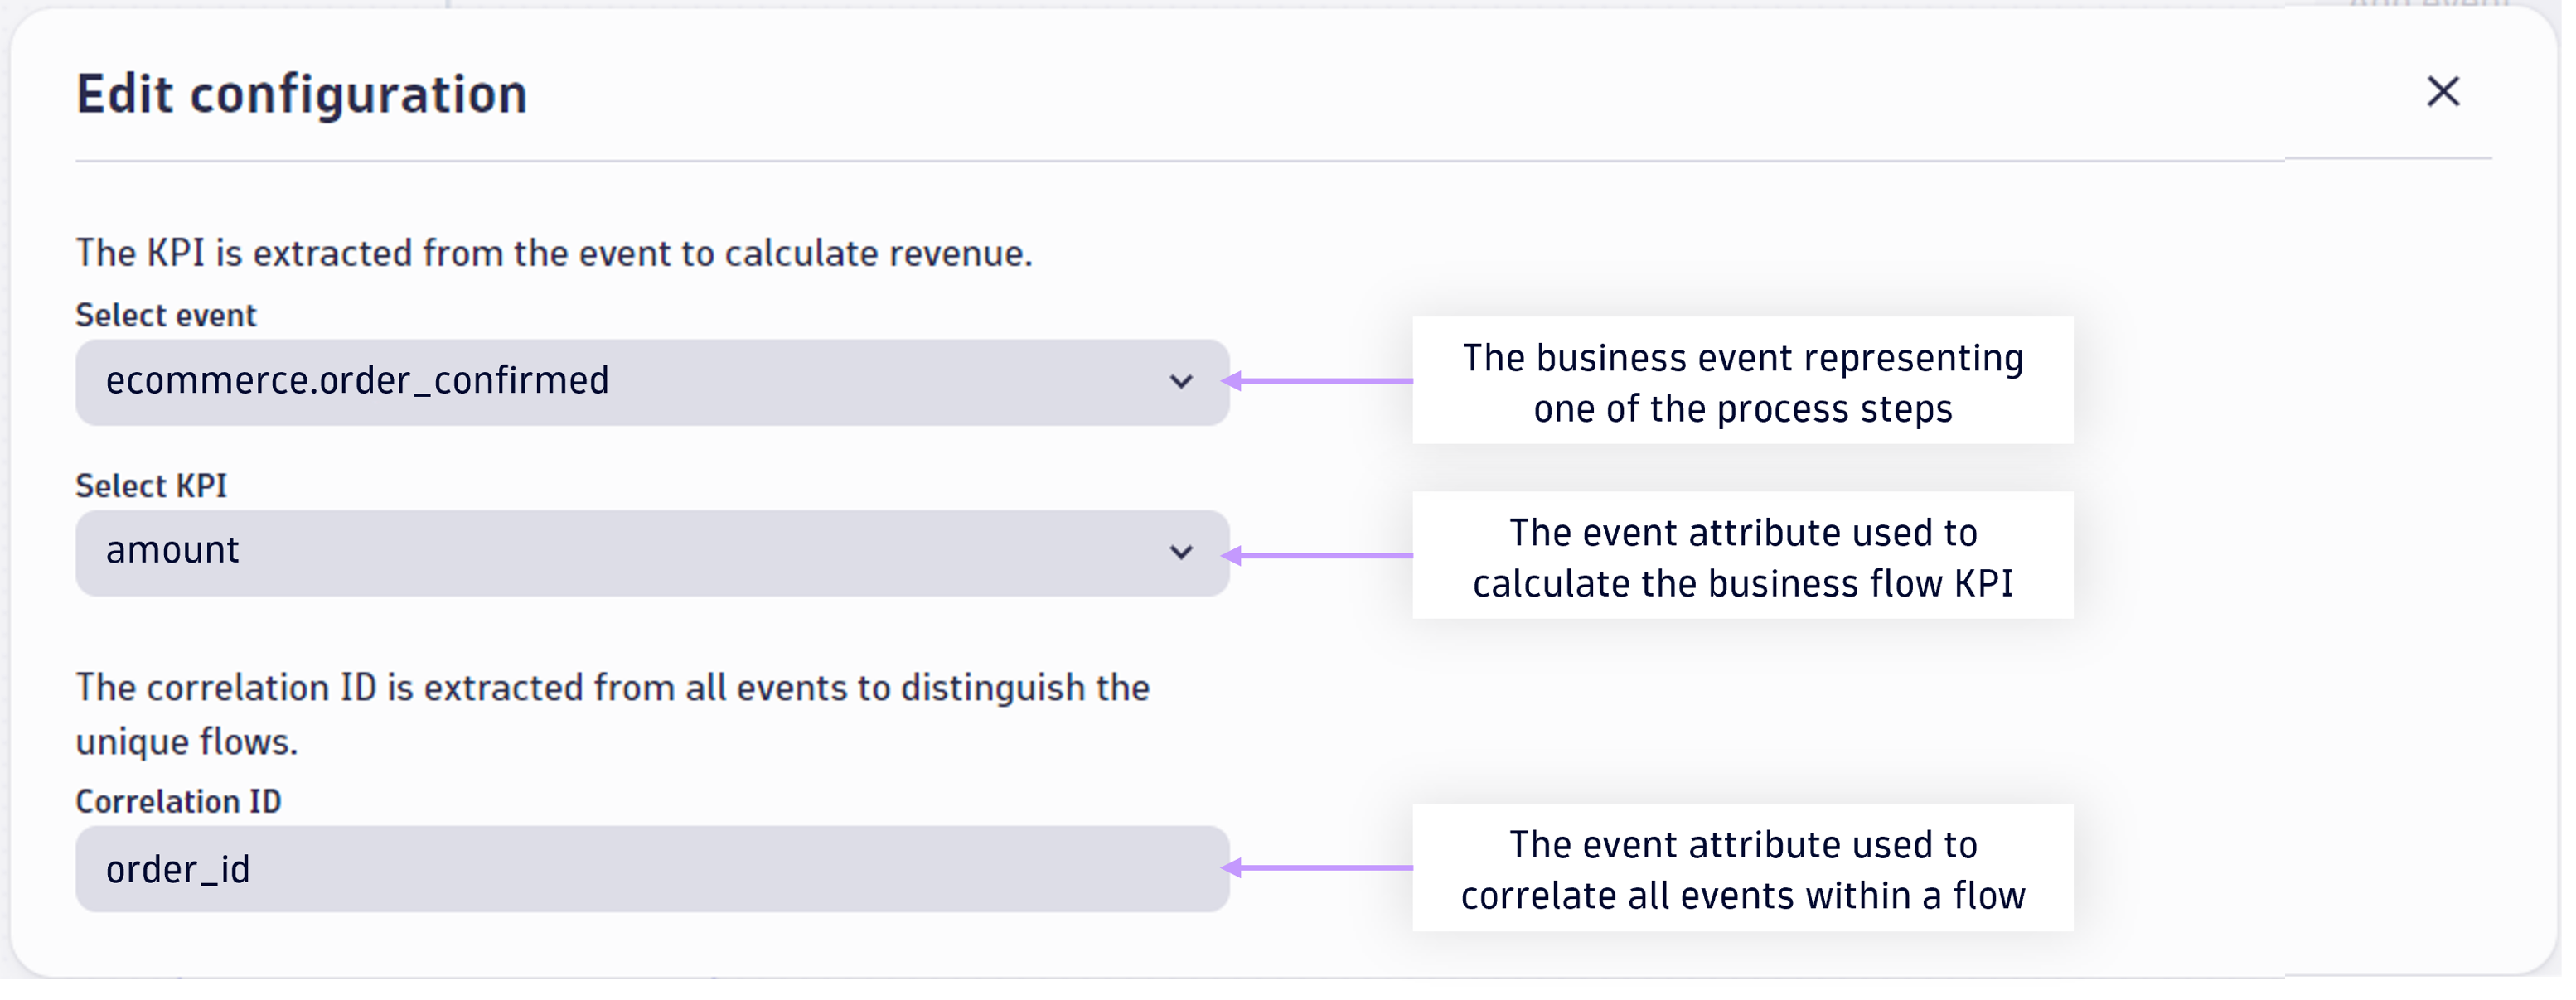
Configure the correlation ID and business KPI for Business Flow.
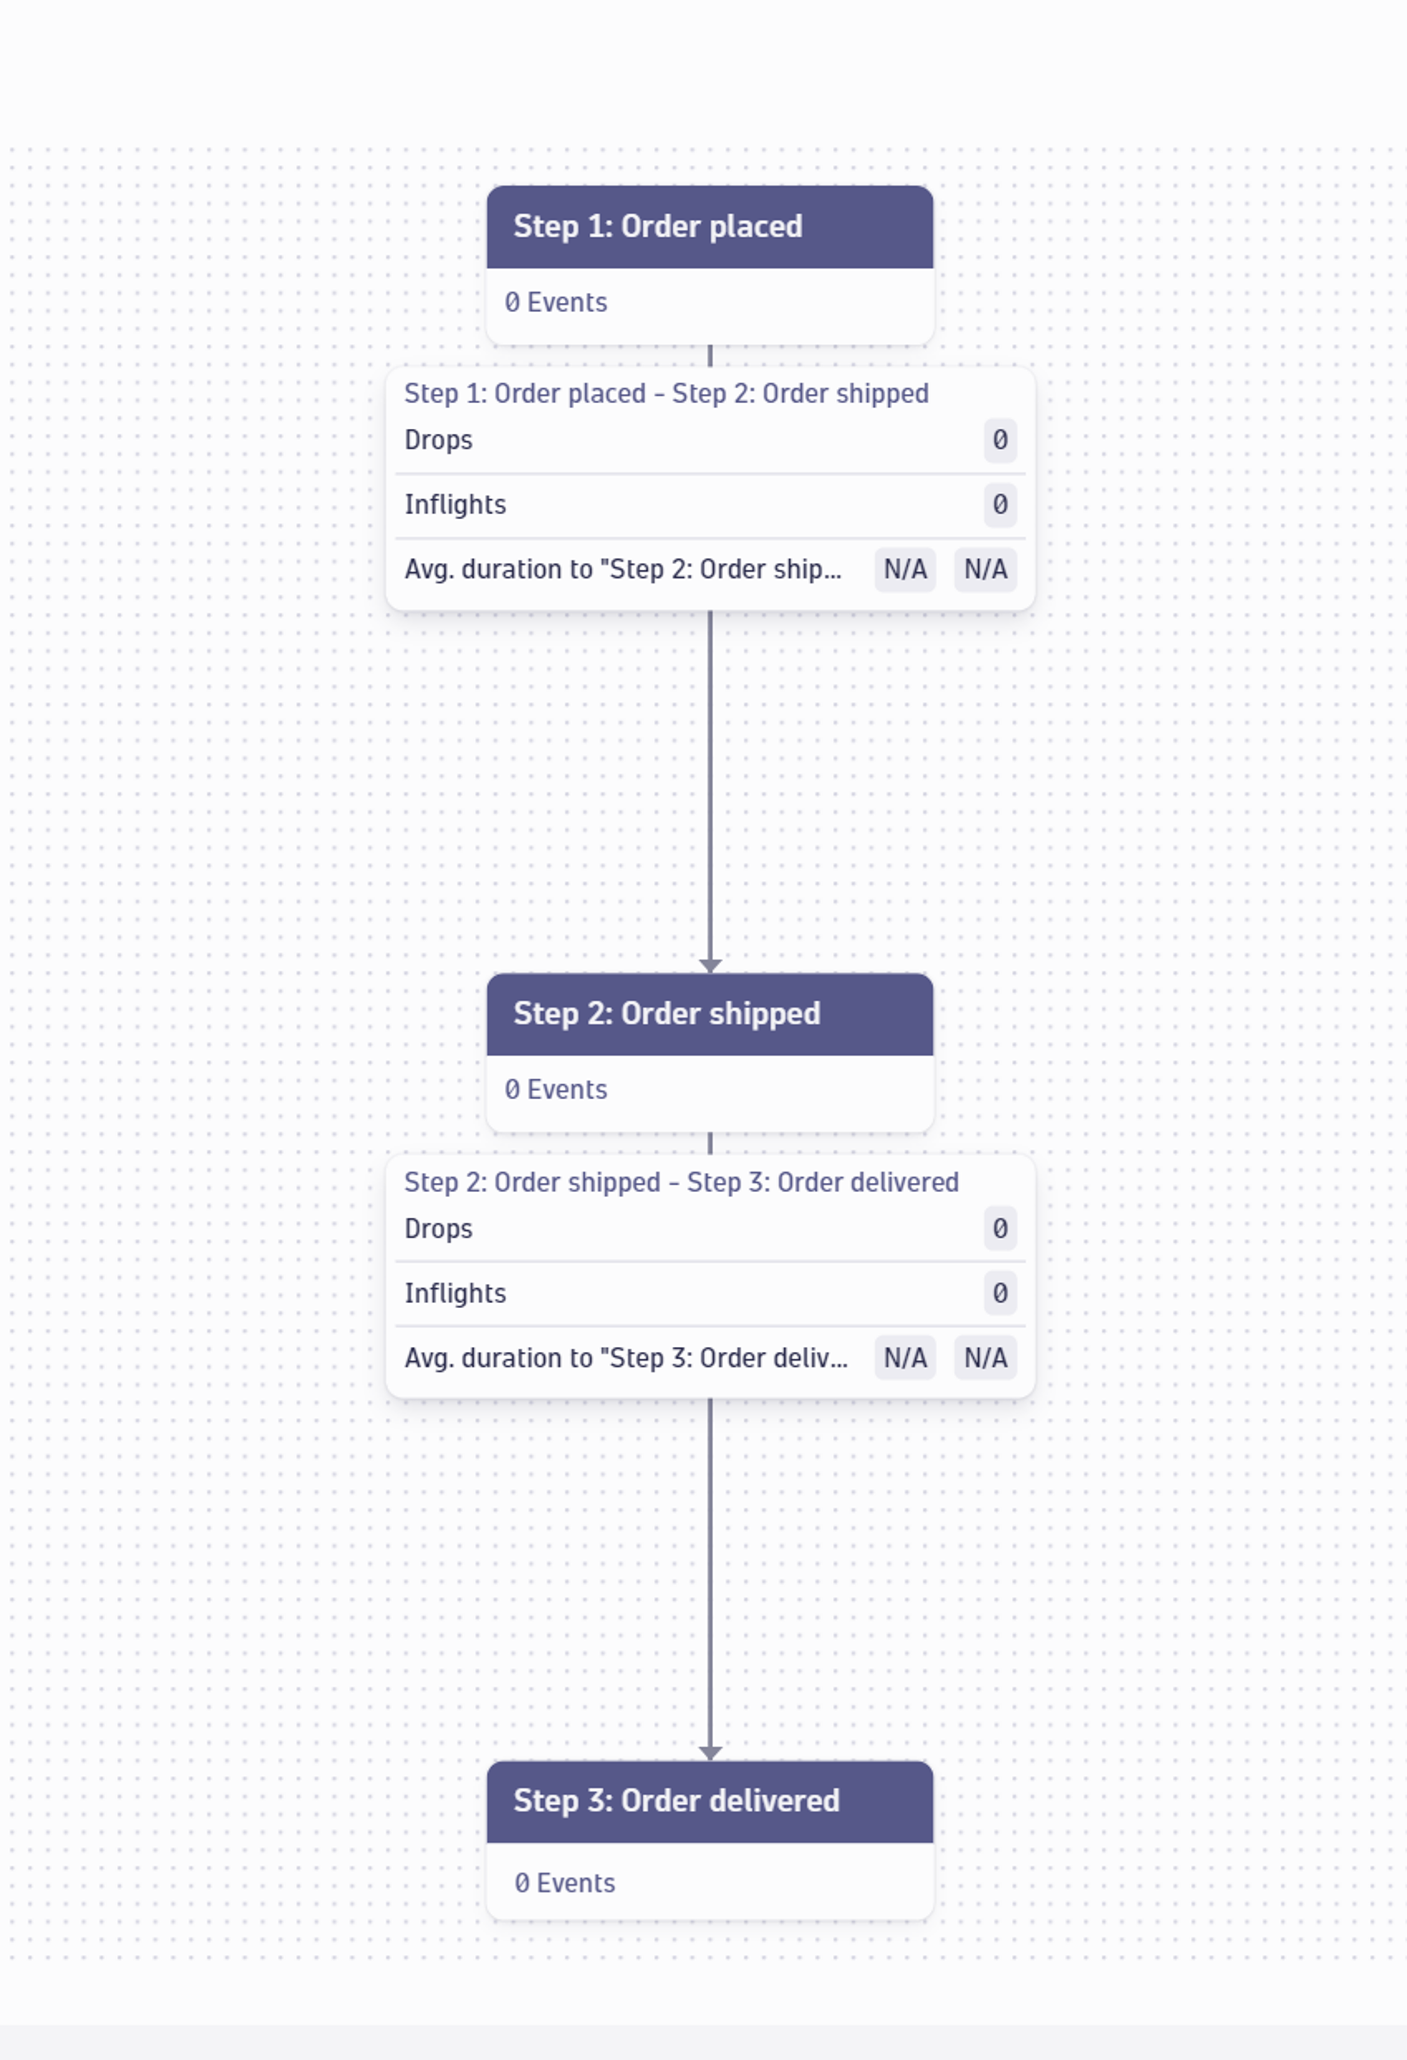
Real-time business process monitoring helps IT and business teams track process performance, detect process anomalies, and optimize process inefficiencies to ensure customer satisfaction and business outcomes.

Business process conversion funnels
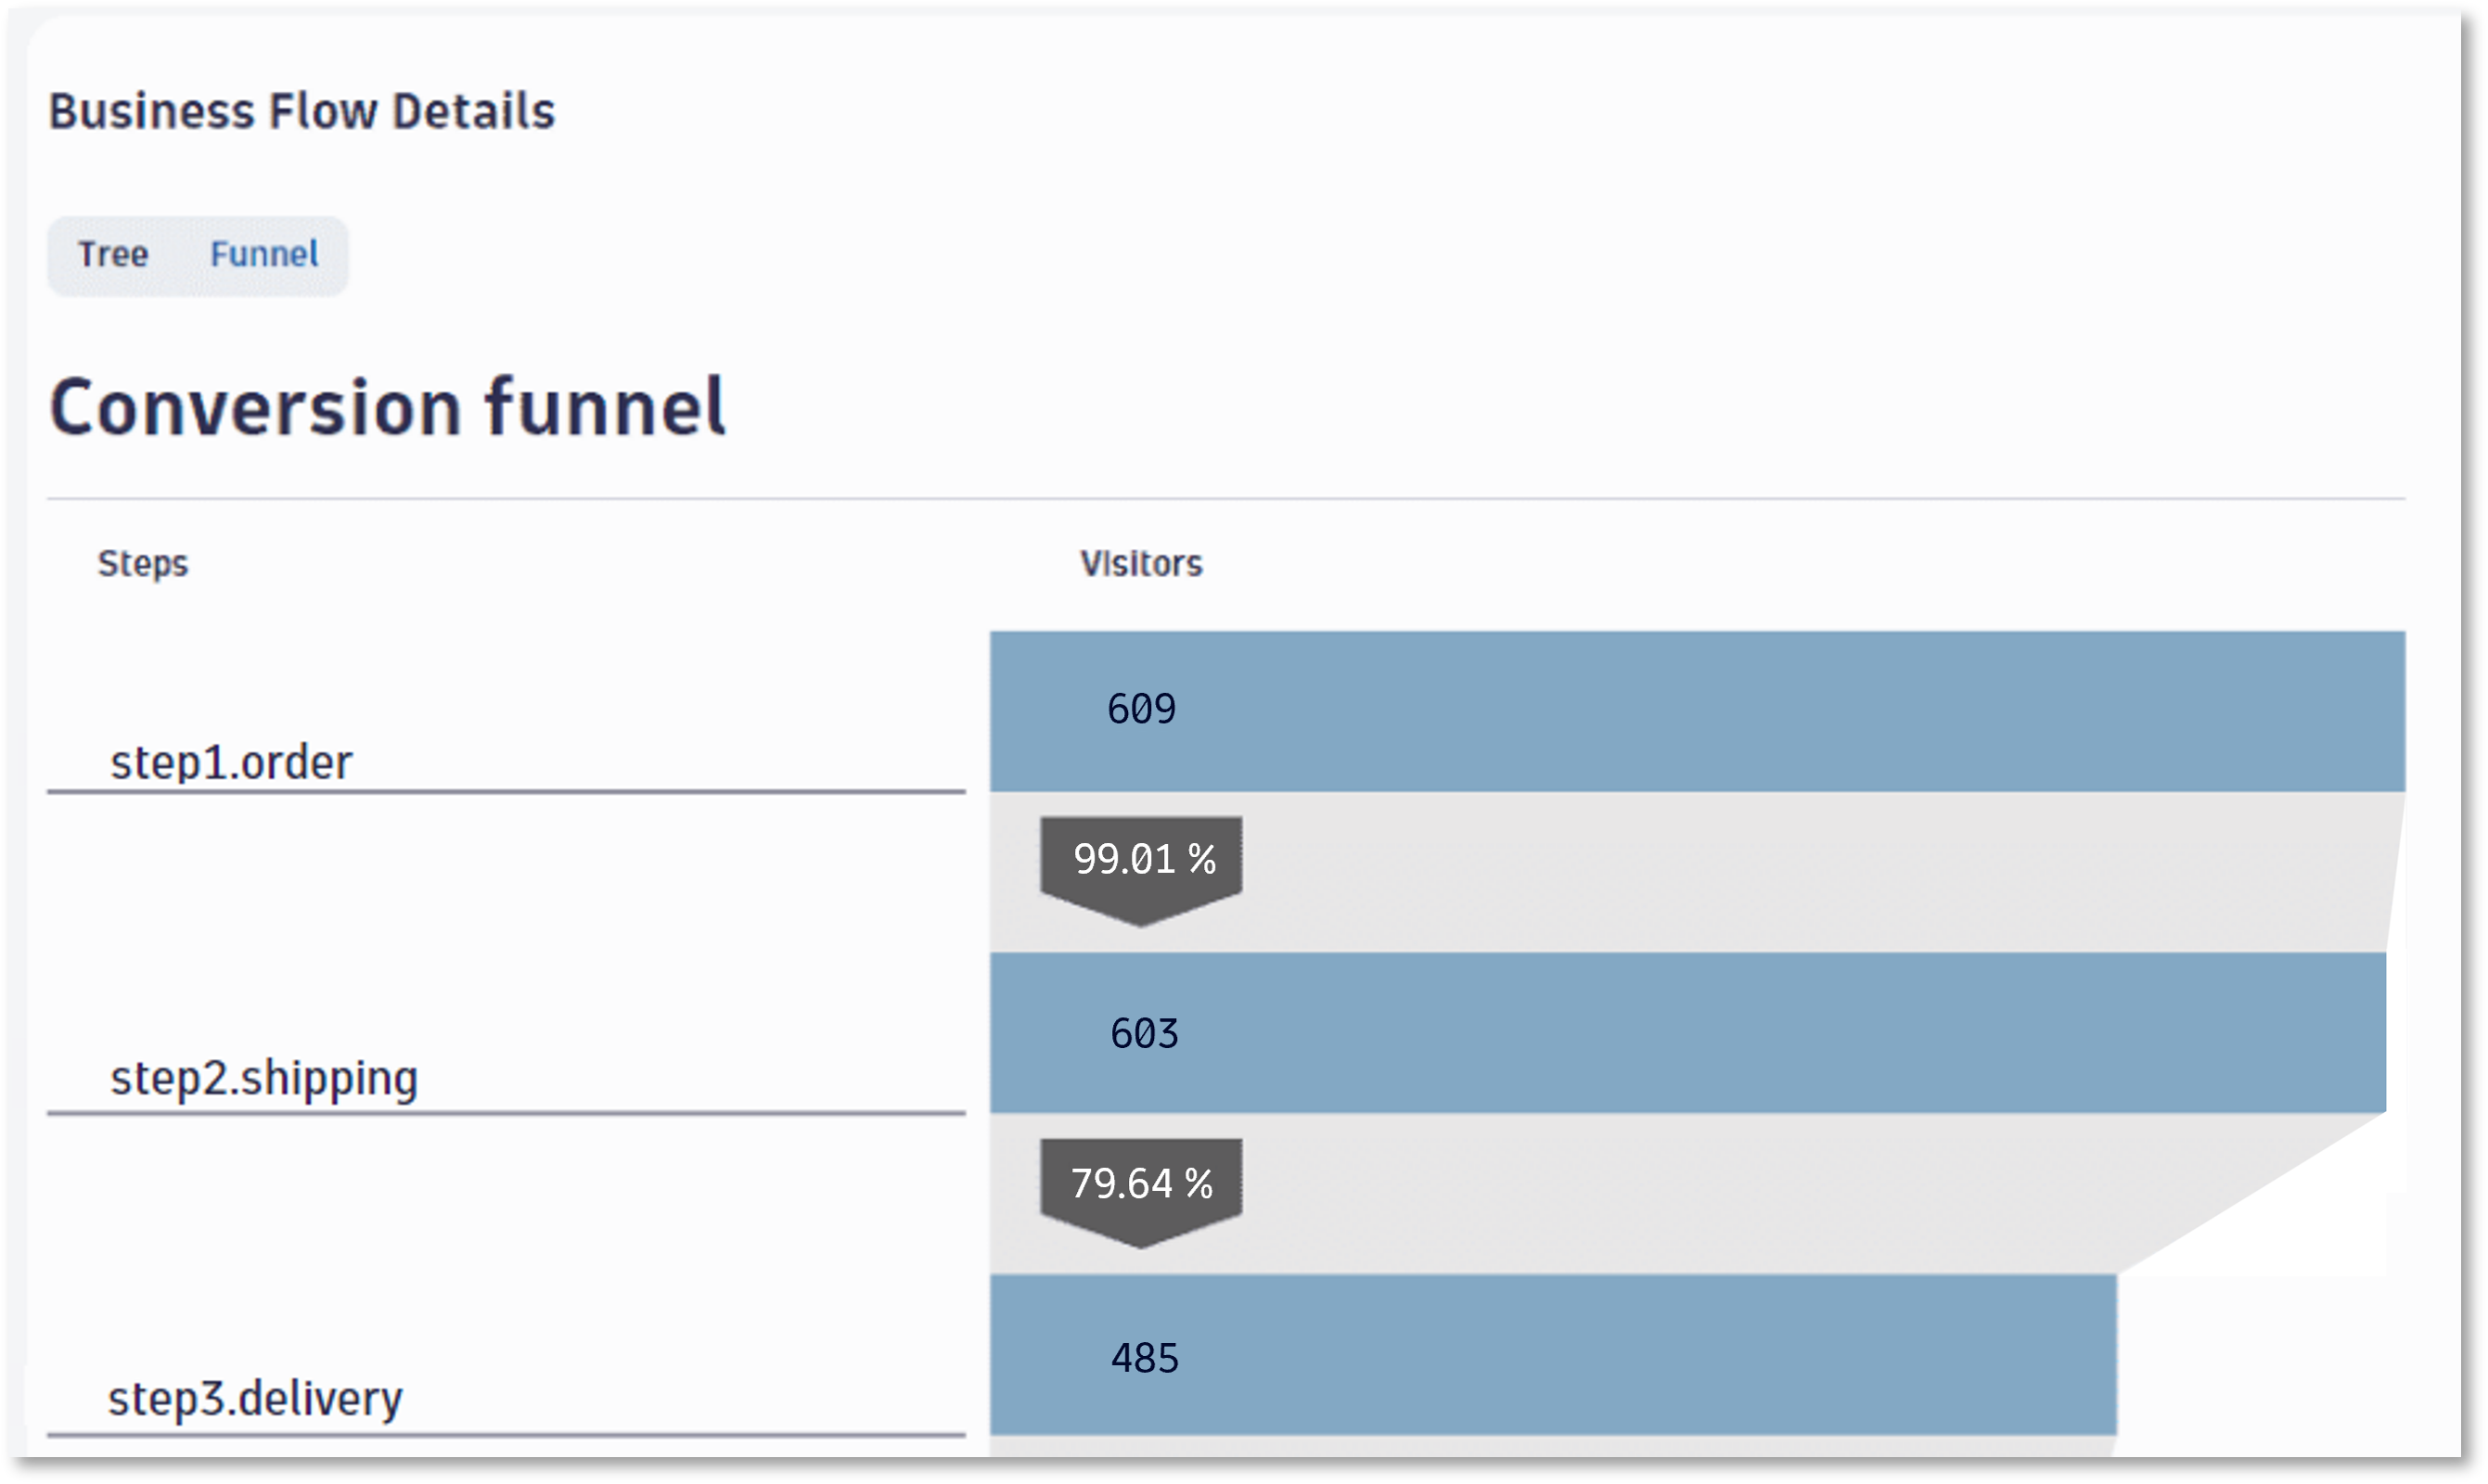
In our e-commerce example, there’s an implied expectation that every order placed will be delivered; only a process anomaly would result in a lost package, and process efficiency might focus on improving fulfillment time. Some business processes behave like conversion funnels, with expected attrition at each step. A loan application process is an example; not all customers who apply for a loan will commit, and delays in the approval process might result in increased abandons. It’s easy to switch the business process display from the tree view to a funnel view.
To get started with Business Flow, add the app from Dynatrace Hub and follow the setup guide.

Use DQL to monitor business processes
Business Flow is built with AppEngine, designed to simplify business process monitoring, in part by masking the underlying queries. For most use cases, it’s the best starting point for process observability. There are also cases where dashboards or alert integrations are important, often as complements to using the Business Flow app. The following example examines the DQL used to build a custom dashboard for a major French B2B food company to monitor five critical steps in a production line. We provide a Notebook for you to follow along in your Dynatrace tenant; you can download the Notebook from GitHub and upload it to your tenant. The Notebook includes static business event data to help you examine the DQL shown in the following examples.
The Dynatrace Query Language (DQL) we use to monitor the production line process generates a tabular report detailing the progress of individual orders in five distinct steps.
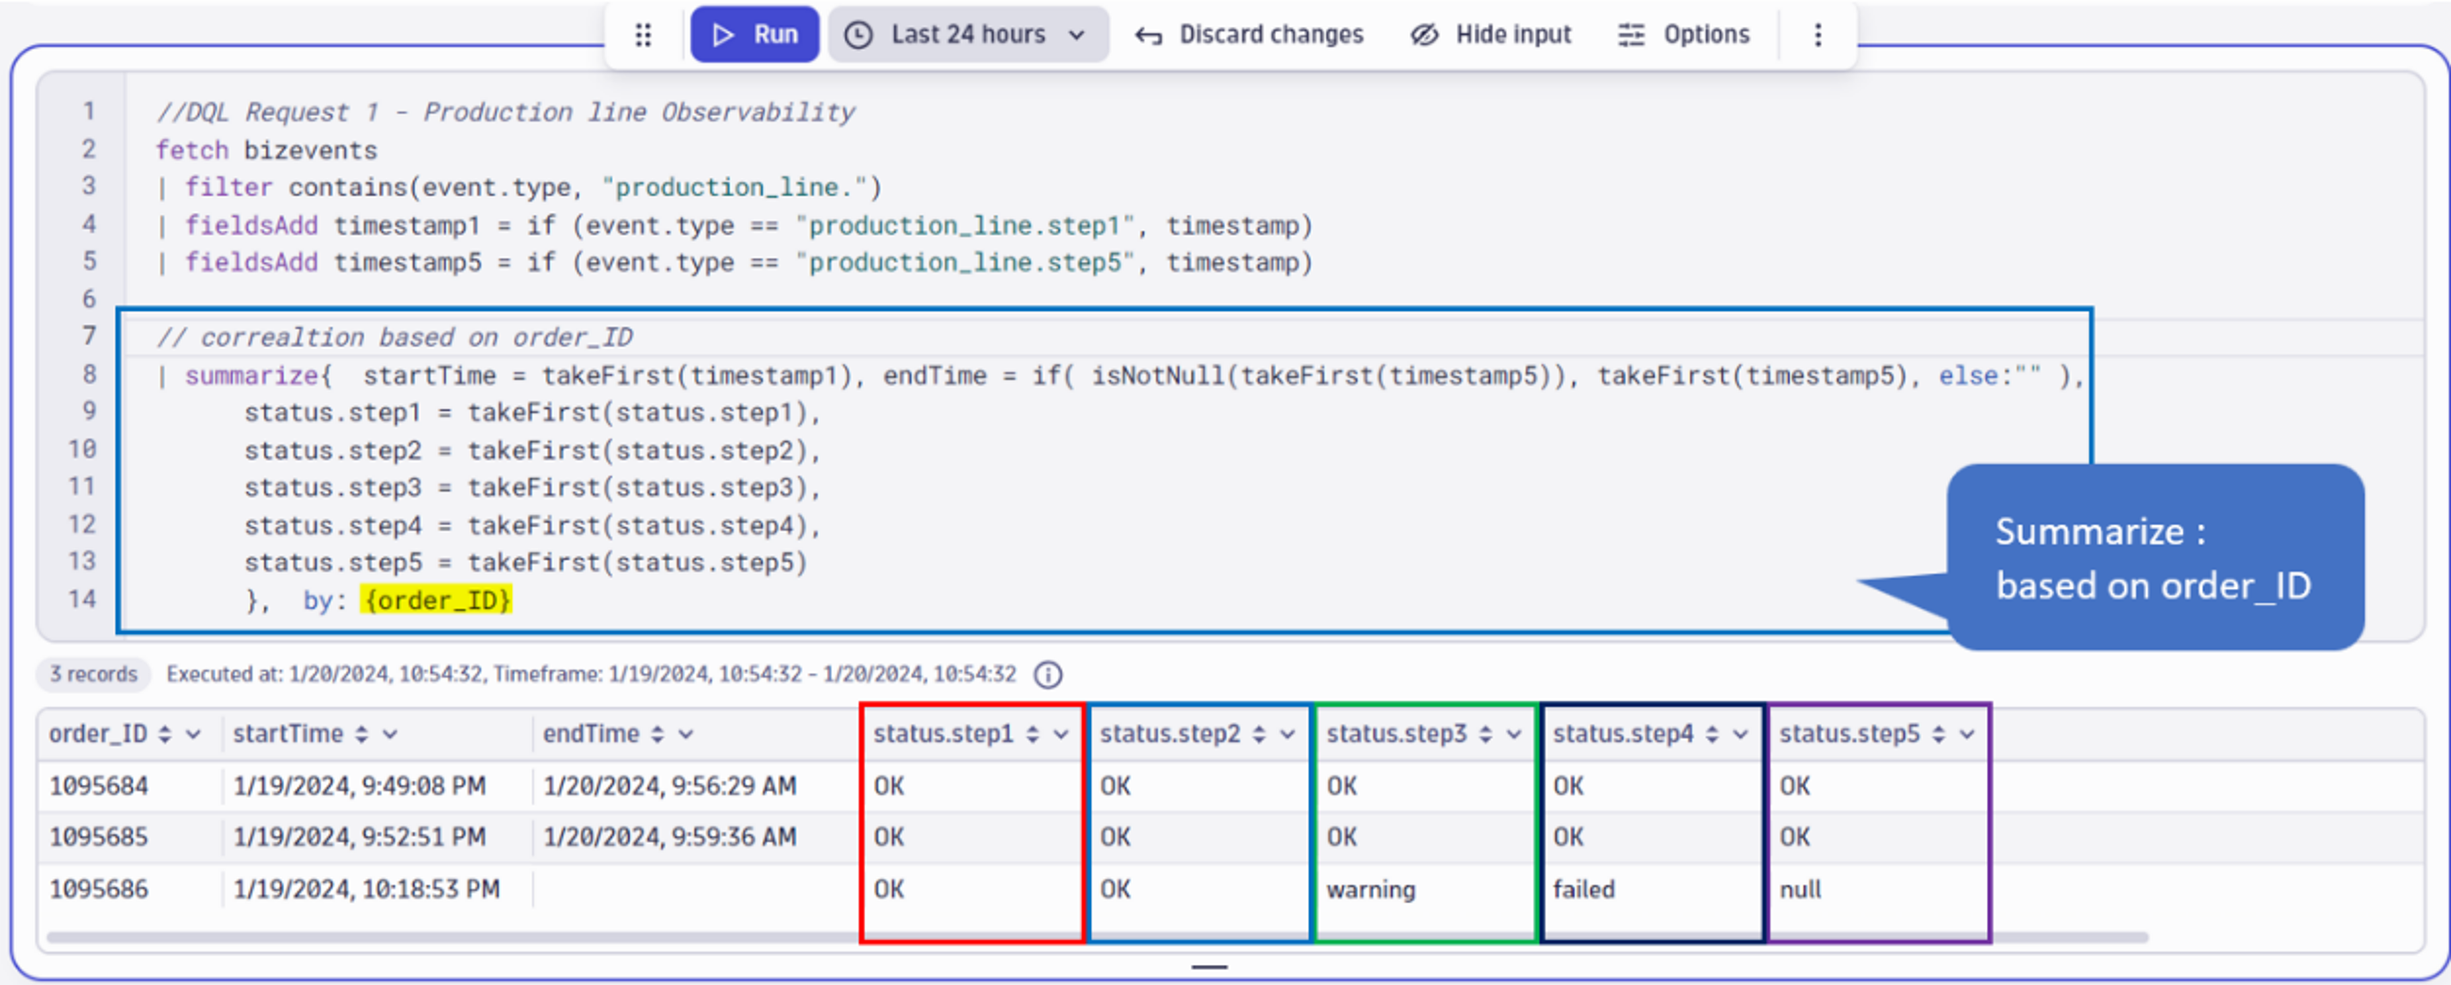
The DQL for the five-step production process is relatively simple, using order_ID within the summarize command to correlate all five steps.
Next, we can consider the case of a major online gaming company; their goal is to minimize the time between a win notification and the corresponding payout to keep the player engaged. Their use case is more complex due to different correlation IDs. Despite the differing IDs, we can use a simple DQL query to measure the delay between a win notification and the associated online payment. With this simple process monitoring solution, the company can manage its commercial commitment to keep the payment delay below a predefined threshold.
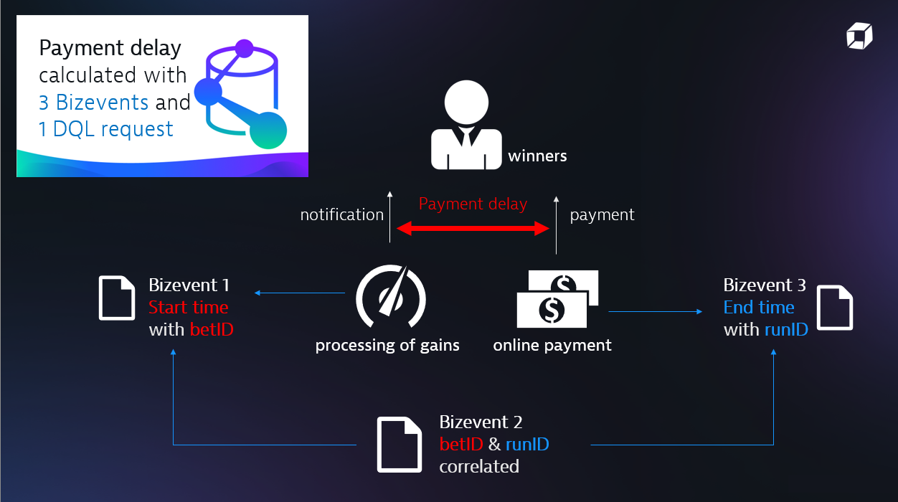

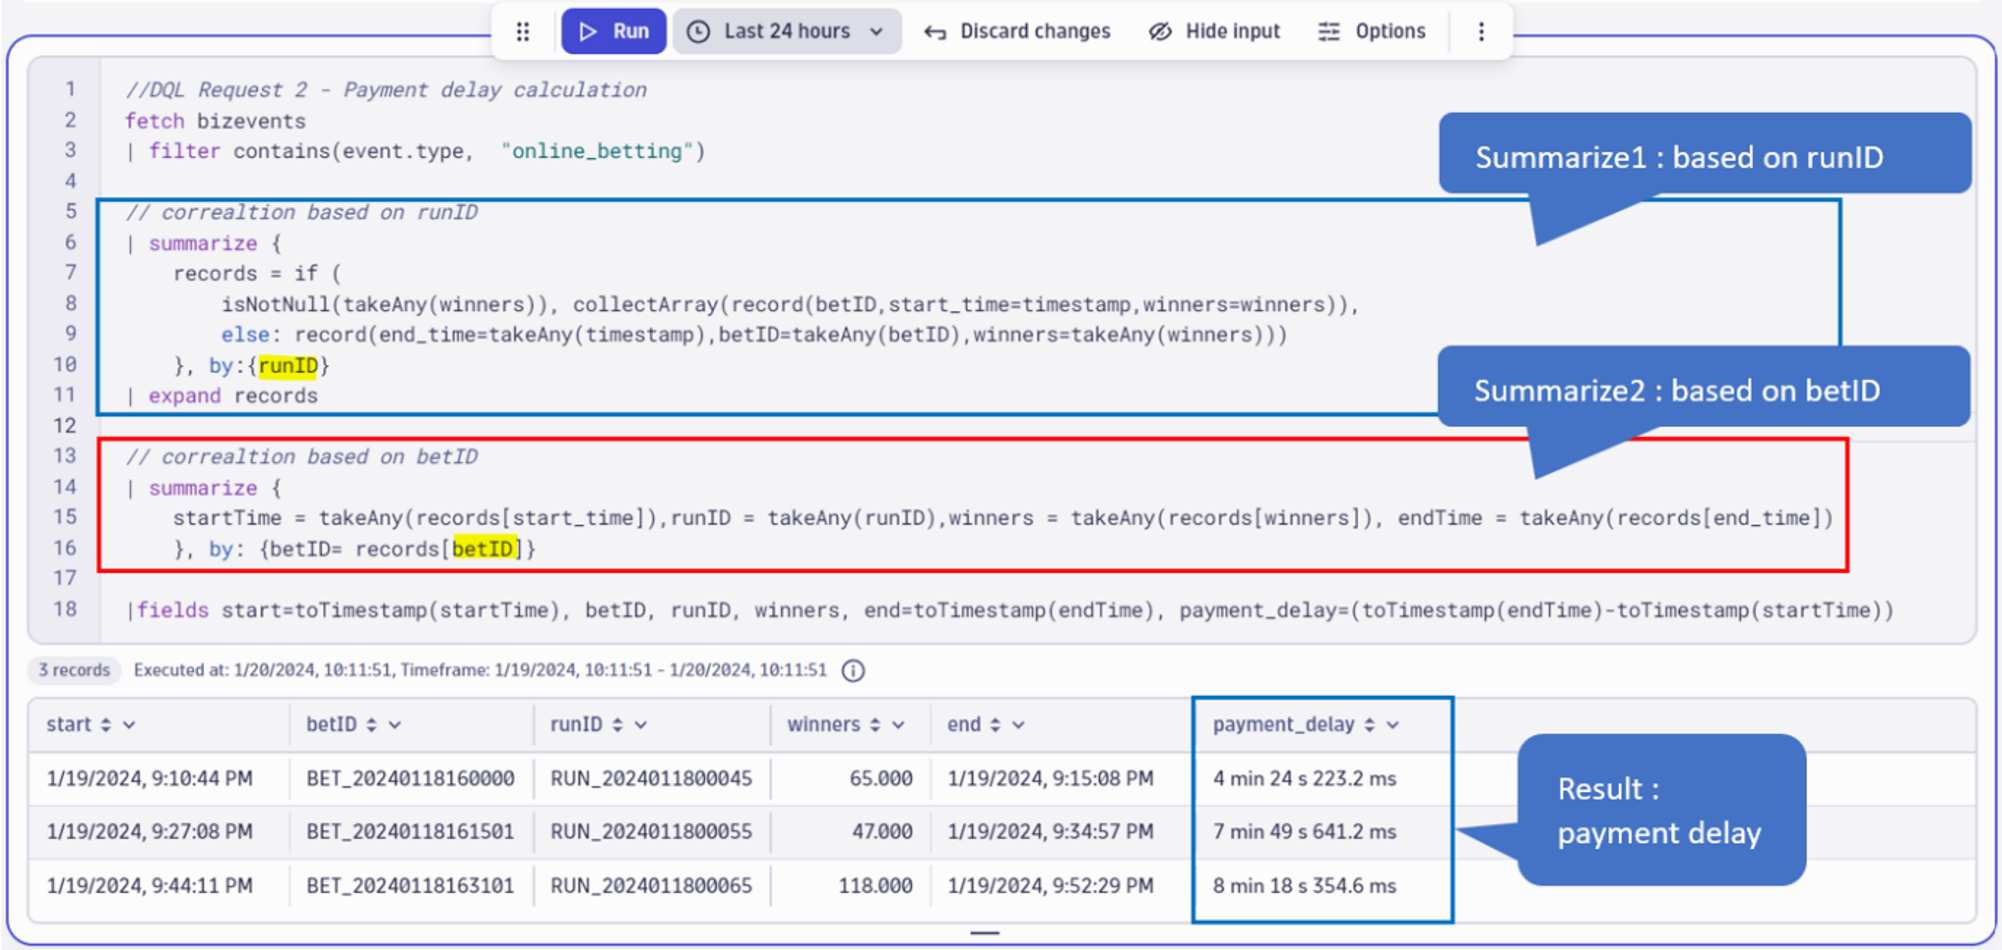
For this use case, the DQL request needs two successive summarize commands:
- The first
summarizecommand uses runID to correlate bizevents 2 and 3 in a record. - The second
summarizecommand correlates the record with bizevent 1 based on the betID
Service level objectives (SLOs) and workflow automation for business processes
Monitoring the payment process provides real-time insights into performance and anomalies. The next step is to formalize the goals by defining a service level objective (SLO) and an error budget policy. We’ll add the SLO function to the mix, with the goal of 99% compliance to an eight-minute service level.
We can add the following SLO calculation to our previous query to measure compliance:


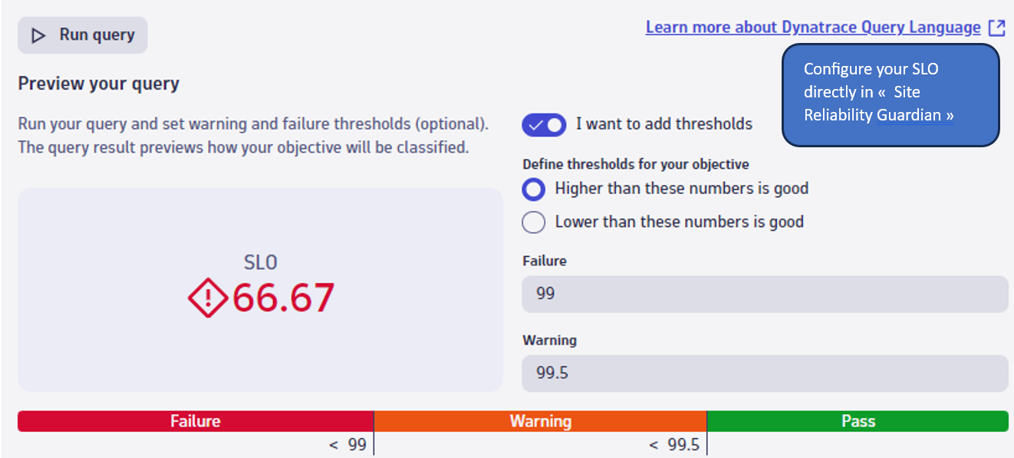
To configure your first Site Reliability Guardian, add the app from your tenant and follow the Get started guide.

All that remains is to set up a workflow that, based on the SLO, will trigger notifications to your service management solution and to your business teams.
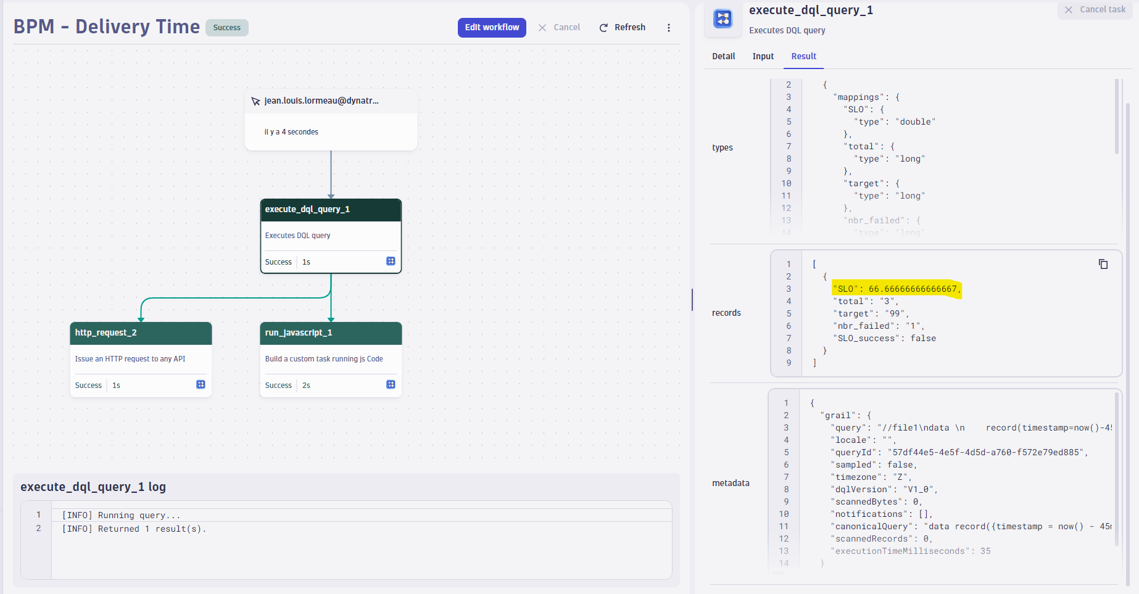
See more Workflow automation use cases by visiting Workflows in Dynatrace Hub.
Automated business processes are the heart of modern organizations. IT operations and business teams benefit from a shared view of process health, using business KPIs as the primary metrics. Dynatrace makes monitoring, analyzing, and optimizing business processes easier than ever.
For a closer look at Business Flow, see this App Spotlight, or contact your Dynatrace representative.


Looking for answers?
Start a new discussion or ask for help in our Q&A forum.
Go to forum