Cloud migration of IT infrastructure and applications introduces complexity that requires an observability platform. Here’s how customers use Dynatrace in their cloud migration strategy.
For IT teams seeking agility, cost savings, and a faster on-ramp to innovation, a cloud migration strategy is critical. Cloud migration enables IT teams to enlist public cloud infrastructure so an organization can innovate without getting bogged down in managing all aspects of IT infrastructure as it scales.
But, as resources move off premises, IT teams often lack visibility into system performance and security issues. They need ways to monitor infrastructure, even if it’s no longer on premises. This is especially true when organizations migrate legacy apps to public clouds. Traditional monitoring tools cannot monitor legacy and cloud-native applications on the same platform.
Thanks to modern observability platforms, cloud migration has never been easier. Observability enables organizations to migrate and modernize apps effectively while enlisting intelligent automation to monitor their activity. Causal AI automatically identifies performance problems, security issues, and more. When combined, observability and causal AI help remediate issues before they affect users.
Large-scale cloud migrations are executed in three phases, which vary depending on the cloud provider. However, the foundational stages are similar:
- Assess and discover. Define the strategy, assess the environment, and perform migration-readiness assessments and workshops.
- Mobilize and plan. Build the business case, start migration planning, and define the operating model and desired operating and security controls.
- Migrate and modernize. Execute rehost, re-platform, refactor, and rearchitect through automation and Agile delivery. Optimize the cloud migration and review the migrated workloads’ performance.
Assessment and discovery with Dynatrace
In a cloud migration strategy, the first step is to assess the applications, dependencies, user access, host infrastructure, and peak usage periods.
How can IT pros use Dynatrace to view the full stack’s environment topology?
Dynatrace Smartscape provides a near-real-time environment topology visualization of all the dependencies across the infrastructure, process, and services.
From a cloud adoption standpoint, Smartscape helps to do the following:
- Adjust service architecture or infrastructure to improve application performance.
- Examine cross-tier and same-tier process, host, and service interdependencies to better understand how they affect application performance.
- Identify the precise source of issues with causal AI. Dynatrace, for example, can identify an issue with third-party dependencies and reveal the issue’s effect on application performance.
How do I get a high-level view of all applications?
Before a cloud migration, IT teams need to know how employees use applications and how busy these applications are.
Further, organizations need to identify rarely used applications, which to eliminate from the cloud migration strategy, and which to use as a pilot. The pilot cloud migration helps uncover risks related to process, operational, and technology changes.
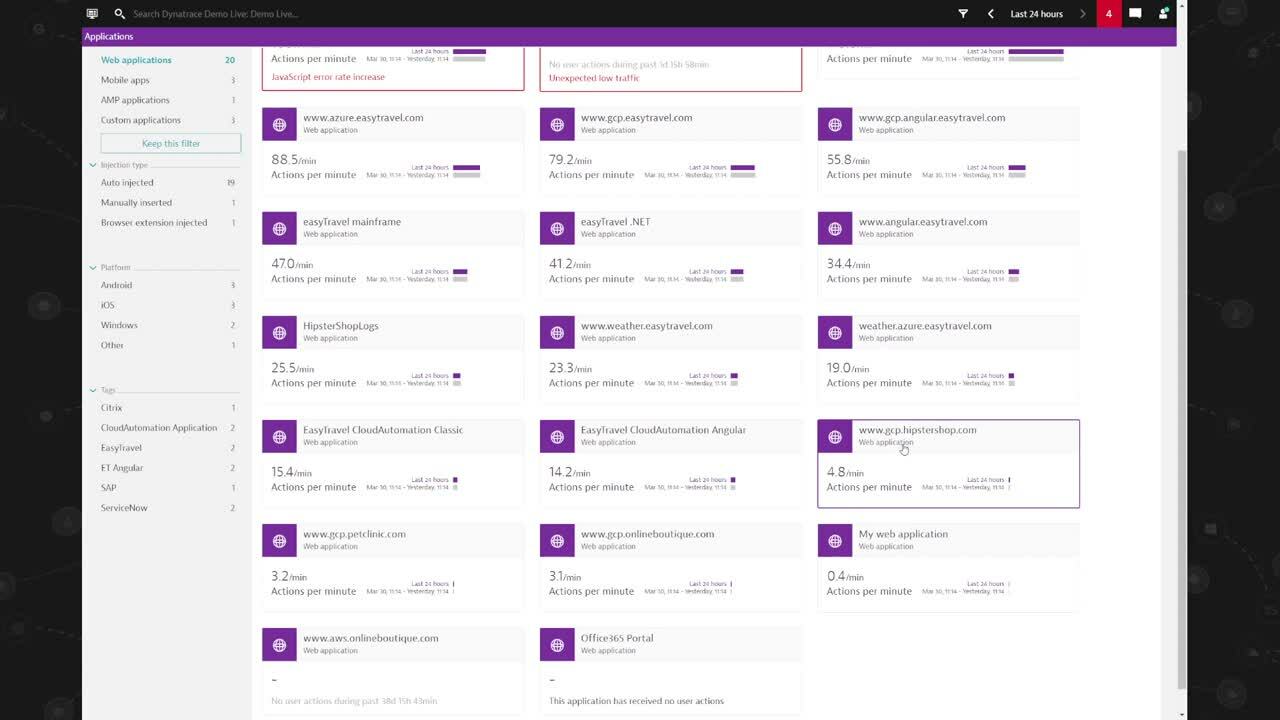
Figure 1 illustrates how users can sort all Dynatrace-monitored applications by actions per minute. Now, we can see which applications have a high ratio of actions per minute (e.g., www.easytravel.com) and low actions per minute (e.g., www.gcp.hipstershop.com).
How many people use the application?
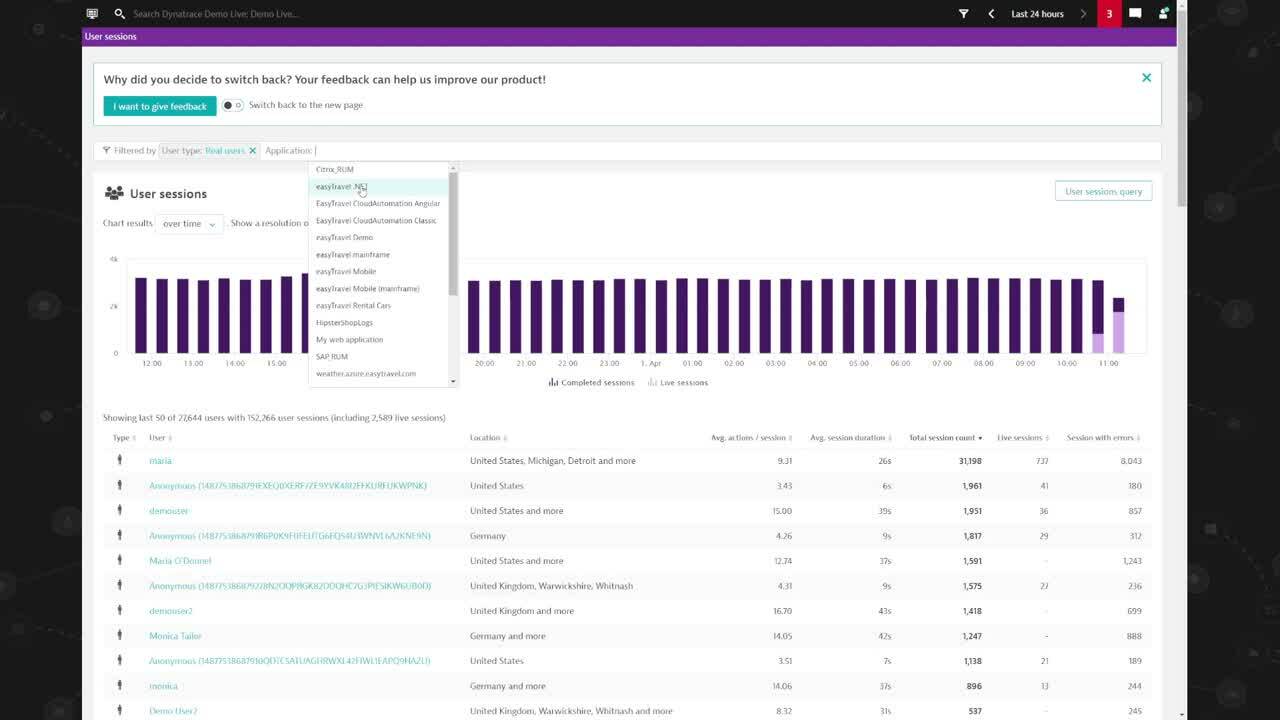
With real user monitoring, Dynatrace provides information on who uses an application in a specified time period, which tasks they complete, and more. In Figure 2, we sort real users based on the application to reaffirm the actual users accessing the application.
How do we get this data in a workbook for reporting?
Visualization is great for day-to-day activities. But we often need a spreadsheet or report for analysis. That’s why customers use Dynatrace’s application programming interface (API) to automate monitoring tasks and export different data types into a third-party reporting and analysis tool.
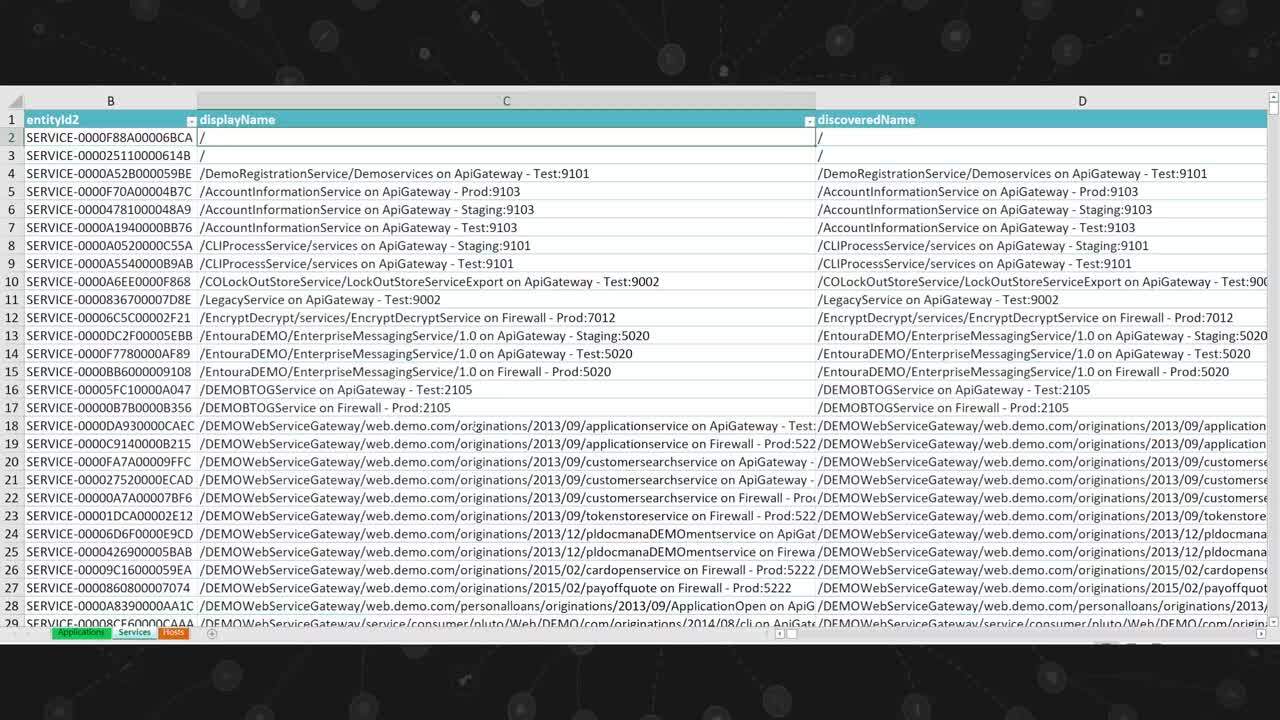
In Figure 3, we extract information in a spreadsheet related to the application, its relationship with services, associated services, and hosts to which the services and application belong. This information becomes the source for every migration stage, as additional reports are based on this for migration wave planning and right-sizing.
Right-sizing infrastructure
Overprovisioned servers lead to CPU and memory waste, creating inefficient usage and increasing costs. Right-sizing matches server to workload performance and capacity requirements at the lowest possible cost.
With Dynatrace’s API, customers access current and historic CPU, memory, disk, and network usage to identify if a server is optimized. This data shows whether they need to reduce or increase CPU or memory.
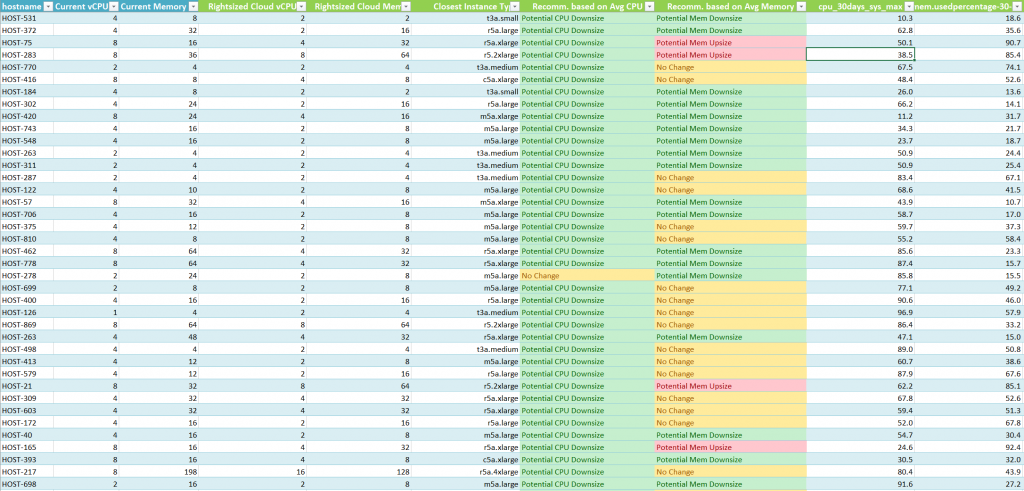
In Figure 4, we use a server’s current CPU and memory profiles, get the past utilization, and recommend CPU and memory sizes that are right-sized to match workload performance.
Although it’s important to right-size when servers first move to cloud and to calculate these resources’ total cost of ownership, right-sizing is a continuous process. Because performance and capacity requirements change over time, this can result in over- or underprovisioned resources.
The seven Rs of a cloud migration strategy with Dynatrace
Any cloud migration strategy involves the seven Rs. First, IT teams need to assess what applications require in terms of these seven phases:
- Rehost. Migrate the application to a different hosting platform.
- Re-platform. Migrate to a different platform, like managed services; use vendor-provided machine images; containerize; and use CI/CD pipelines.
- Refactor. Modernize the application, containerize the application, and refactor the code.
- Repurchase. Migrate to SaaS or marketplace products.
- Relocate. Migrate to the same architecture in a different location.
- Retire. Decommission the application and infrastructure.
- Retain. Keep the workload on premises and use a hybrid cloud approach.
Some applications may have to be rearchitected and re-platformed at the same time. For example, transforming an e-commerce application into a microservices platform and moving to the cloud at the same time has to be addressed through a transformational project.
Figure 5 shows the service flow of a Java-based application hosted on VMware. One of the services is hosted on a virtual machine with a Tomcat service and load-balanced via an HAProxy.
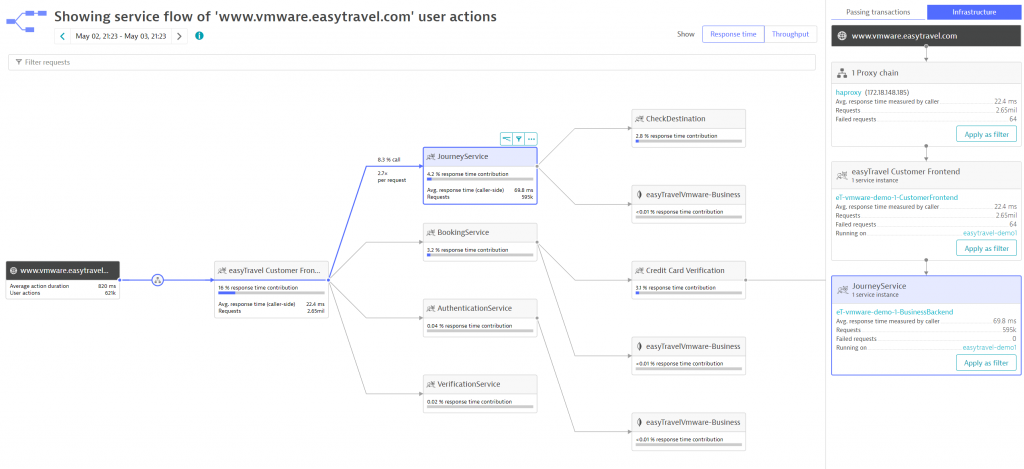
Dynatrace automatically understands the applications’ transactions end to end. So, to rearchitect an application, use the service flow to understand the various services involved, the technology used to build the service — Figure 5 depicts Tomcat and MongoDB — and the number and percentage of requests.
Developers can break down an application into containers and host them on container orchestration platforms, such as Kubernetes, managed in the cloud. Dynatrace is the only Kubernetes monitoring solution that provides full-stack observability without changing code, container images, or deployments.
Migrate and modernize apps
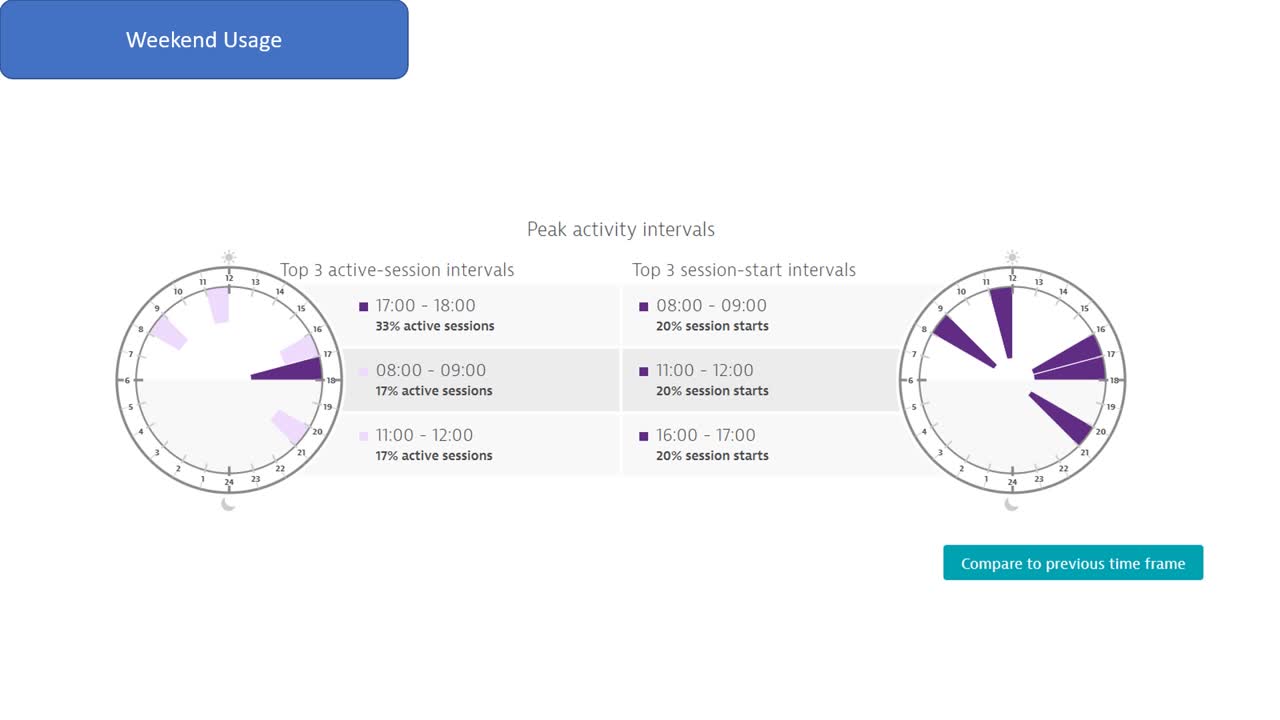
With real user monitoring, customers use the Peak Activity interval sections to understand when an application is used the most and the least. This data helps in scheduling the migration window and minimizes user impact during the process.
Regardless of your cloud migration strategy, customers want to see how a workload migrated to the cloud and changes in performance, usage, connectivity, or unknown issues. Customers use myriad options within Dynatrace to compare past and current performance. The most popular built-in feature is the Compare option.
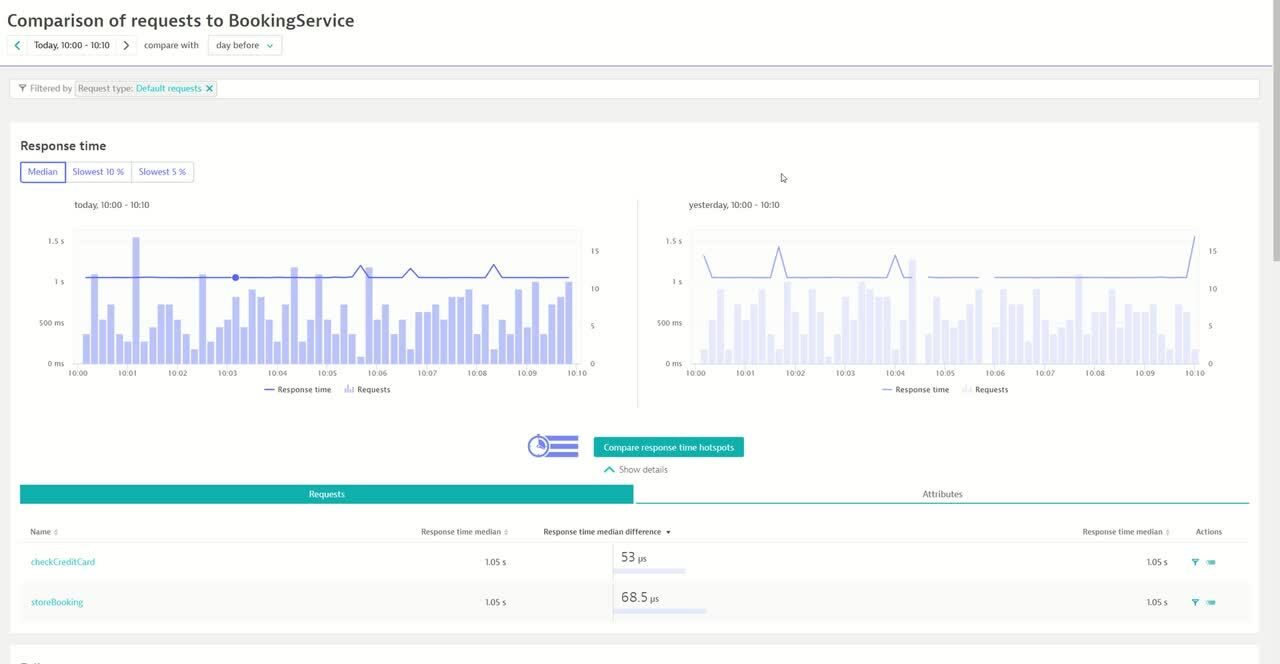
In Figure 7, we can pick the service from the service flow, look at the metrics, and then compare the performance changes in a single, built-in Dynatrace feature.
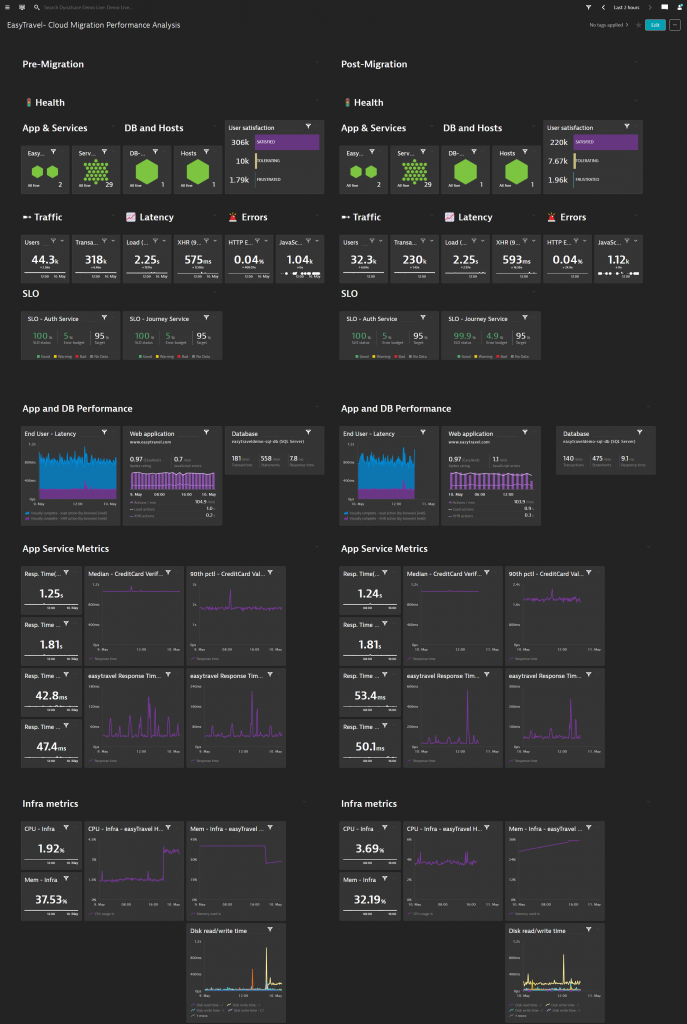
Often, customers want to compare every component in the full stack, including front-end user experience metrics and infrastructure performance metrics. Using Dynatrace’s dashboarding functionality, customers can create dashboards for every critical component of the full stack and have a side-by-side view of the environment. Therefore, customers can see system performance before and after the migration. With the ability to configure each dashboard tile with a custom time frame, customers can easily view the same metric over different time frames within the same dashboard.
Modernizing workloads and monitoring cloud-native environments
As applications move to the cloud, using cloud-managed resources like load balancers, relational and nonrelational database systems, and serverless functions is common. In Figure 9, the transition from VMware to Amazon Web Services was seamless. Cloud-native metrics from AWS are now available with all dependencies and relationships correctly mapped and in context.
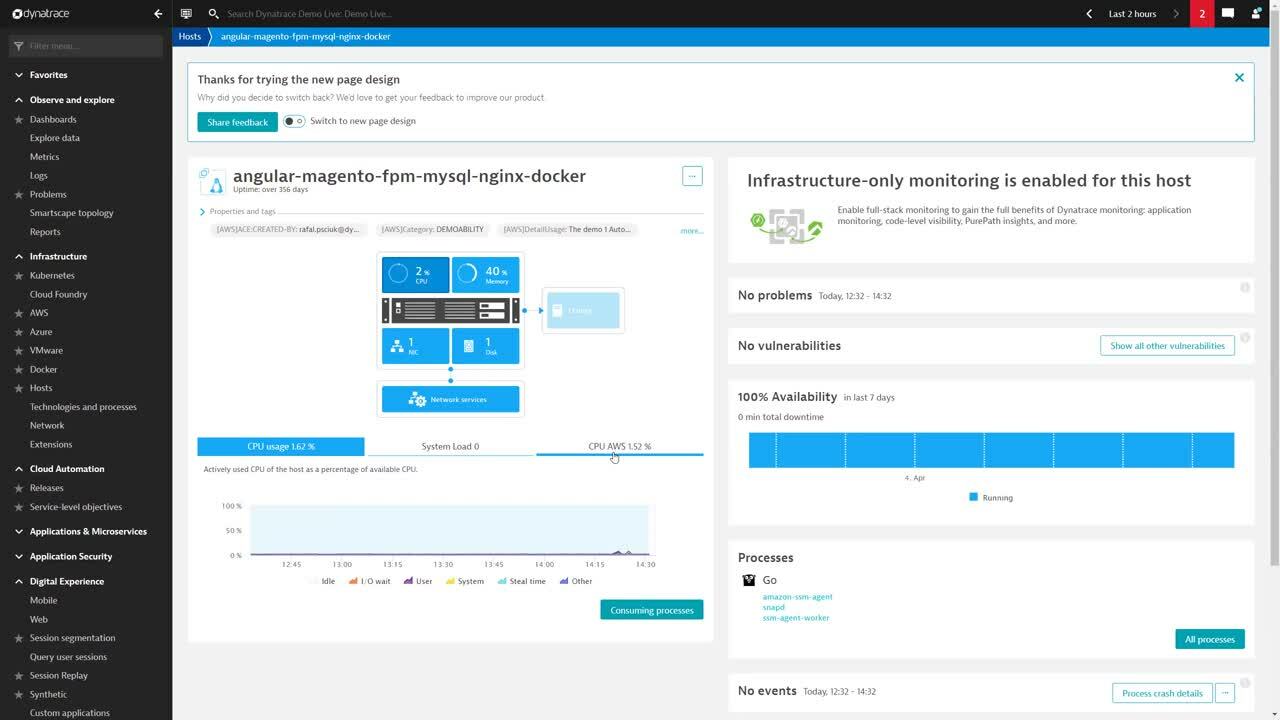
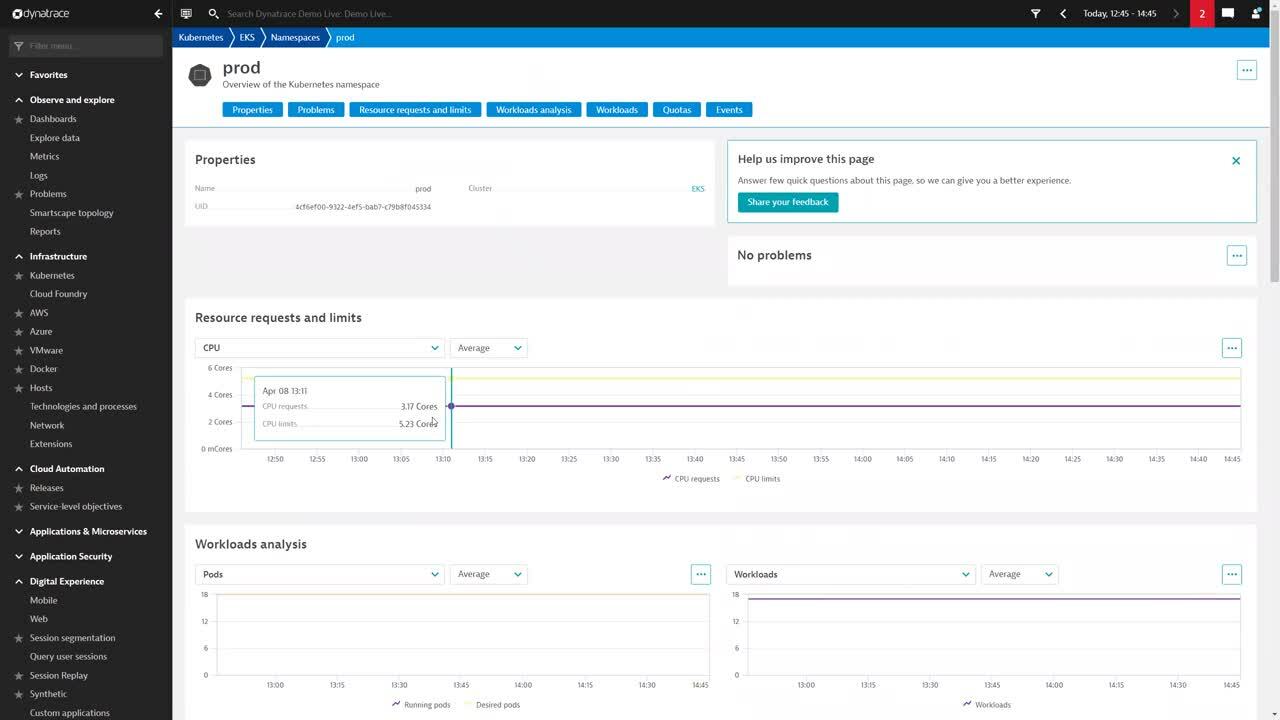
The Dynatrace OneAgent operator on the Kubernetes cluster offers end-to-end, full-stack visibility with no code change. In Figure 10, Dynatrace monitors the Kubernetes cluster, workloads, pods, and host on which the cluster is running. This is always in context, as we can see the relationship between the platform and application.
Achieving operational excellence in the cloud with AIOps
Achieving operational excellence requires a reduction in alert storms and toil, as well as the ability to prevent and learn from operational failures. For example, manually creating static baselines across the full stack — application, services, processes, hosts, clusters, and pods — is daunting and prone to misconfiguration, especially in cloud environments where many resources are heavily abstracted.
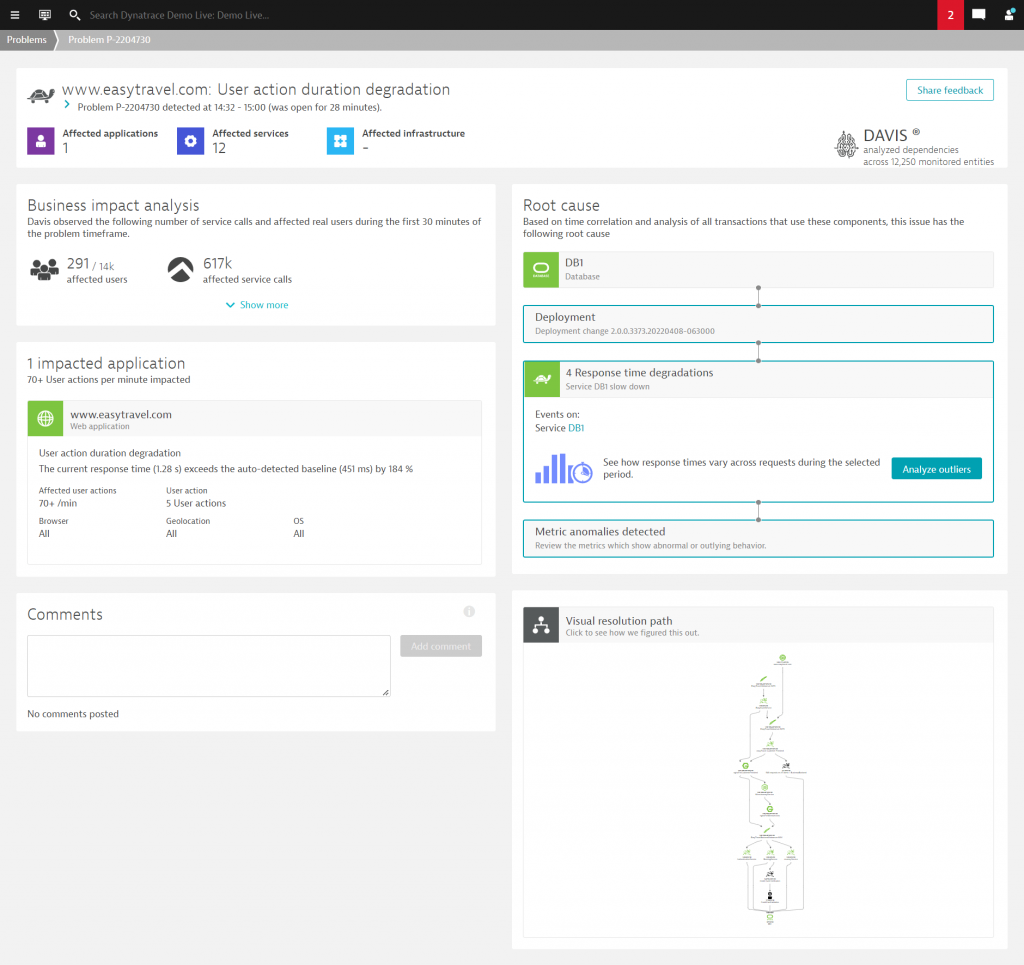
So, to overcome these challenges, Dynatrace’s AI causation engine, Davis®, automatically detects performance anomalies in the application, services, and infrastructure stack. Dynatrace-detected issues generate anomaly alerts, such as performance degradations, improper functionality, or lack of availability.
To identify the issue’s root cause, Dynatrace uses all the OneAgent-delivered context information — such as topology, transaction, and code-level information — to find events that share a common source. Using all available context information, Dynatrace pinpoints the issue’s root cause in the application delivery chain and dramatically reduces the alert for single incidences originating from the same root cause.
How Dynatrace simplifies your cloud migration strategy
Cloud migration is complex, involving people, processes, and technology. But Dynatrace makes it easier than ever, with automation to discover an environment, identify users’ patterns, plan, migrate, and modernize cloud workloads.
At the same time, the abstractions that cloud and managed platform solutions offer make it challenging to identify dependencies, baseline key components, and issues. Dynatrace AI simplifies the process and performs automated root-cause analysis, even in the most complex applications.



Looking for answers?
Start a new discussion or ask for help in our Q&A forum.
Go to forum