Dynatrace Blog
Modern cloud done right. Innovate faster and compete more effectively in the digital age.


Real user monitoring: Support for Fetch API is now available

Easily configure detection of your environment’s custom application services

Compare service request performance and behavior over time

Dynatrace Managed feature update, Version 124

Atlassian Connect(-ing) DevOps Tools Jira, xMatters and Dynatrace

Efficiently filter problem notifications with alerting profiles

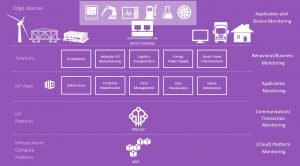
AWS IoT Marketplace has just landed; Dynatrace a proud partner

OneAgent & Security Gateway: Release notes v1.123

Custom alerts: What you set is what you get

All you need to know to really understand the Node.js Event Loop and its Metrics

Enhanced process-group detection supports customer-specific deployment schemes

Six mistakes in your OpenStack monitoring process…and how to fix them

DevOps: Adoption Challenges from Around the World

Enhanced global Time frame selector functionality

Dynatrace Managed feature update, Version 122

Optimize user experience with ‘Visually complete’ & ‘Speed index’ measures

Federal DevOps: Learning from Government

OpenStack monitoring beyond the Elastic (ELK) Stack – Part 3: Monitoring with Dynatrace

Custom percentiles for dashboard charts & Dynatrace API calls

Integrate Jira issue tracking with your Dynatrace environment

OpenStack monitoring beyond the Elastic (ELK) Stack – Part 2: Monitoring tool options

PurePath visualization: Analyze each web request from end-to-end

