As companies accelerate digital transformation, cloud services such as AWS Lambda help companies to modernize their application architectures to quickly adapt to the needs of their customers while offloading the operational complexity to their cloud vendor.
With the growing complexity of application architectures which can rely on tens of thousands of microservices, end-2-end observability is a requirement to optimize application performance and to deliver intelligent root-cause analysis.
For AWS Lambda, Dynatrace provides Lambda Layers for adding distributed tracing to your serverless functions and for capturing metrics and logs from Amazon CloudWatch. These capabilities give you a single pane of glass with Davis AI powered automatic analysis for your telemetry.

The need for a simplified approach to capture telemetry
Managing multiple data sources and integrations to capture all telemetry signals increases the complexity and TCO of your observability pipeline. As a result, cloud operation teams often limit insights to the most important services and signals resulting in increased observability blind spots and risk of downtime.
AWS Lambda Telemetry API as an extension to AWS Lambda for all telemetry signals
AWS Lambda recently launched a new telemetry API extension that allows observability solutions such as Dynatrace to build a radically simplified observability pipeline with an improved out of the box experience. The key benefits include:
- Simplified instrumentation: by presenting logs, platform traces, and platform metrics directly to the Extension, Telemetry API allows observability within a single integration without the need to additionally pull data from other sources like CloudWatch.
- Enhanced observability: the Telemetry API provides deeper insights into the different phases of the Lambda execution environment lifecycle (initialization, invocation, etc.) to better understand AWS Lambda behaviour such as cold starts.
Dynatrace supports the AWS Lambda Telemetry API
As a leading observability platform and AWS partner and with customers running millions of AWS Lambda functions, Dynatrace helped the AWS Lambda team shape the new Telemetry API to ensure that it best meets the needs of complex customer environments.
The new capabilities will:
- Simplify the configuration of AWS Lambda observability: The Dynatrace Lambda Layer already provided fully automatic distributed tracing for your AWS Lambda and can now capture metrics and logs as well. With this DevOps teams who manage the deployment of the Lambda function can capture all critical telemetry signals through native AWS functionality. This makes it easier to apply/enforce monitoring policies as fewer teams are involved (e.g. to setup AWS access policies)
- Reduce cloud monitoring costs: By removing the need to use CloudWatch to retrieve AWS Lambda metrics and logs, customers can reduce the cost for storing and exporting telemetry signals.
- Enable monitoring at scale: Since all telemetry signals for AWS Lambda are captured within the Dynatrace Lambda layer, CloudWatch integration capacity is freed up for other services.
- Deliver low latency platform metrics: The direct access to platform metrics within the Lambda layer reduces latency adding faster and improved alerting on metric anomalies.
- Provide seamless integration: All the improvements on the observability pipeline, seamlessly blend into the experience of Dynatrace users who already monitor AWS Lambda with metrics, traces, and logs in a single pane of glass today.
How to get started
The new capability will be rolled out in multiple phases, starting with the support to additionally collect logs via the Dynatrace Lambda Layer.
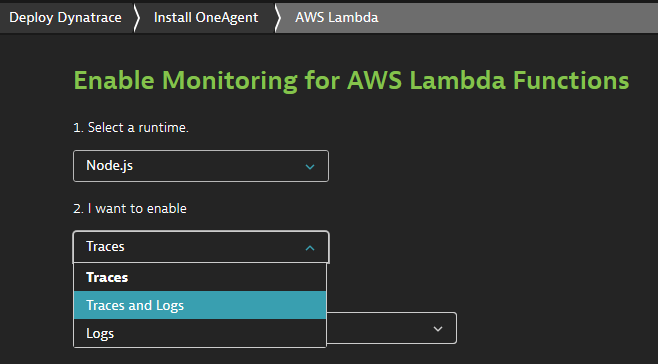
Within the Deployment UI for AWS Lambda, you now have an additional option to choose which telemetry signals to collect:


