Threads enable your application to execute multiple tasks at the same time. This is why threads are often the source of scalability as well as performance issues. If your system is under high load, it can run into thread-locking issues that prevent upward linear scaling of your application. Another potential issue is that too many active threads waste CPU resources, either by over-utilization or by forcing the OS to schedule thousands of threads on a limited set of cores.
Thread dumps allow Java developers to understand which threads execute which code and whether or not certain threads are waiting or locked. However, thread dumps are a point-in-time snapshot that can’t notify you of trends or how things are developing. For example, if you come in Monday morning and are informed that there was a massive problem on Sunday, it would be great to have a thread dump, but you forgot your time machine at home.
Thread dumps are now a thing of the past; the future belongs to 24×7 continuous thread analysis.
Identify and solve performance bottlenecks faster with continuous thread analysis
You can now use Dynatrace to continuously analyze the state of your threads and see how they develop. You can thereby identify and solve performance bottlenecks faster in your application. You’ll find this new feature in the CPU profiler at Diagnostic tools > CPU analysis.
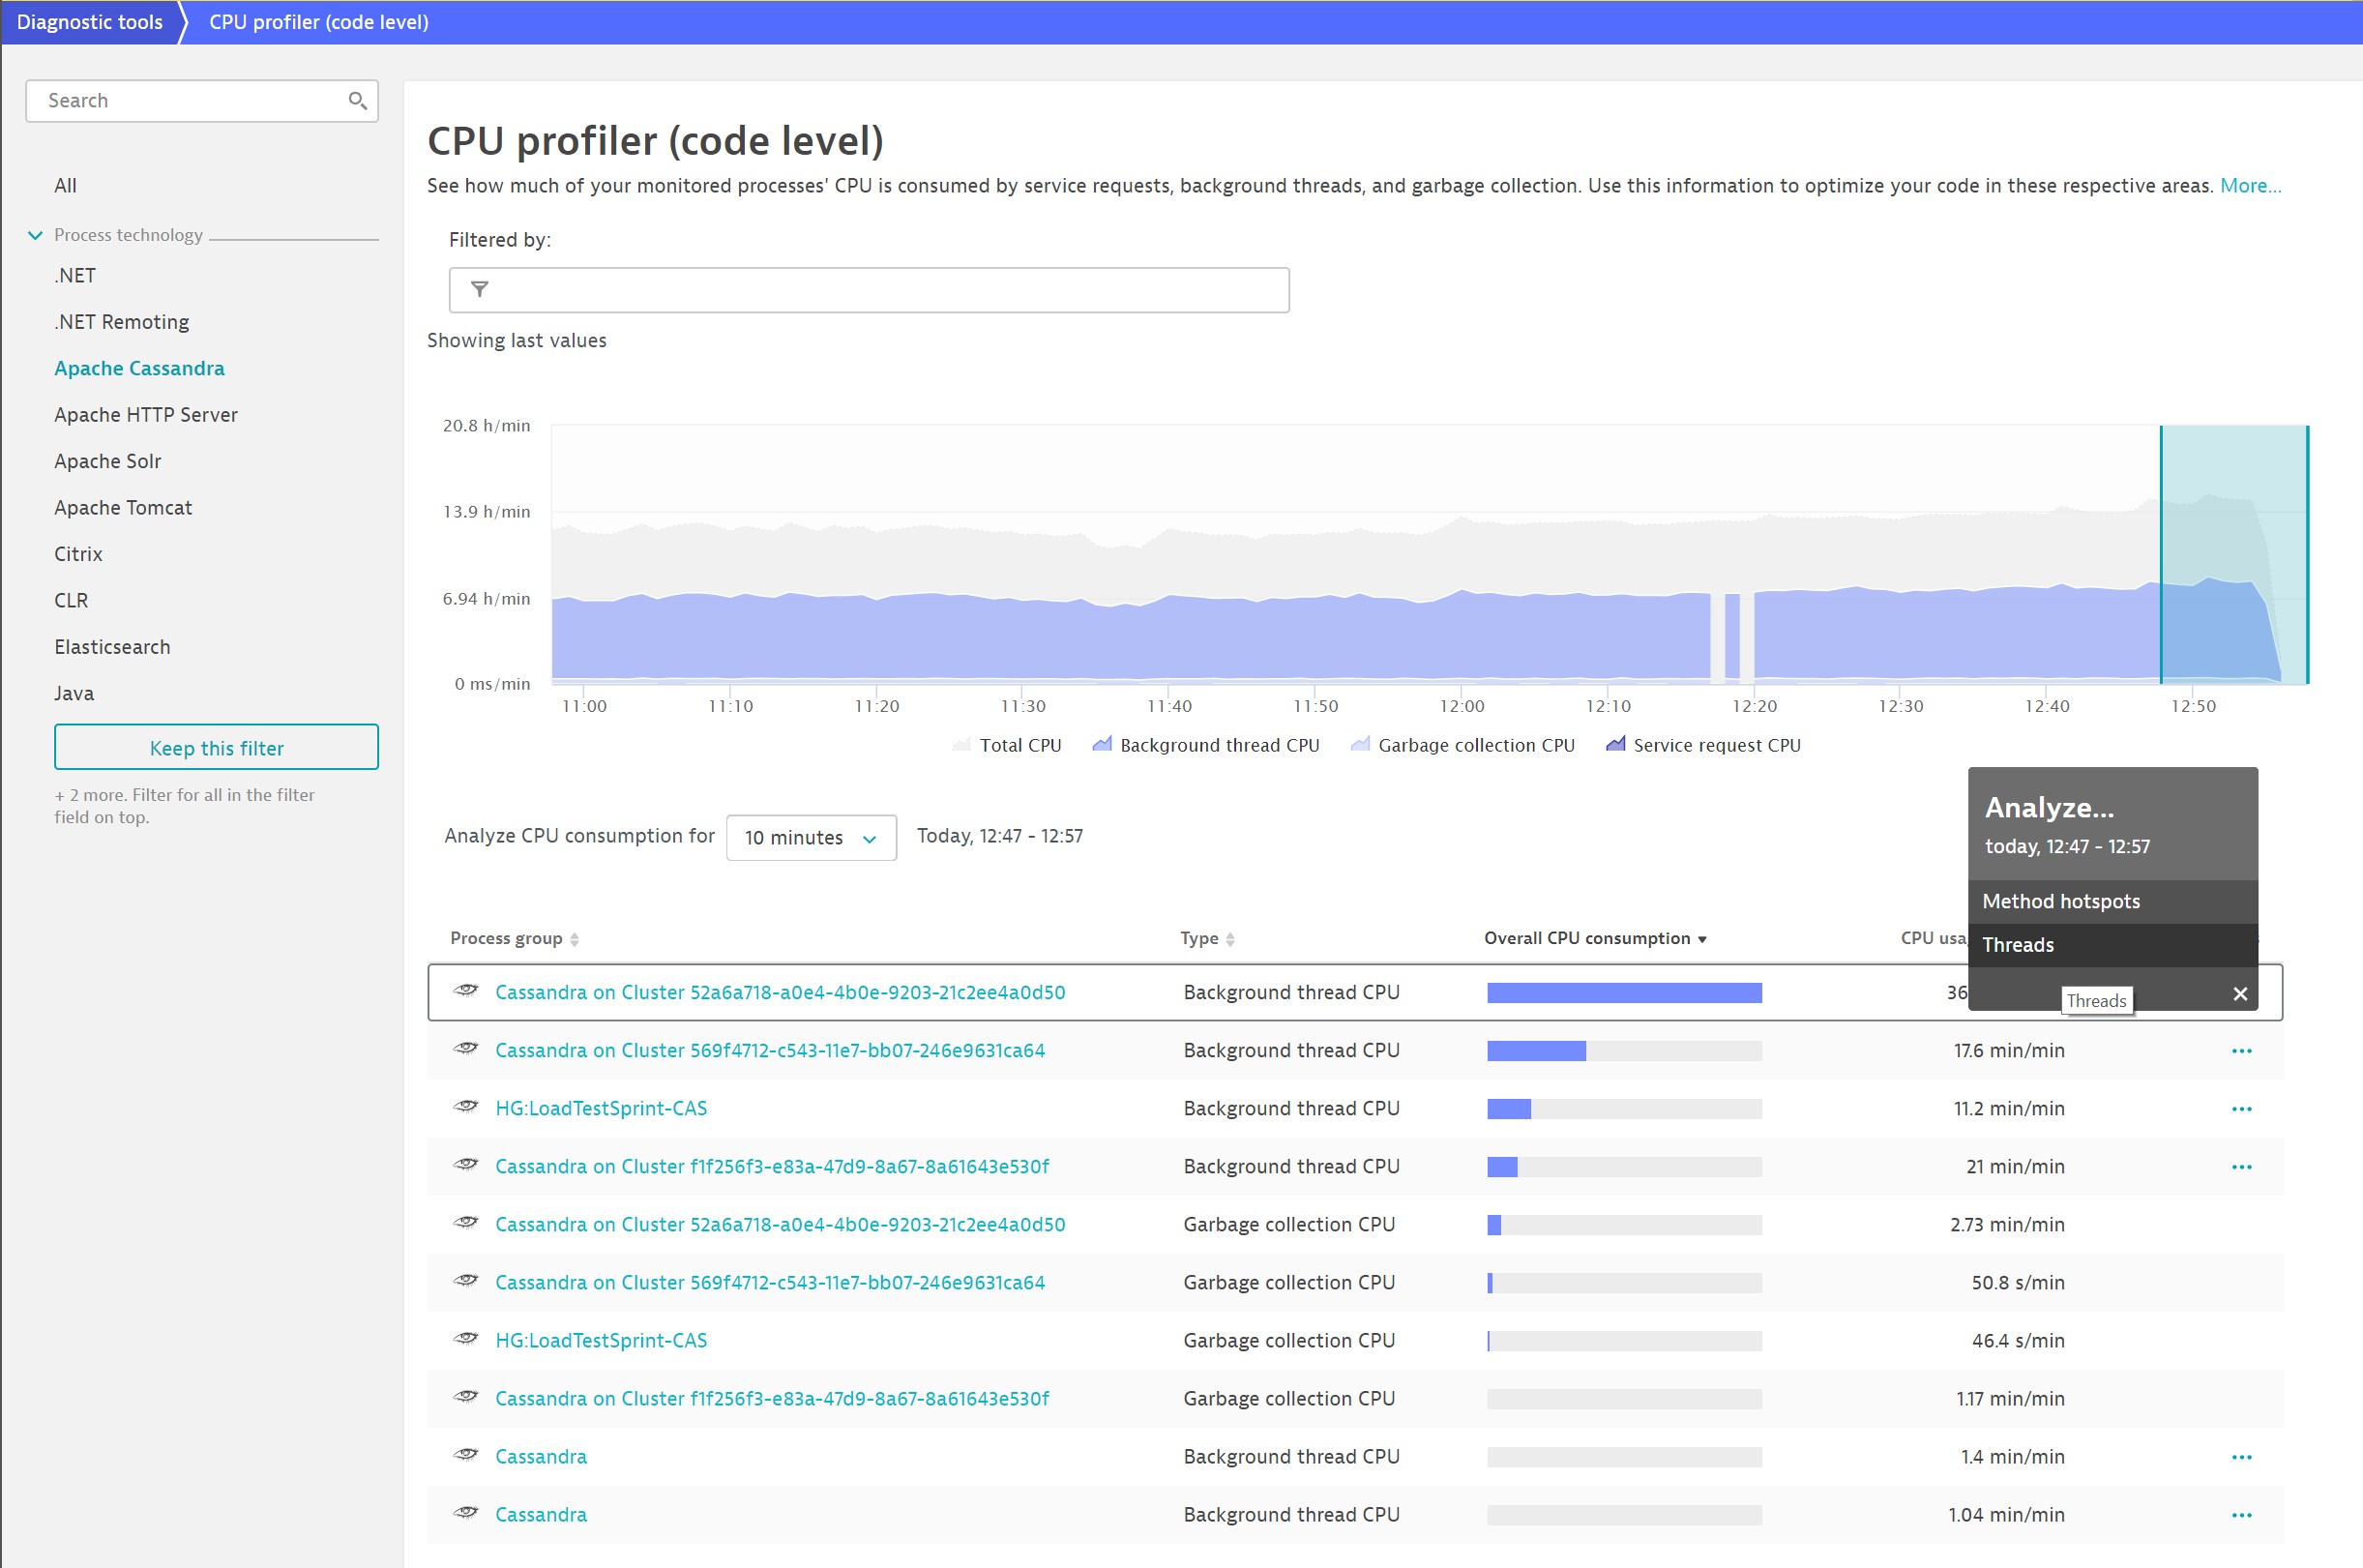
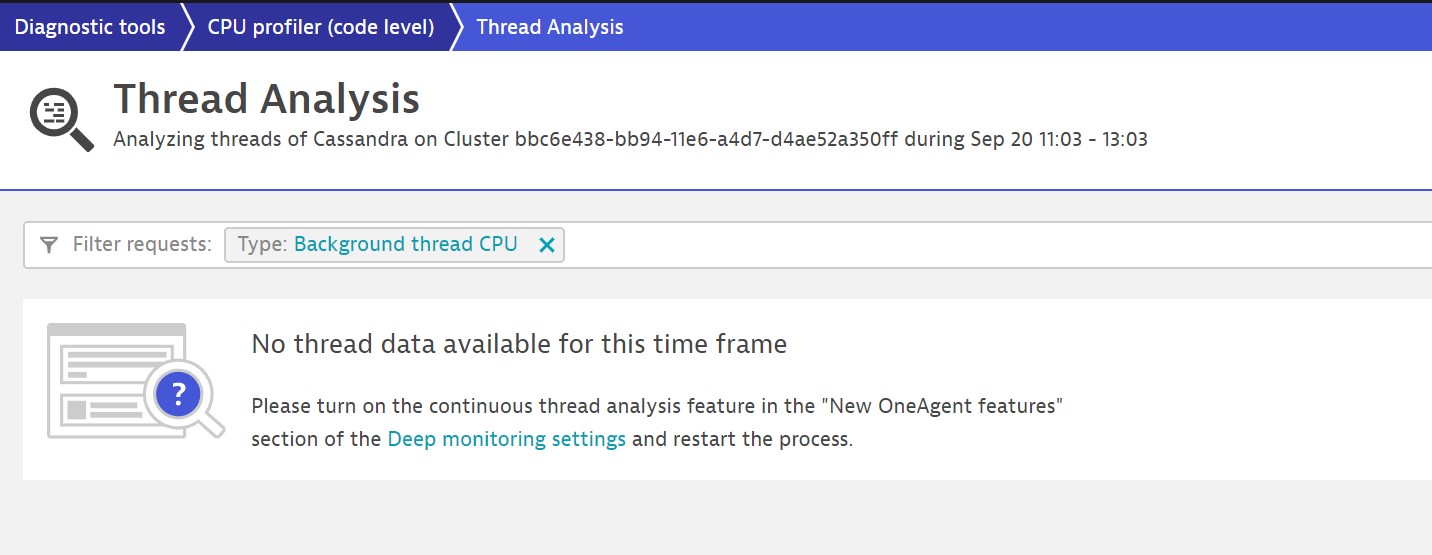
When you first opt to view Threads, you see this page:
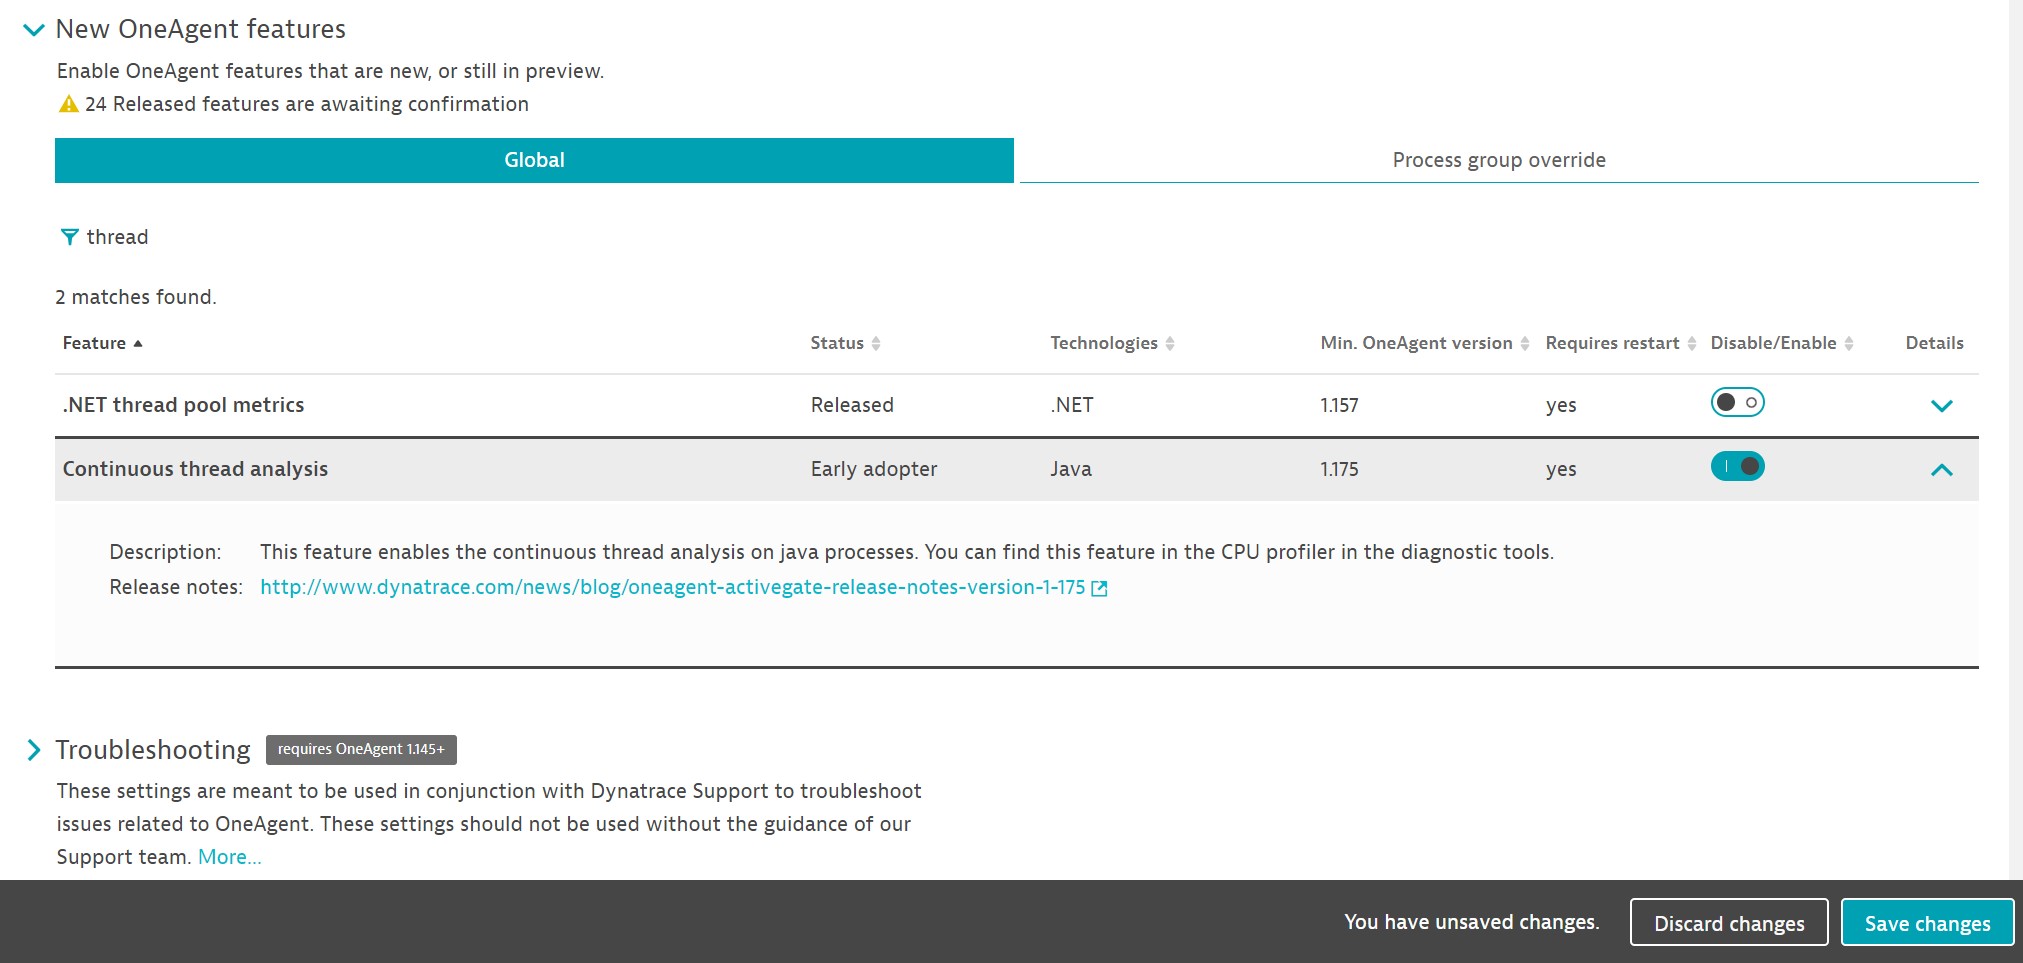
When you select the link and enable the feature (Continuous thread analysis, shown below), it’s immediately activated and requires no restart.
Now let’s see how this works for the two use cases mentioned earlier.
Use case #1: Identify scalability issues
A scalable architecture needs to distribute work across many threads in order to facilitate all the CPUs of a physical or virtual machine. Ideally, all CPUs would execute code all the time and never be idle. Locking is the Achilles heel of any multi-threaded architecture. Many systems don’t scale in a linear fashion because they need to coordinate work across many threads. More work means more coordination and more locks, which in turn means less code executed at any given time.
Continuous thread analysis allows you to automatically identify such behavior. Simply filter the thread group list by the locking thread state.
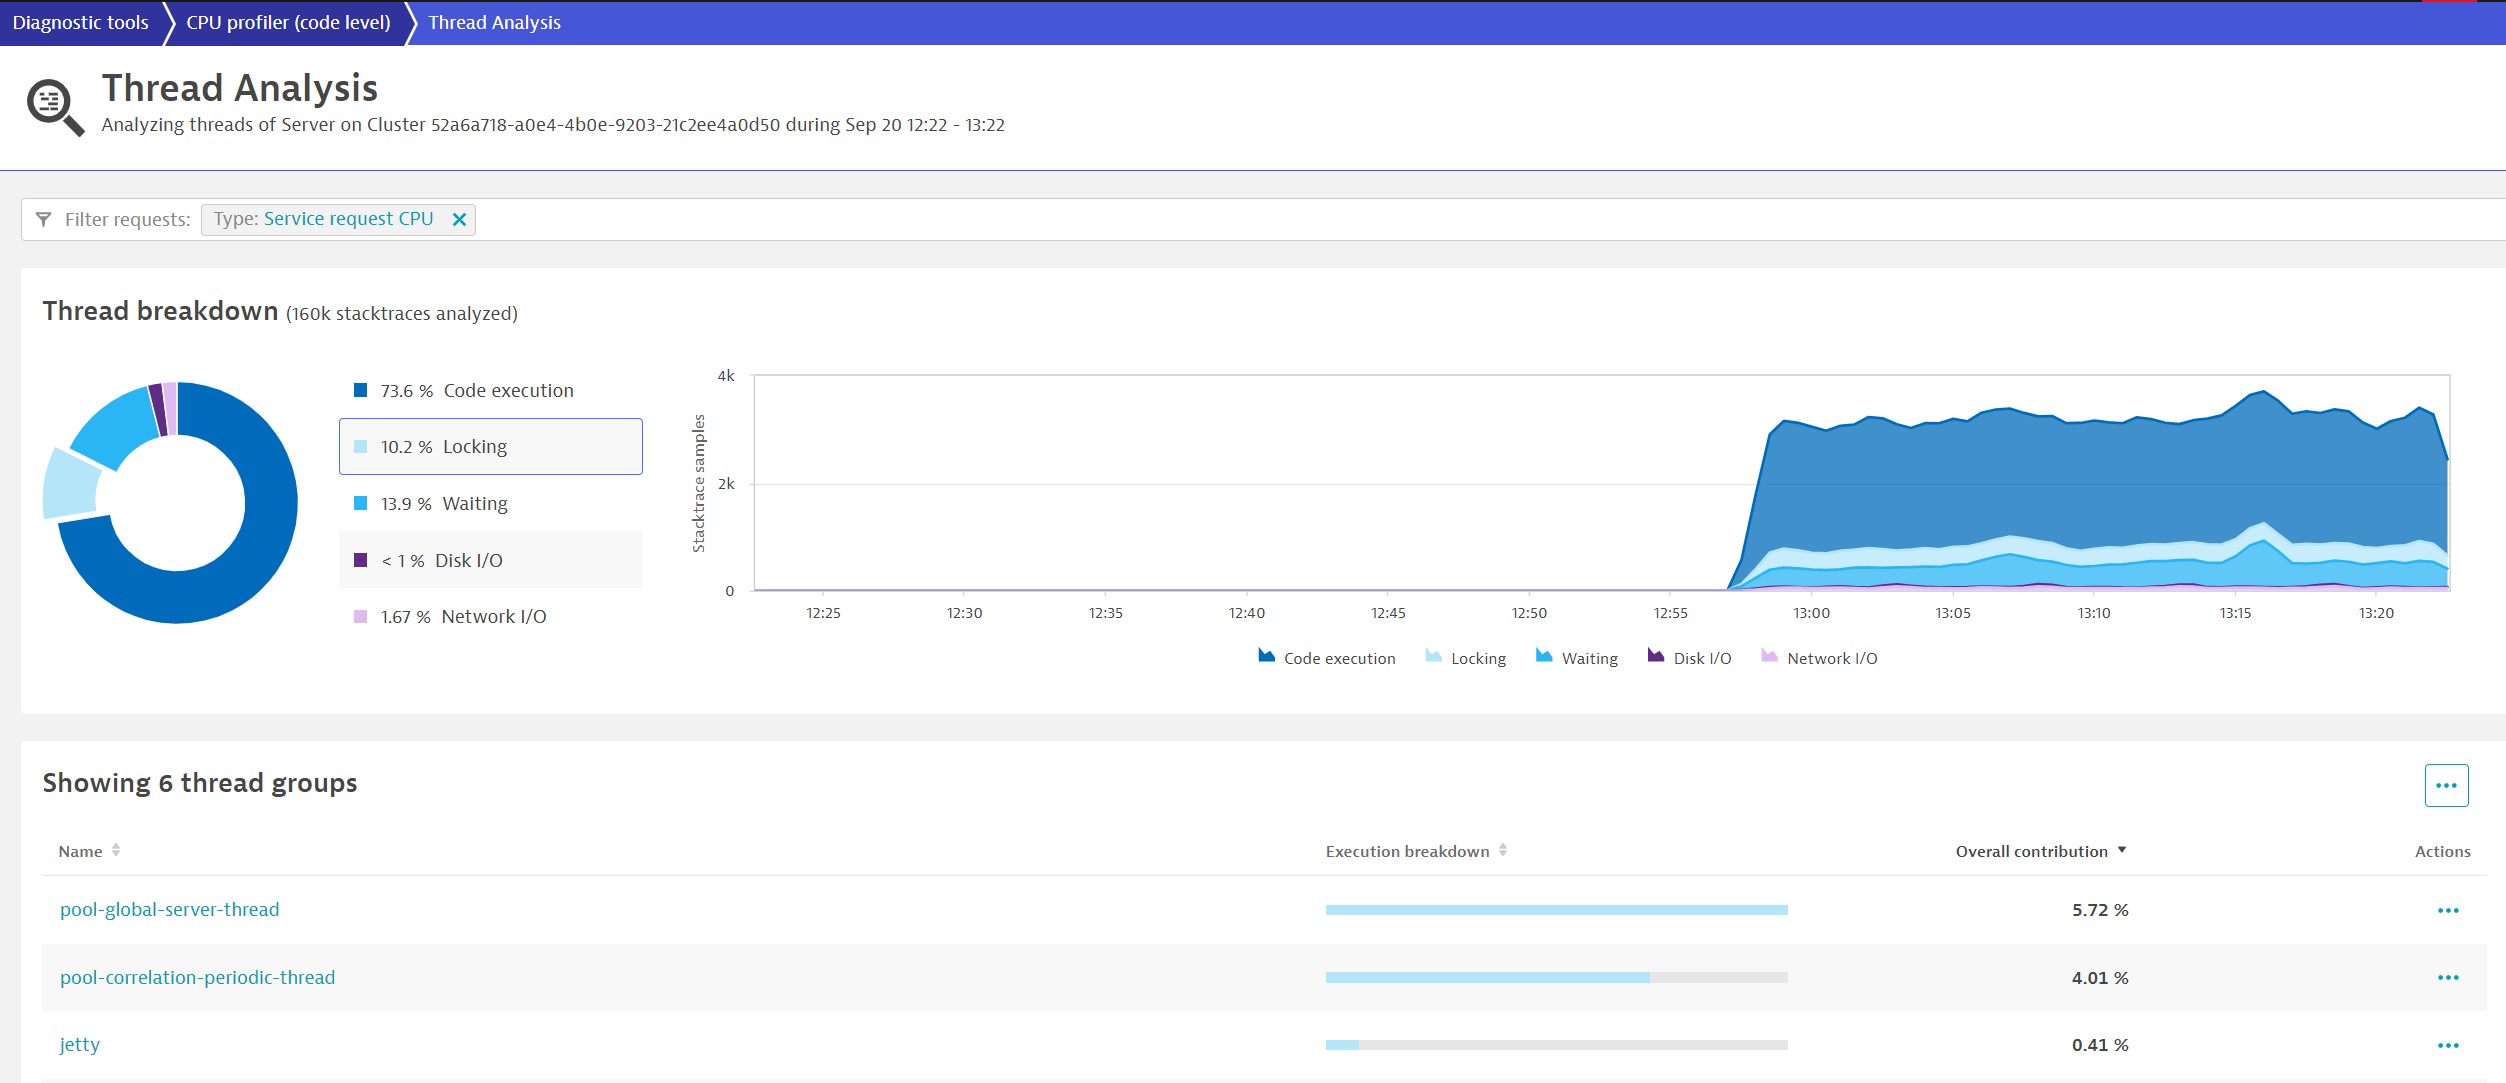
While the system is well optimized in this example, we still find considerable locking behavior under load. The locking is a constraint of two thread groups—let’s analyze the first one in detail.
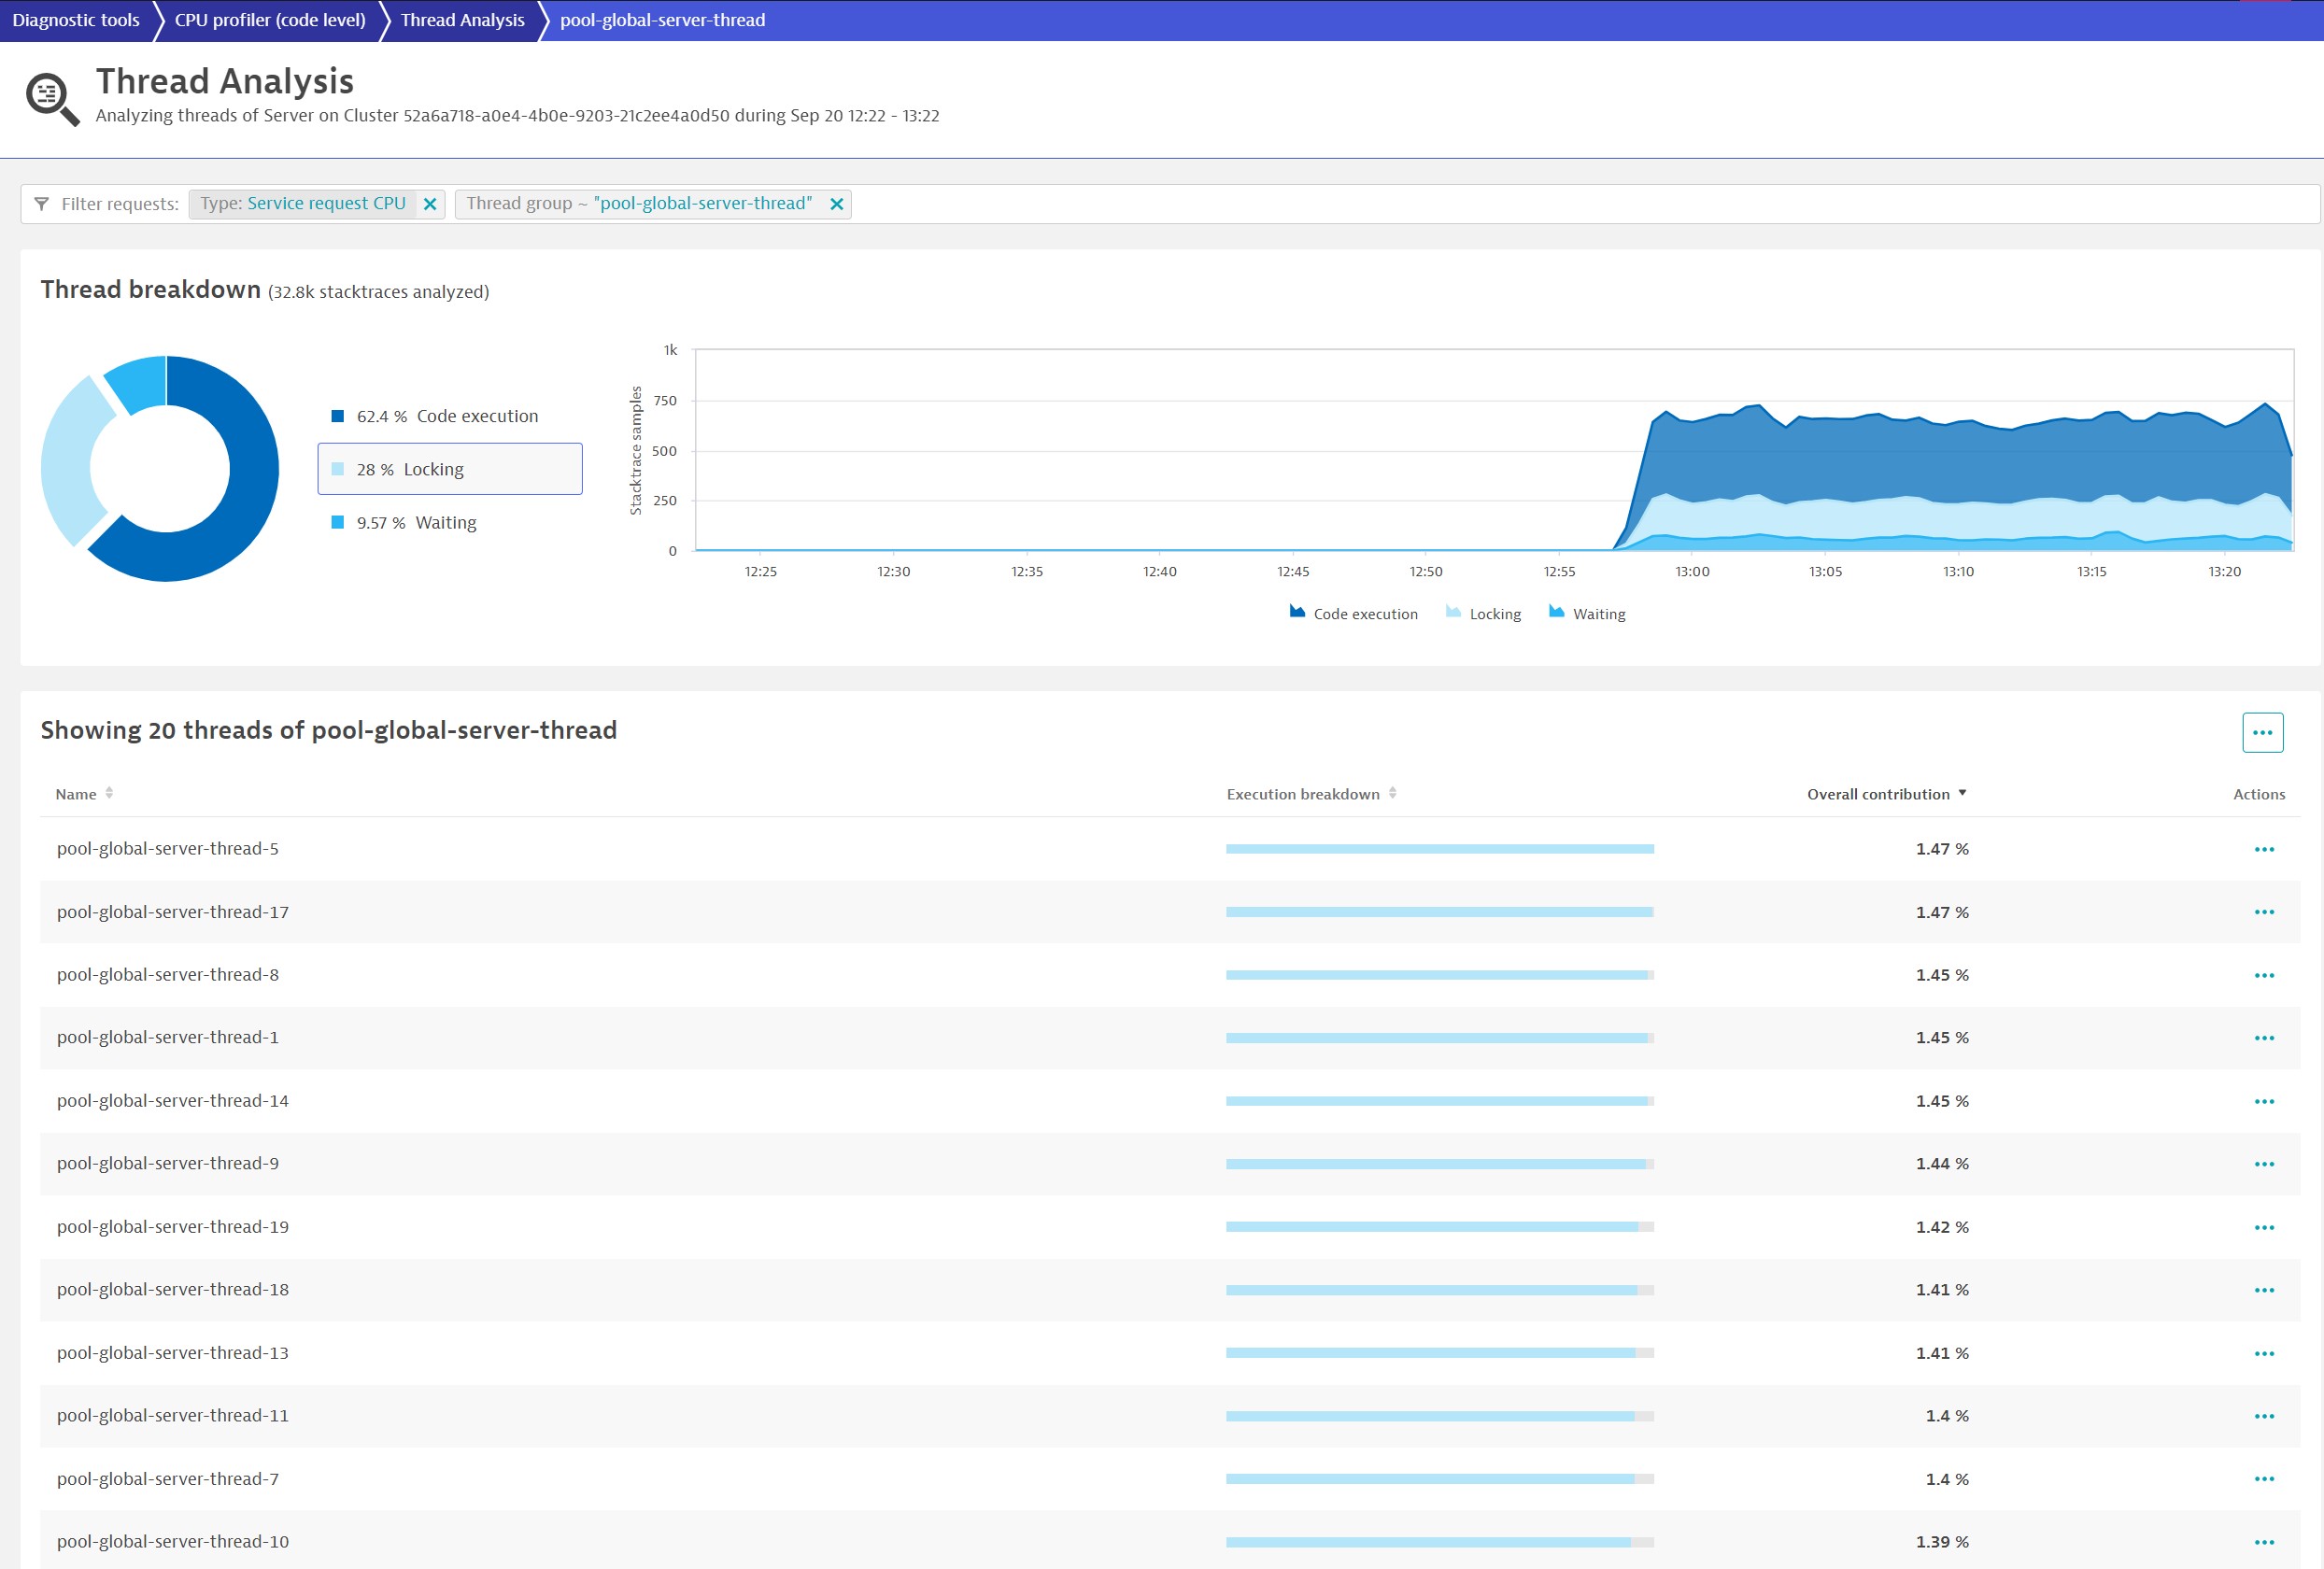
In this thread group, a considerable amount of time is continuously spent in locking—almost 30%. Also, it’s distributed across many threads, which indicates that this is a general lock across all those threads. Such behavior not only limits speed but also your ability to increase throughput by adding resources. Ultimately, it leads to a state where your system won’t be able to process more data even if you add more hardware.
At this point, you might want to know the root cause. A single click on the method hotspot provides the answer:
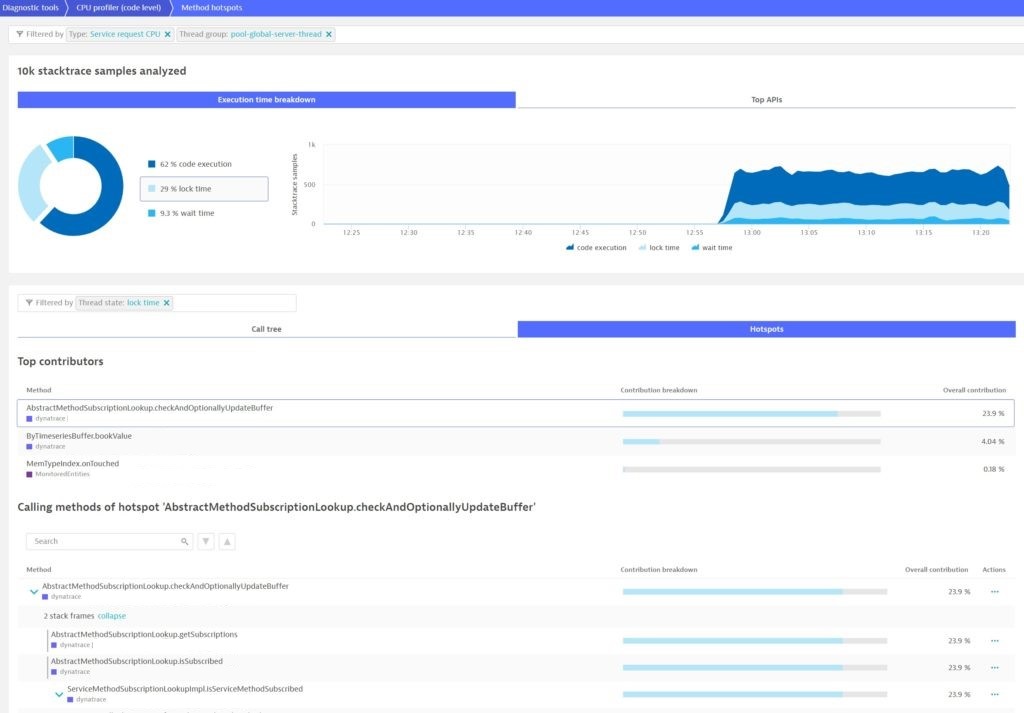
As you can see, with only a few clicks, you are now armed with information that helps fix the problem of locking. Based on this, you can go back and test different ways to write this code. Soon the differences become obvious:
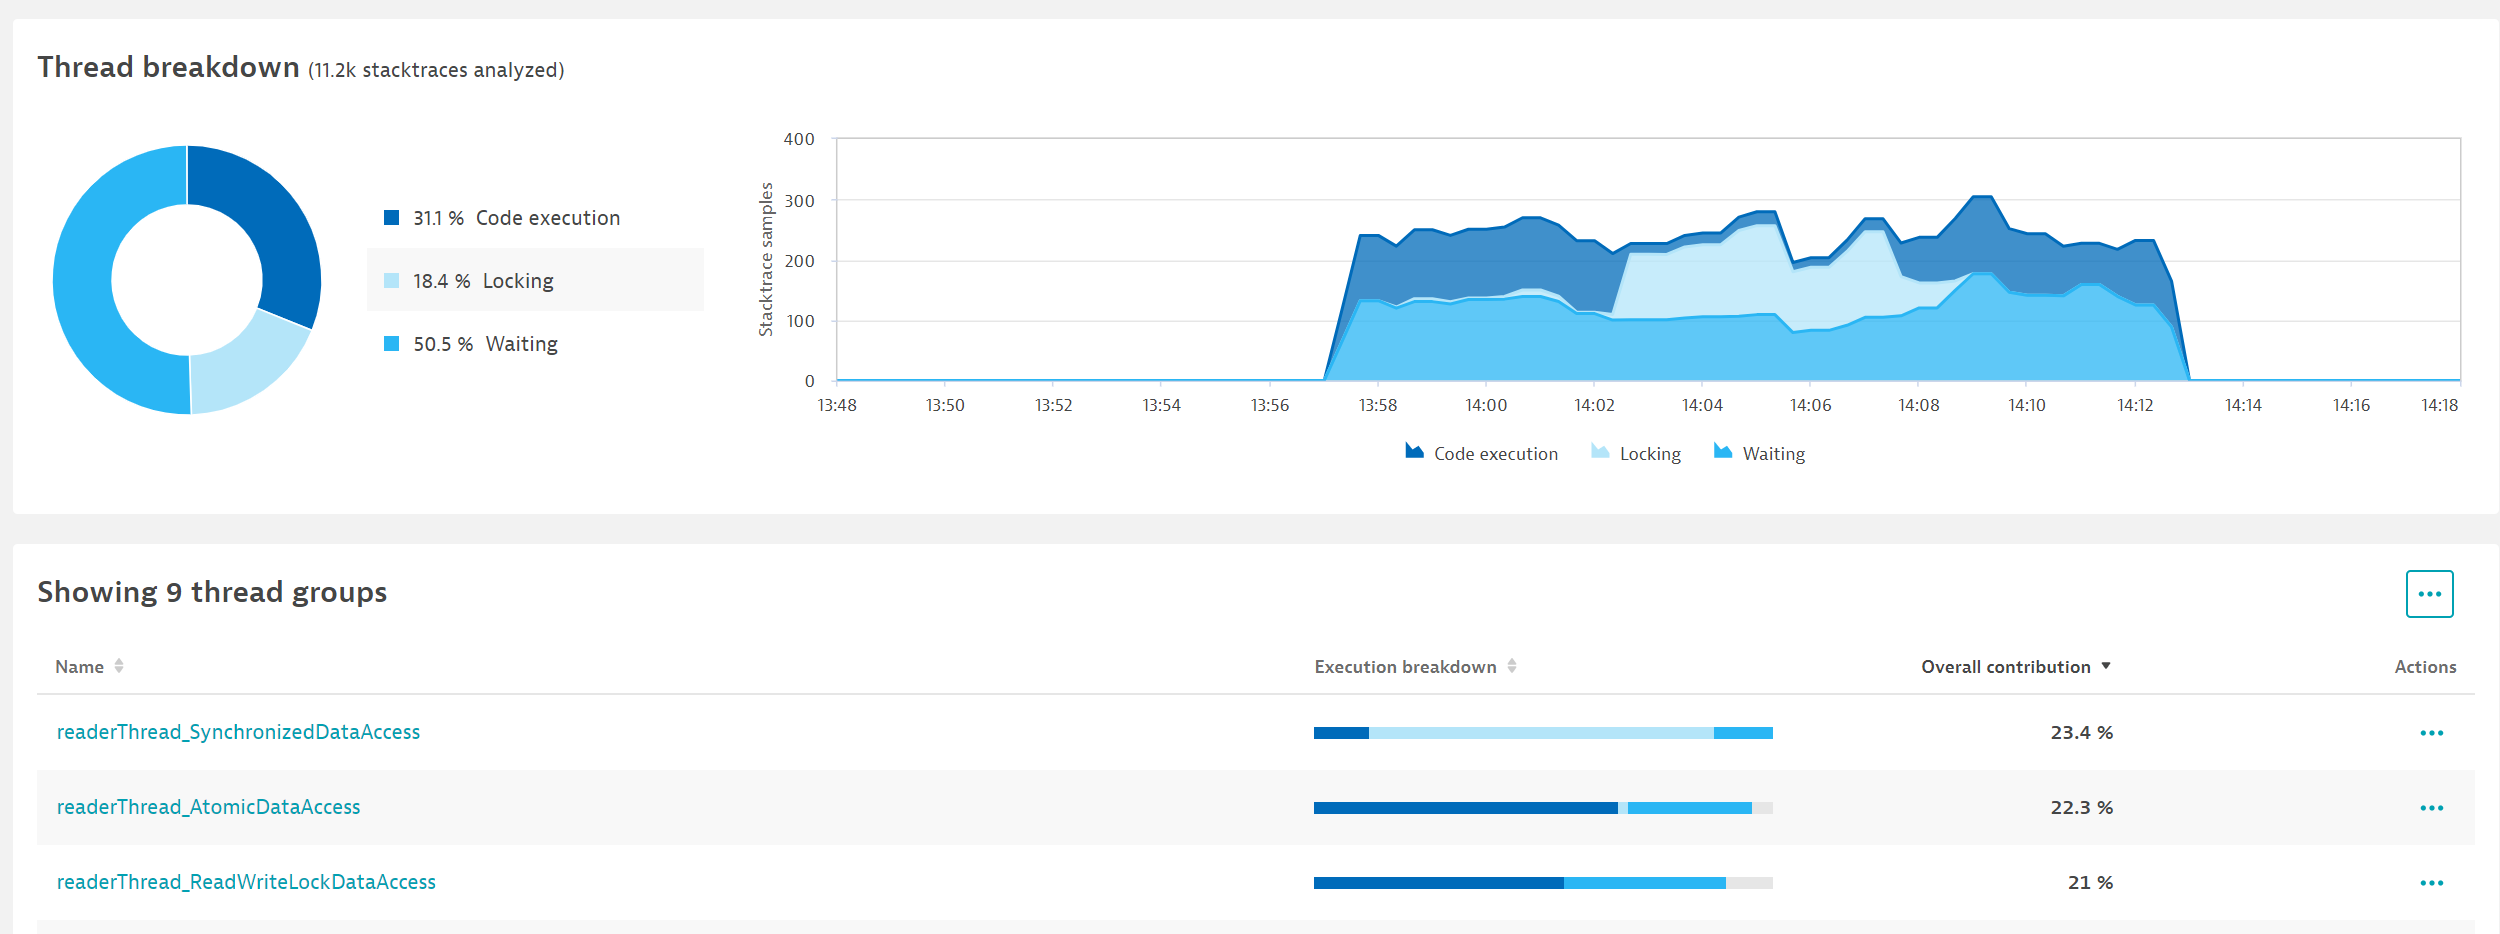
The original code used the Java-synchronized feature. We can see in the breakdown of execution time that it spends most of its time in locking. What’s more important is that it spends very little time executing code. The other two options spend very little time in locking, more time waiting, and what’s important, much more time doing actual work—they spend 3-4 times more time on executing code. In this particular case, due to the many threads involved, the new code performs about 200 times faster than the original one.
Use case #2: Automatically identify CPU-hungry thread groups
Now, let’s look at a Cassandra process group and see if we can find any CPU-hungry threads and thread groups. On this page, the difference from a typical thread dump becomes obvious: the data is continuously available, with historical context, and doesn’t need to be triggered if a problem occurs.
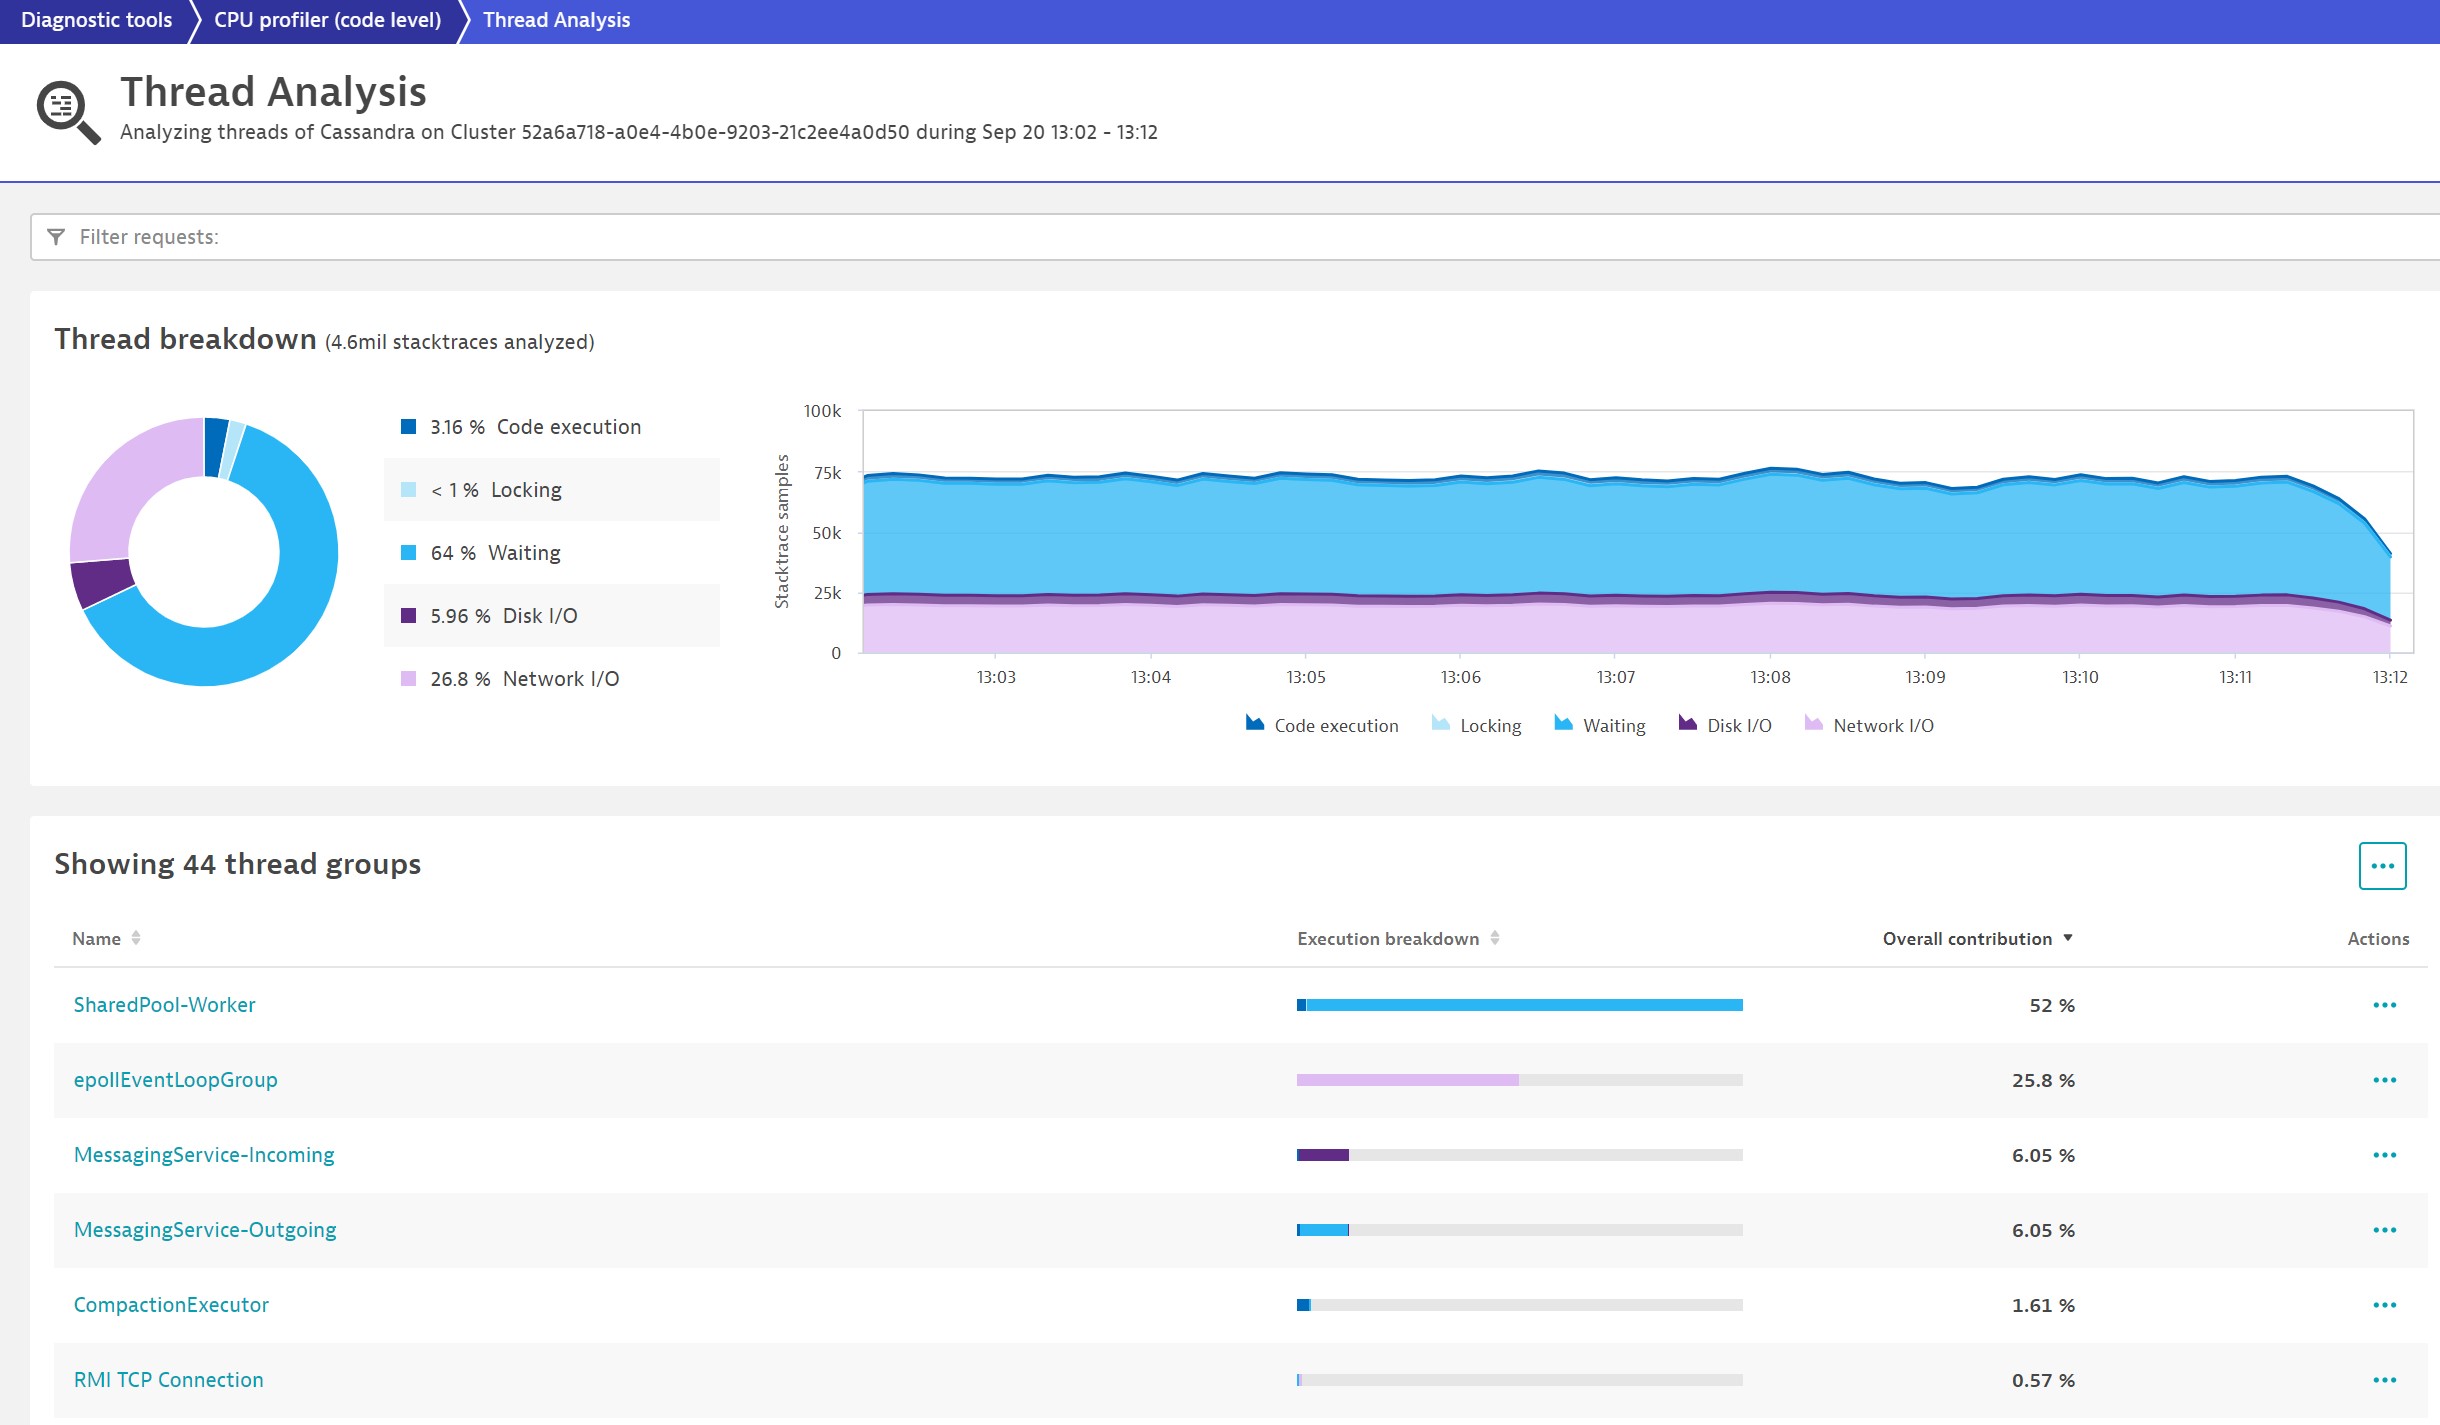
At the bottom of the page, you see all the thread groups that Dynatrace has identified in the Cassandra process group. Dynatrace has its own mechanism to identify thread groups. As different thread groups typically run different functionalities, this is useful. This immediately gives you a good way of segmenting the CPU consumers.
Let’s look at the code execution to see which thread is responsible for CPU consumption:
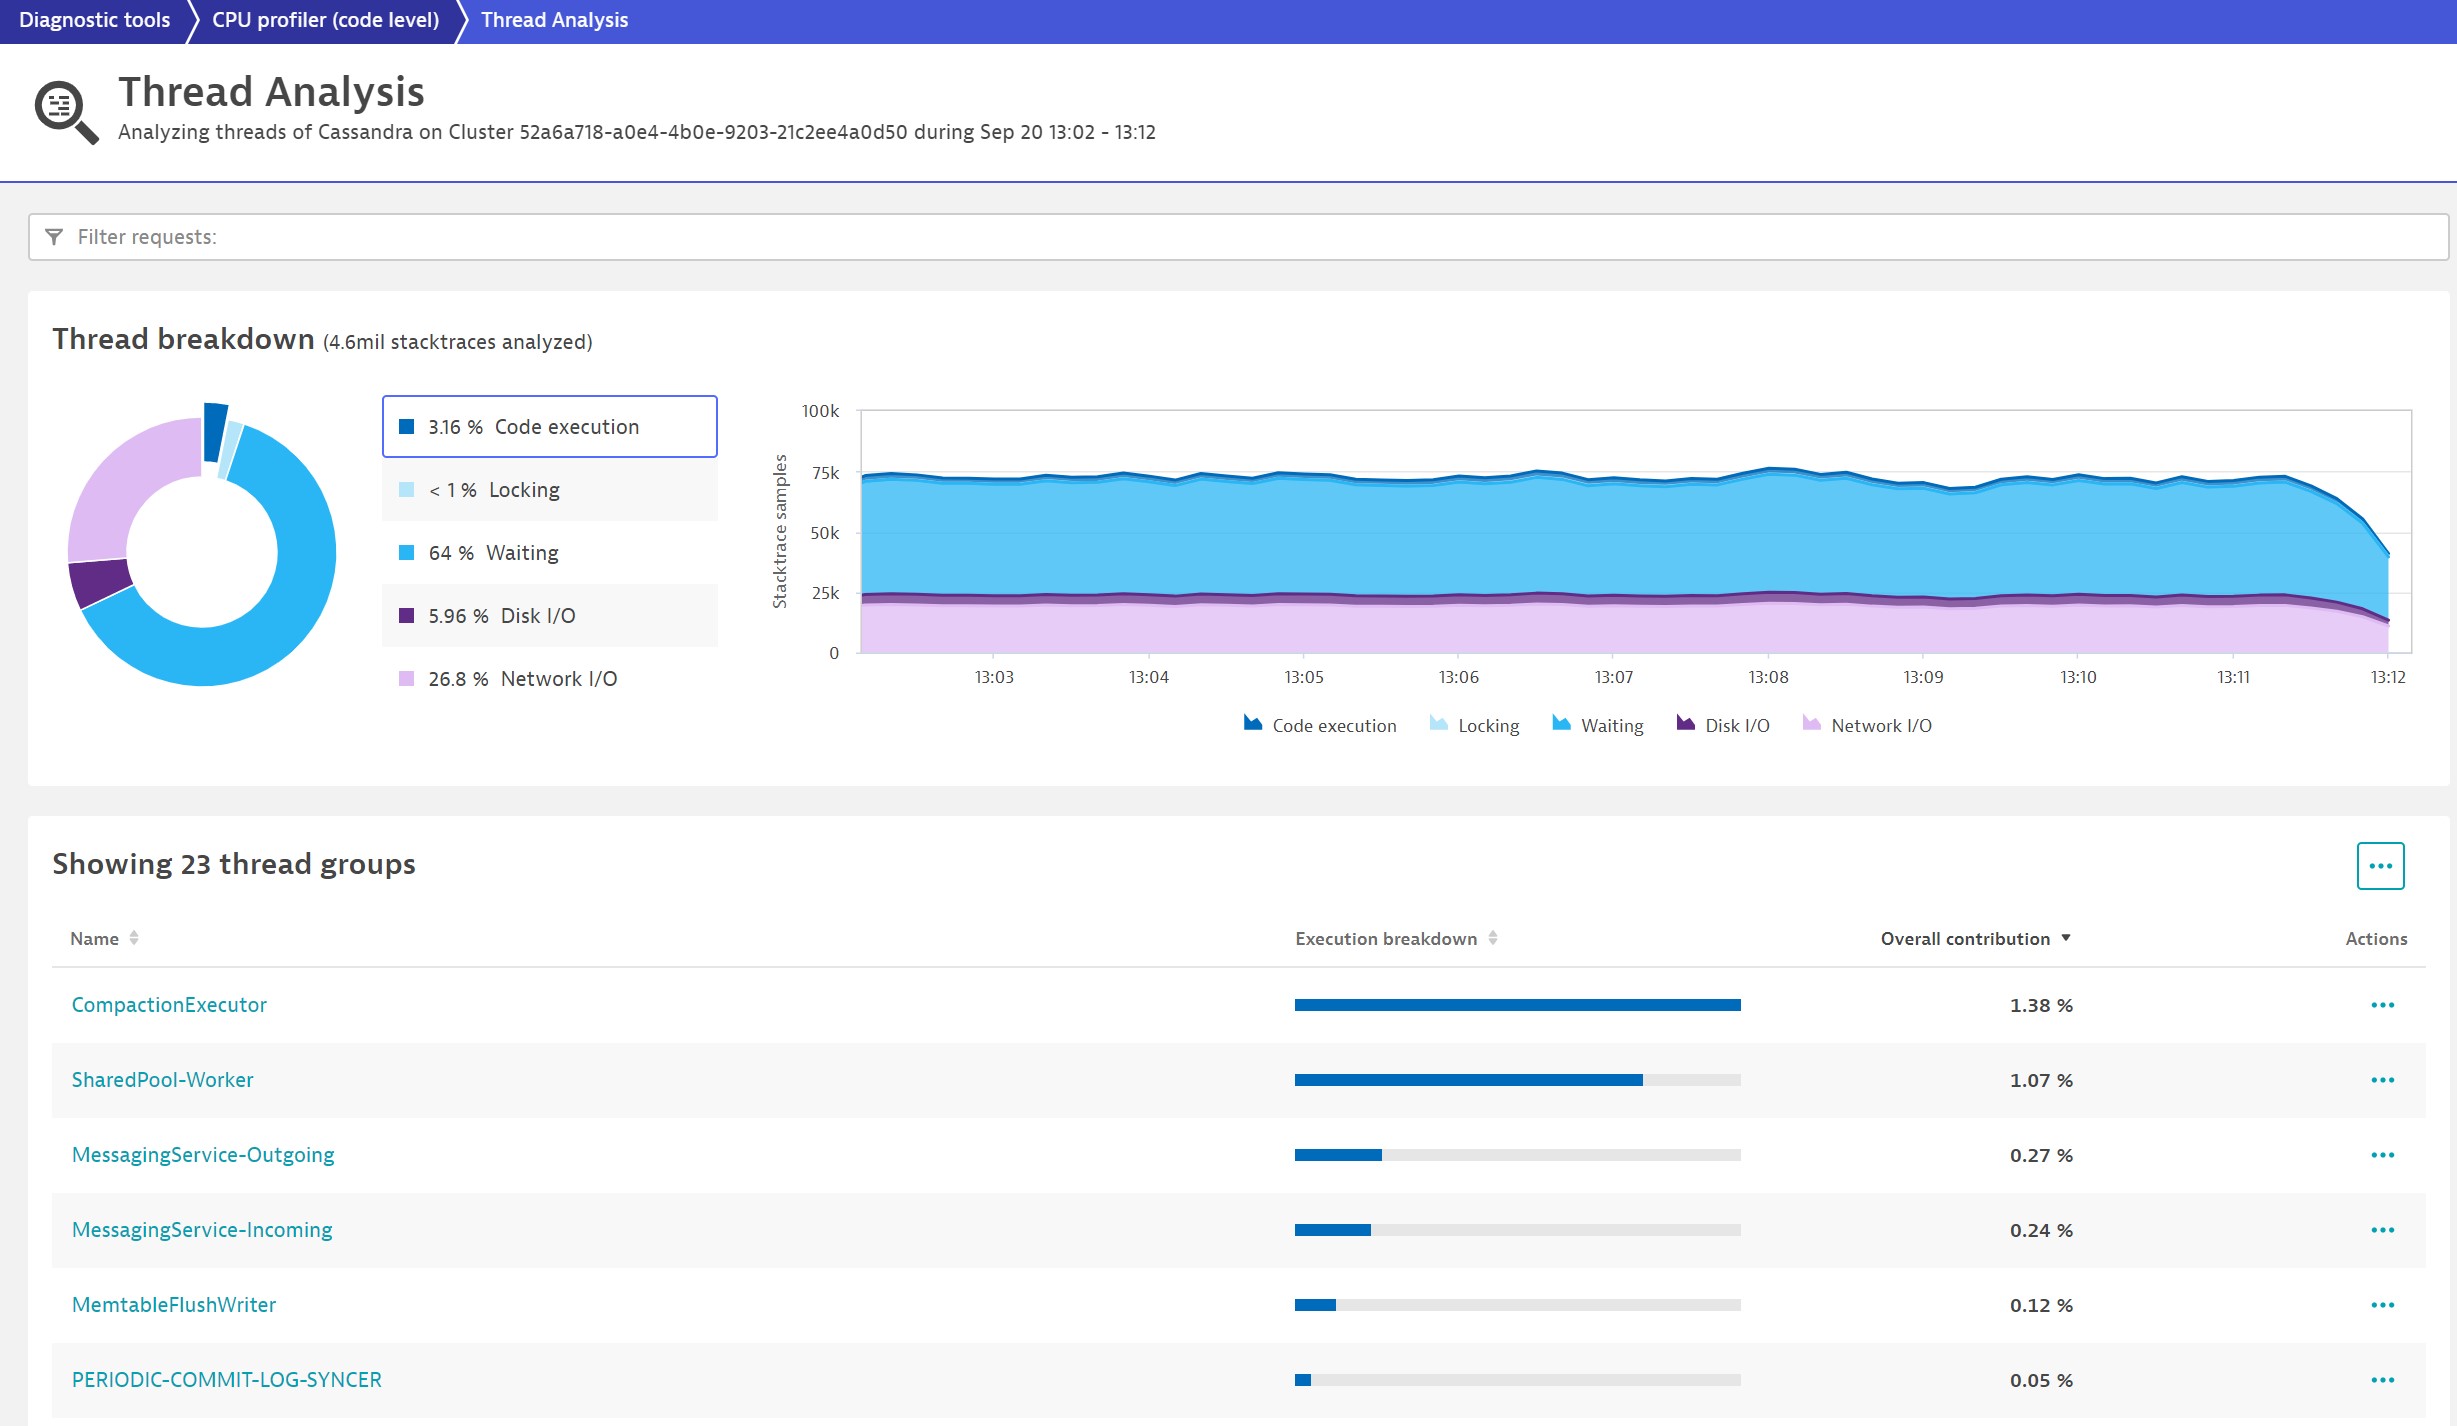
Apparently only two thread groups consume CPU in Cassandra: CompactionExecutor and SharedPool-Worker. Let’s take a closer look at the CompactionExecutor.
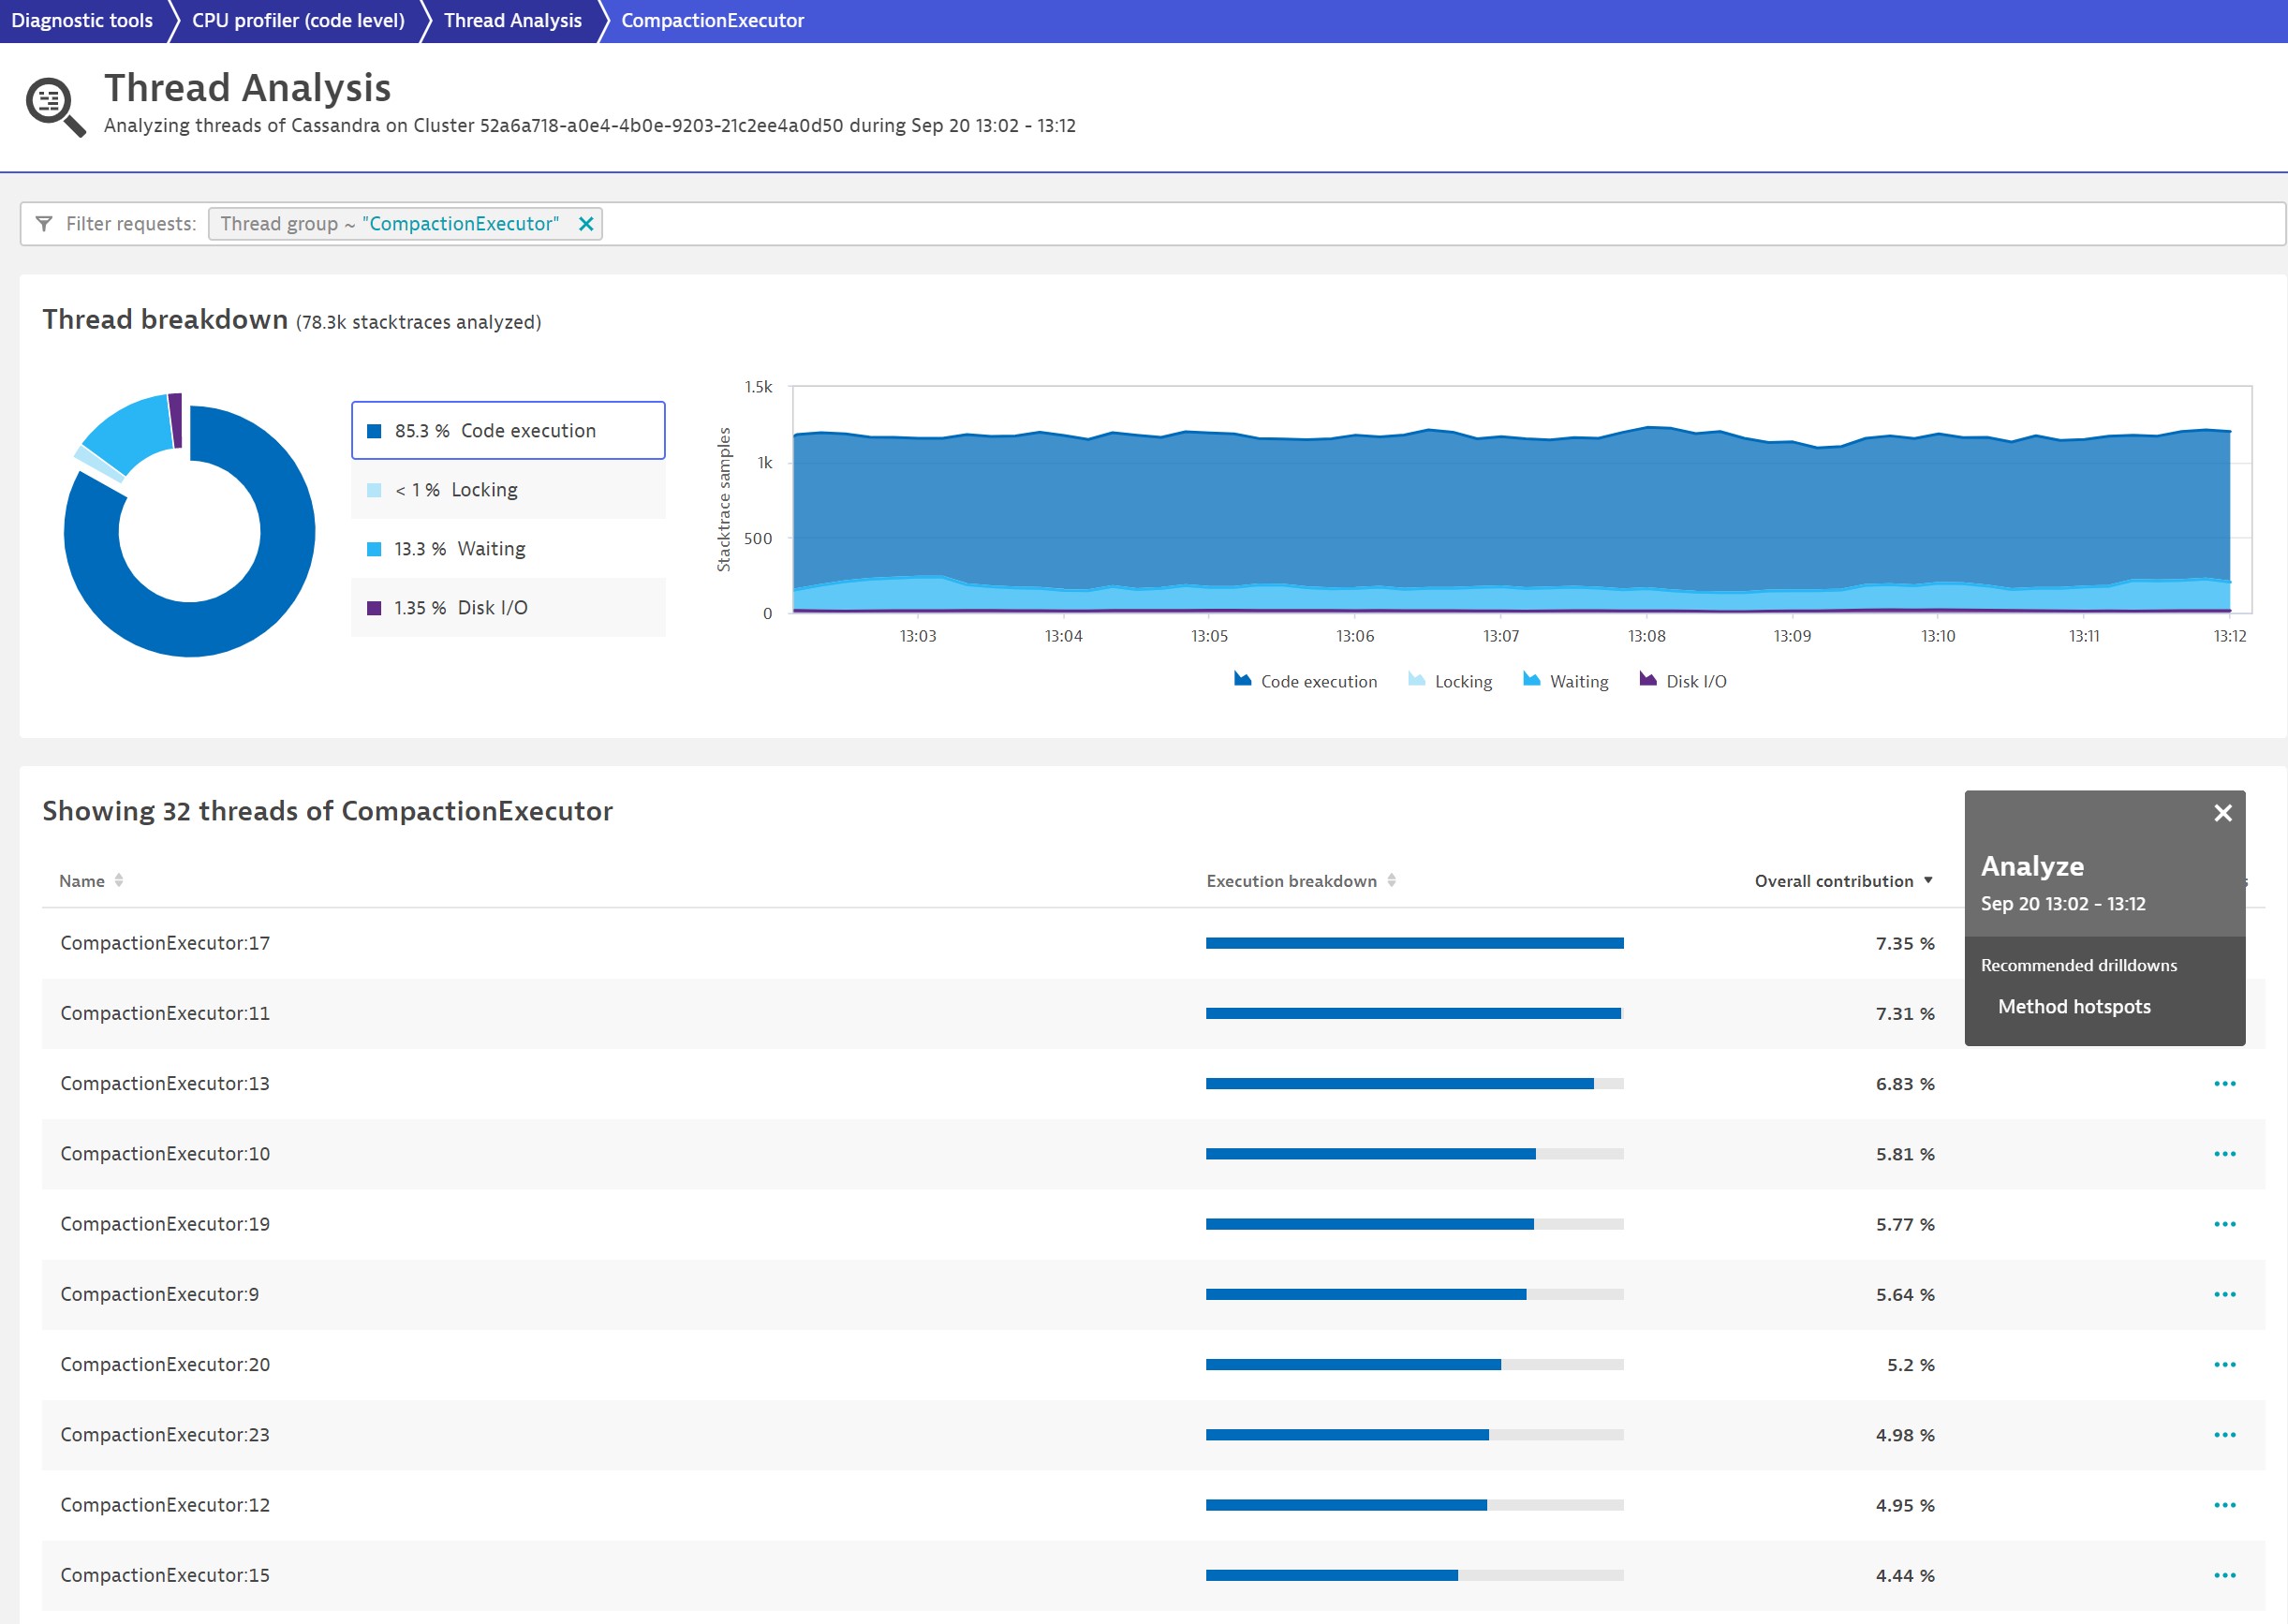
The bars in the table above show that it’s fairly well-balanced; it mostly executes code and doesn’t have many locks or wait periods.
You might want to know exactly what code is executed. With Dynatrace, the answer is a single click away. Simply use the context menu on the top of the table for a single thread or the whole thread group. This time, we look at a single Cassandra thread group CompactionExecutor in the method hotspot view.
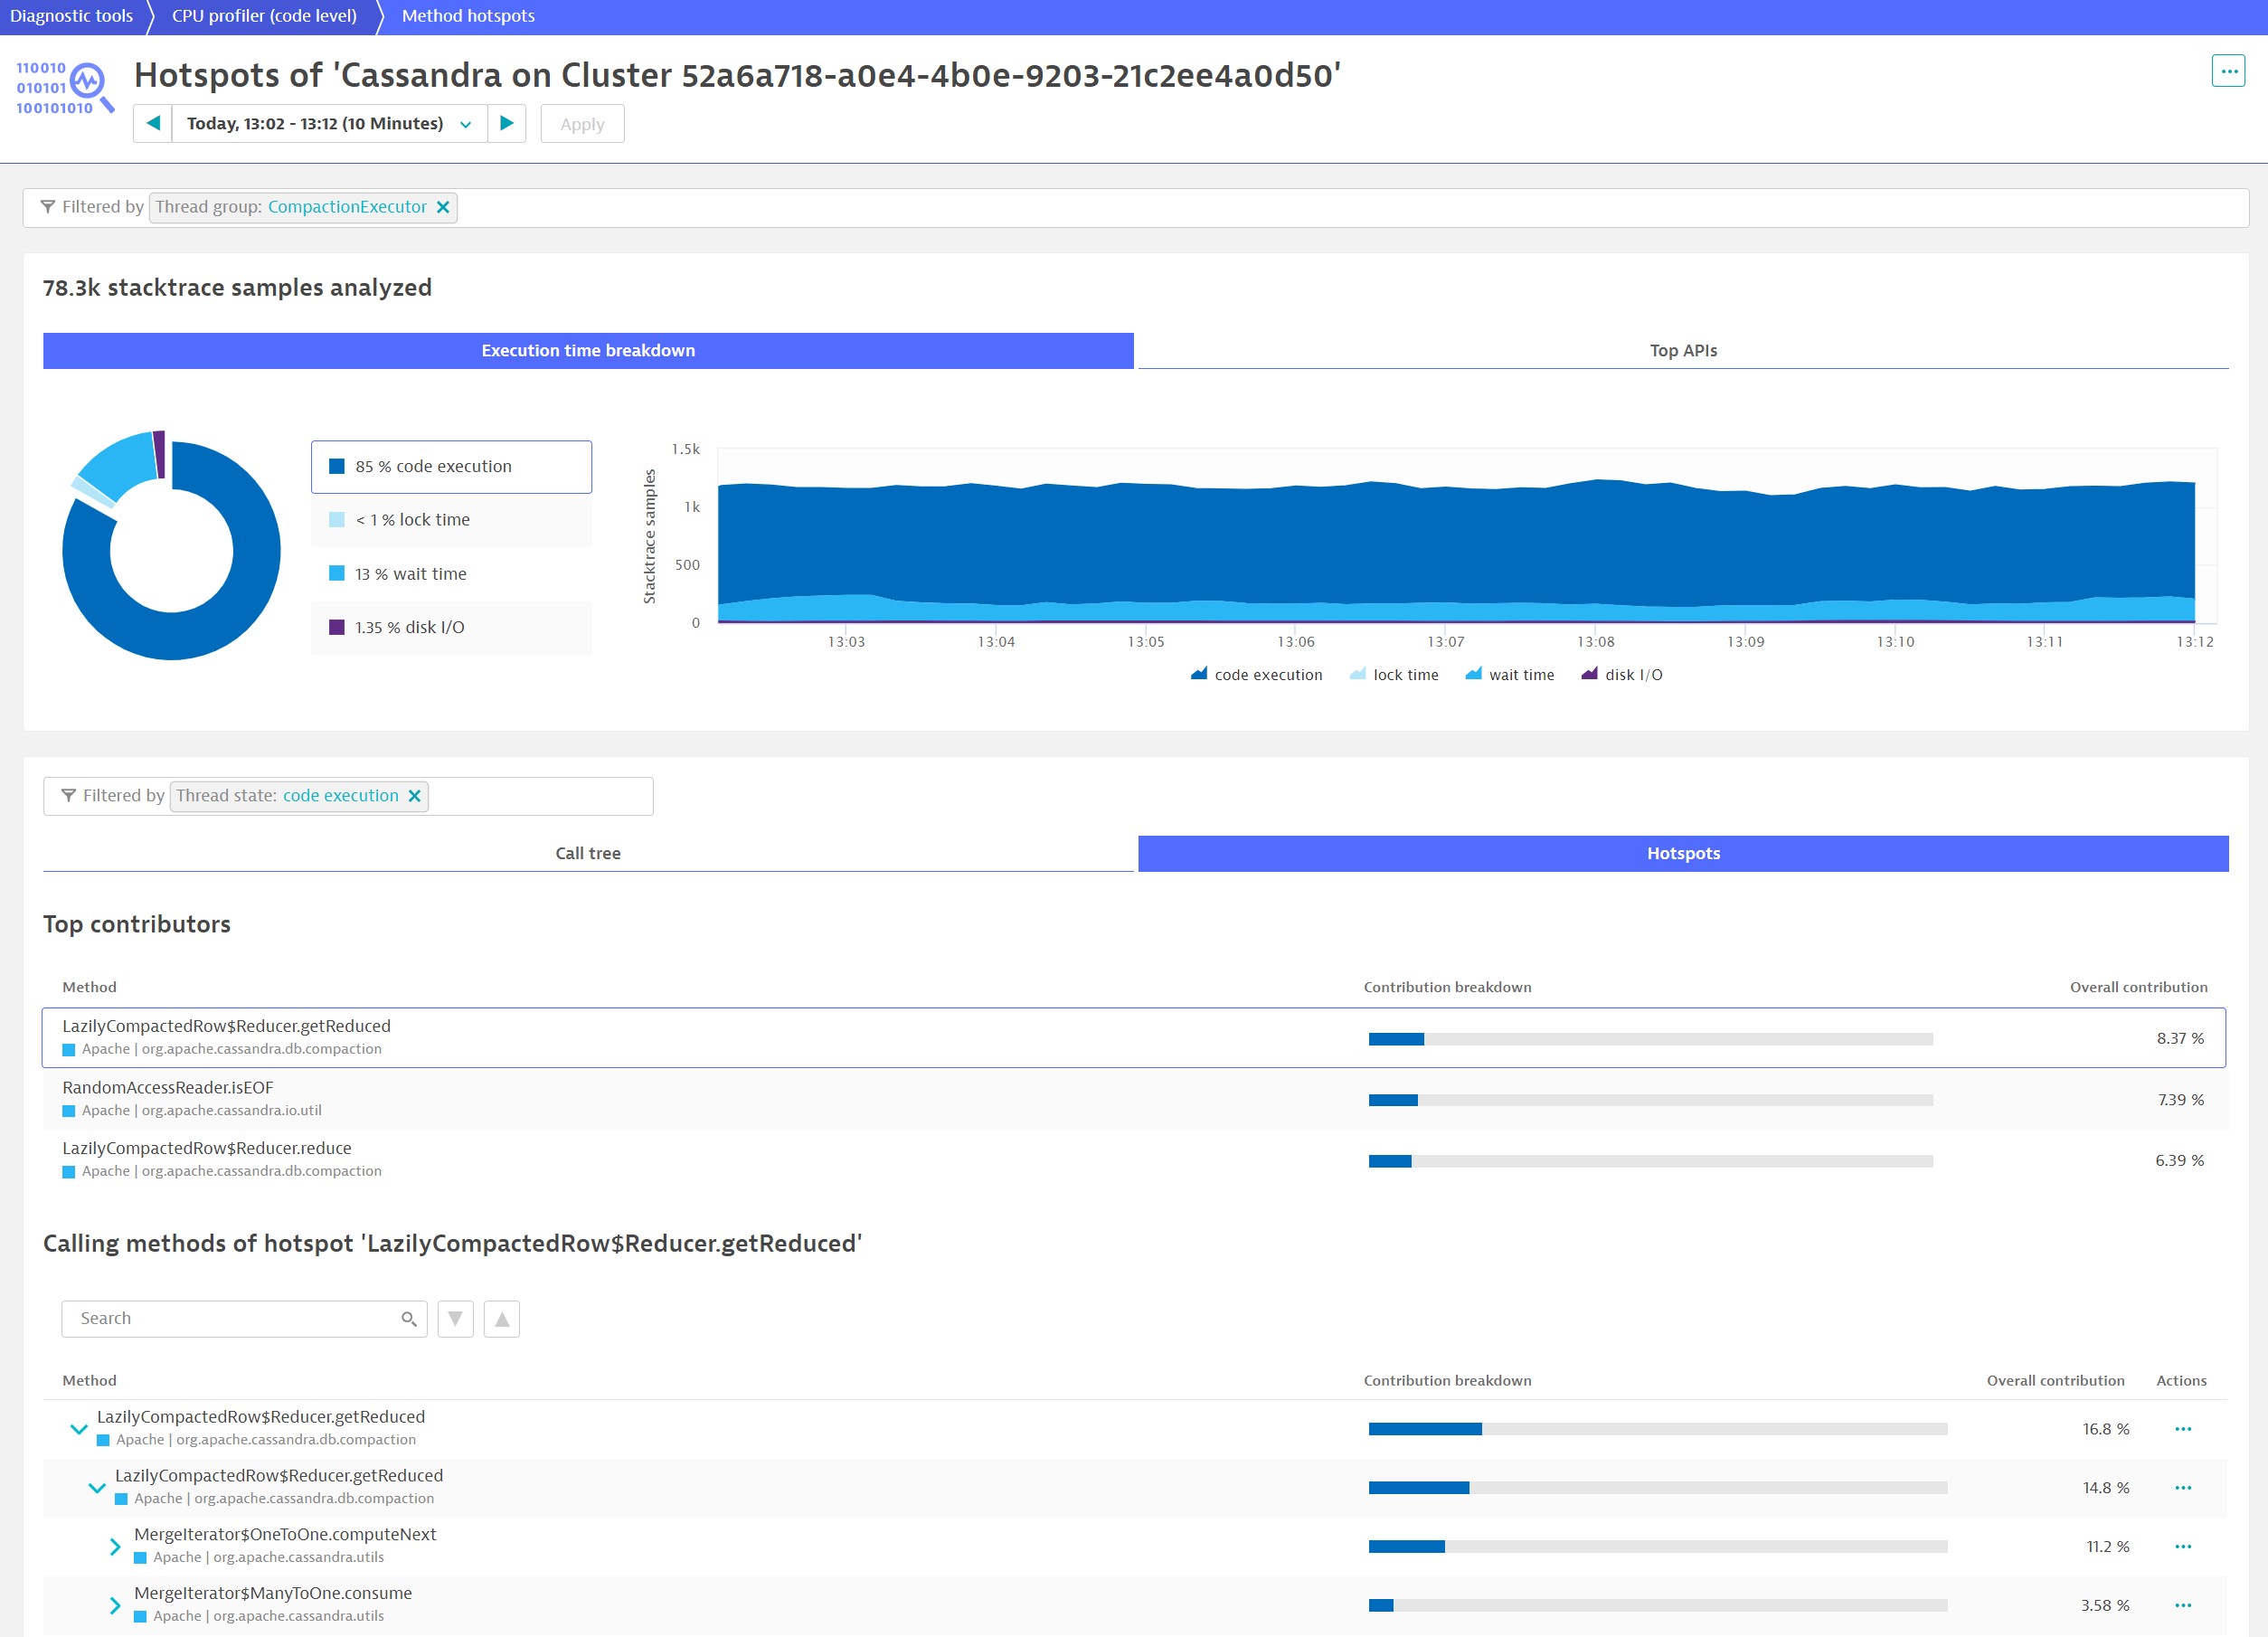
The hotspots can be seen immediately. They aren’t massive, but they do show how easy it is to hone in on potential optimizations.
What’s next
All new OneAgent features, including continuous thread analysis, are released in Early Adopter mode, and so you need to opt-in to use them. Once new features have had adequate exposure to real-world environments, we make them generally available.
In the future, we want to further enhance thread analysis; you’ll be able to better focus on CPU consumers and detect locks more quickly and accurately. Among other things, you’ll also be able to understand which thread is responsible for high allocation pressure, so stay tuned.
Start a free trial!
Dynatrace is free to use for 15 days! The trial stops automatically, no credit card is required. Just enter your email address, choose your cloud location and install our agent.


Looking for answers?
Start a new discussion or ask for help in our Q&A forum.
Go to forum