Citrix is a sophisticated, efficient, and highly scalable application delivery platform that is itself comprised of anywhere from hundreds to thousands of servers. It delivers vital enterprise applications to thousands of users. SAP GUI and other thick-client Windows applications are often delivered via Citrix. Therefore, it requires multidimensional and multidisciplinary monitoring:
- Infrastructure health—automatically monitor the compute, storage, and network resources available to the Citrix system to ensure a stable platform.
- Platform performance—get visibility into the performance of the Citrix platform to optimize application delivery.
- Real user experience—ultimately understand real user experience within application front ends to optimize user satisfaction.
Dynatrace is naturally suited to address these requirements with its automatic and AI-powered full-stack software intelligence platform. The Citrix monitoring extension extends Dynatrace visibility into Citrix user experience and Citrix platform performance.
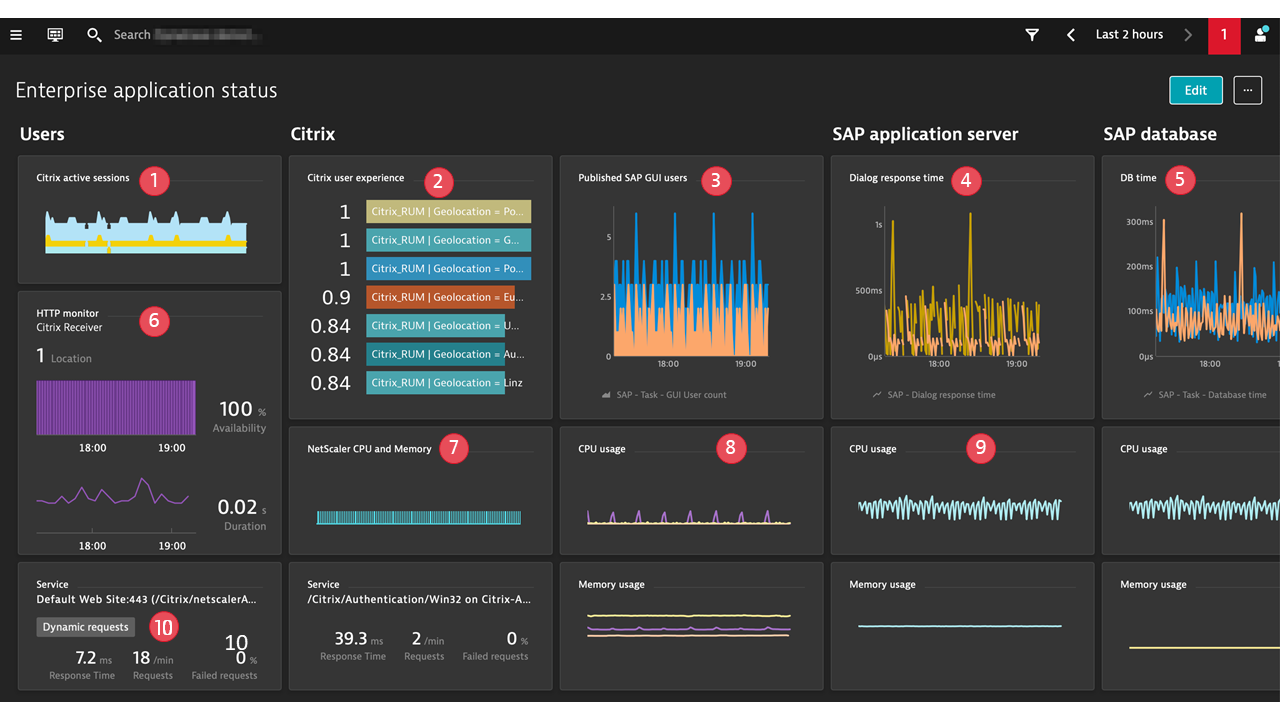
Image callout numbers
- OneAgent plugin: real Citrix user sessions
- Dynatrace Extension: Citrix user experience
- Dynatrace Extension: SAP ABAP platform load, by users
- Dynatrace Extension: SAP ABAP platform performance
- Dynatrace Extension: database performance as experienced by the SAP ABAP server
- Synthetic monitoring: Citrix login availability and performance
- Dynatrace Extension: NetScaler performance
- OneAgent: Citrix infrastructure performance
- OneAgent: SAP infrastructure performance
- OneAgent: Citrix StoreFront services discovered and monitored by Dynatrace
Dynatrace software intelligence helps you manage Citrix environments and real user experience more effectively
Dynatrace automation and AI-powered monitoring of your entire IT landscape help you to engage your Citrix management tools where they are most efficient. Dynatrace isolates the fault domain for you, and if it turns out to be Citrix, you’ll be certain that the deep dive with Citrix-focused tools makes sense. When Dynatrace finds culprits in applications delivered via Citrix, you’ll have a single, independent source of truth to confirm that Citrix is not the source of performance bottlenecks.
Infrastructure health—automatically monitor your Citrix landscape infrastructure for highest performance and availability
Dynatrace automatically discovers and maps all components of Citrix landscapes and maps their dependencies in order to provide AI-powered answers on performance challenges or delivery issues. It provides the bottom line of Citrix virtual application and desktop (formerly XenApp and XenDesktop) infrastructure performance.
Dynatrace OneAgent monitors all Windows hosts that comprise the Citrix landscape, including your virtualization stack, tracking basic infrastructure performance and usage. All processes on these hosts are recognized, and Citrix processes are grouped together in order to characterize the combined Citrix overhead on the infrastructure. Citrix user processes are also monitored, and when a user process starts to consume significant resources on a shared machine, it is surfaced by Dynatrace.
Therefore, OneAgent is the first and most important ingredient of Citrix monitoring on every Citrix server.
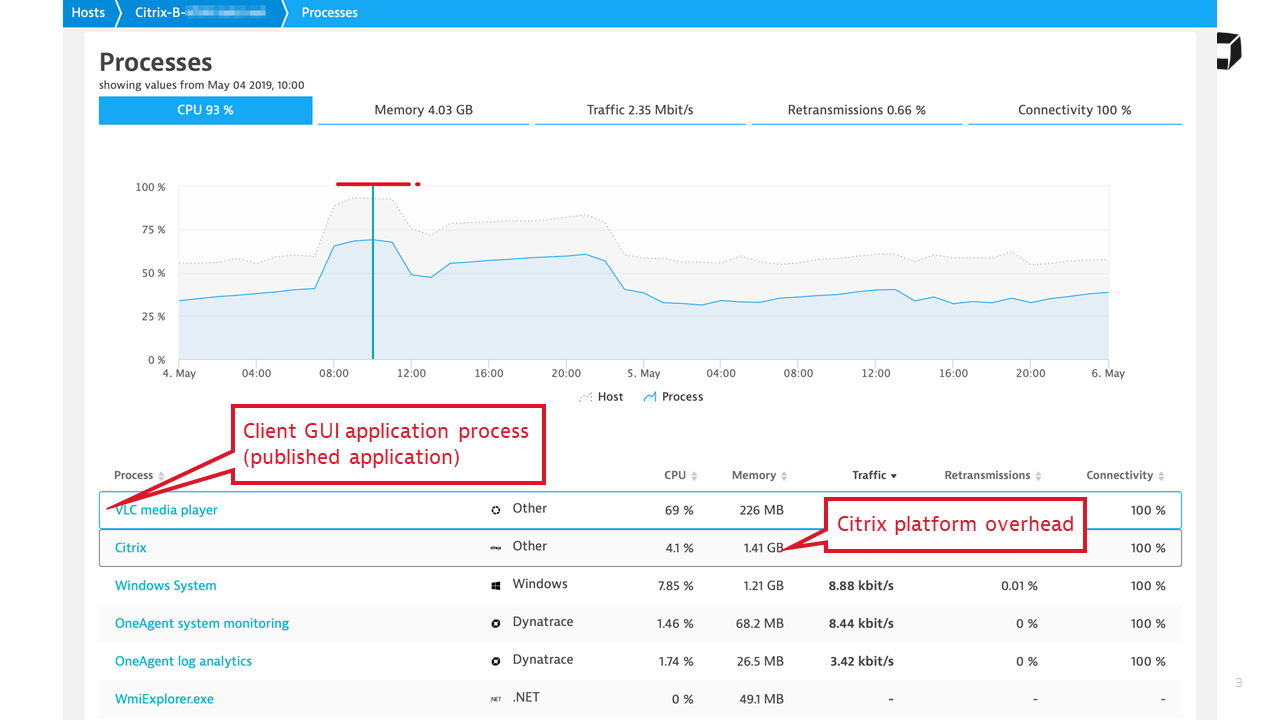
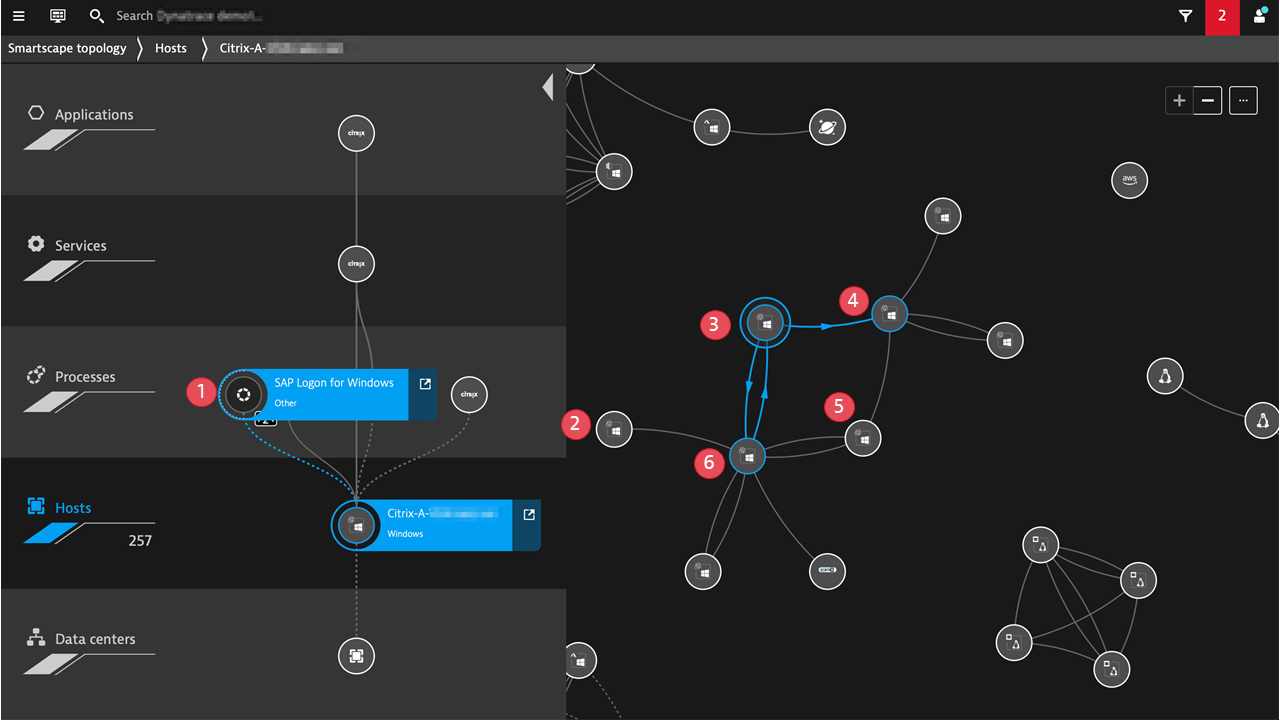
Image callout numbers
- SAP GUI delivered via Citrix – a process on Citrix VDA
- Netscaler
- Citrix VDA
- SAP server
- Citrix VDA
- Citrix StoreFront
Citrix platform performance—optimize your Citrix landscape with insights into user load and screen latency per server
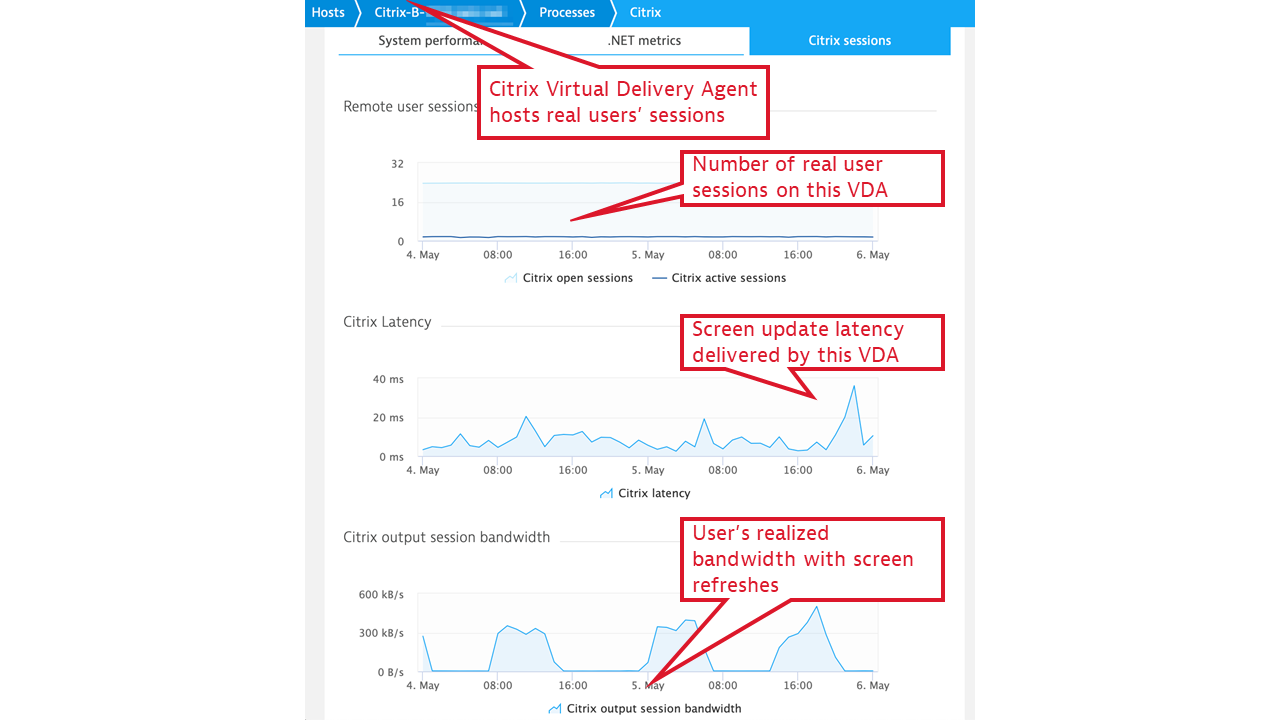
As a part of the Citrix monitoring extension for Dynatrace, we deliver a OneAgent plugin that adds several Citrix-specific WMI counters to the set of metrics reported by OneAgent. These metrics help you understand whether your Citrix landscape is sized correctly for its load. They provide important characteristics of the Citrix Virtual Delivery Agent (VDA) usage and performance:
- Optimize server sizing with session insights.
The number of open and active Citrix sessions tells us how many users share a specific Citrix VDA instance. You can combine these insights along the CPU and memory consumption of the VDA host in order to see whether Citrix servers are correctly sized for the load. Comparison of these metrics between VDAs characterizes load balancing efficiency. - Understand the impact of VDA oversubscriptions on user experience.
Citrix latency represents the end-to-end “screen lag” experienced by a server’s users. This metric is usually related to VDA CPU, memory, and network bandwidth utilization and can help you ensure that oversubscribed VDAs do not adversely affect users’ onscreen experience. - Tie latency issues to host and virtualization infrastructure network quality.
Citrix output session bandwidth looks at the load incurred by the server’s network interfaces as a result of screen updates. Network congestion measurements, routinely conducted by OneAgent, can be related to Citrix session network bandwidth demand, and, thus, user-experienced latency issues can be traced to host and virtualization infrastructure network quality.
These metrics are grouped under the Citrix process group, in the Citrix sessions tab:
Real user experience—ensure fast and error-free application launches and minimum screen latency across all regions
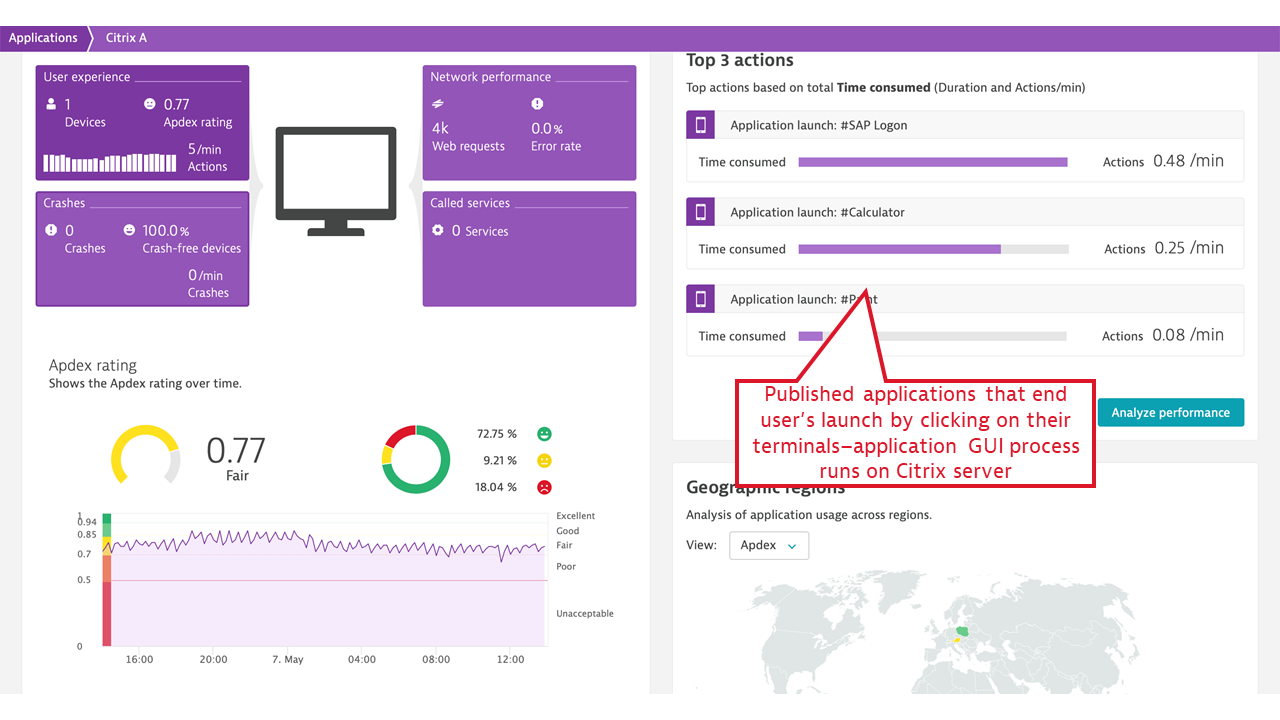
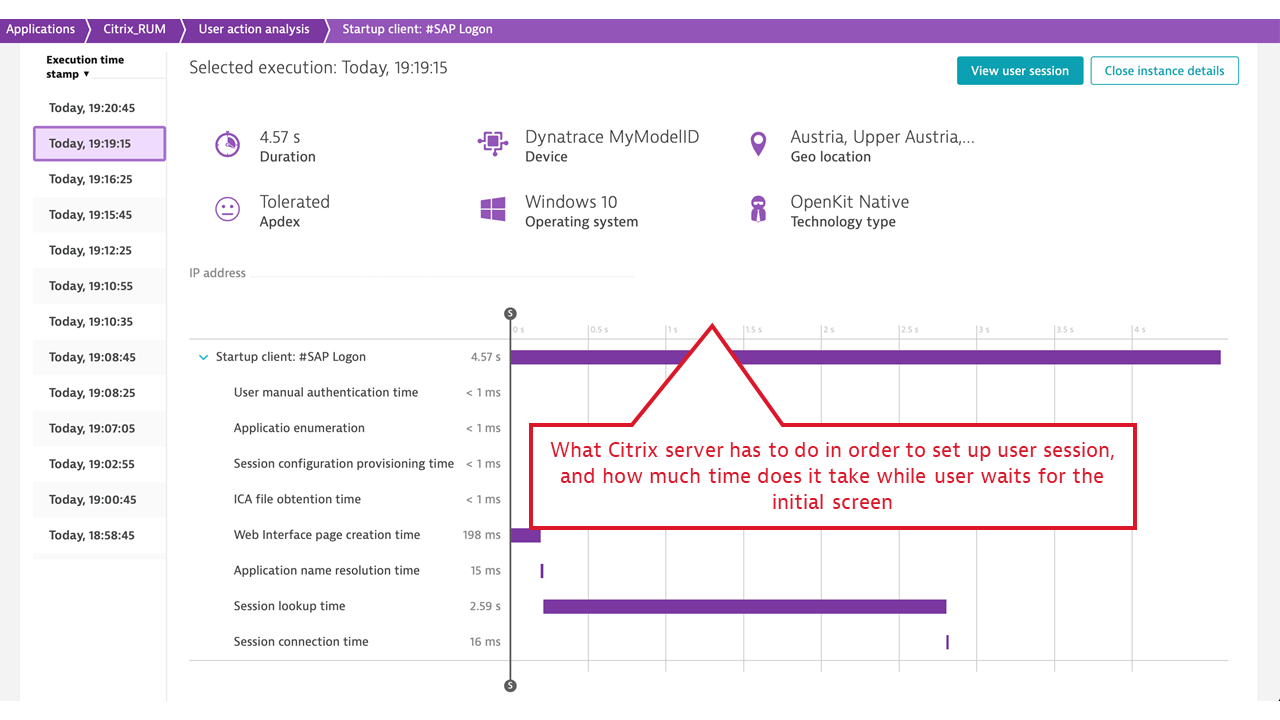
Citrix isn’t an application in and of itself, but rather an application delivery channel, which makes measuring real user experience in the presence of Citrix different. Ideally, Citrix’s presence should be transparent to a desktop application user: when the user clicks an icon, the application should behave as if it were executing on the user’s machine. Citrix internally collects the data necessary to measure two aspects of real user experience: application launch time and screen latency.
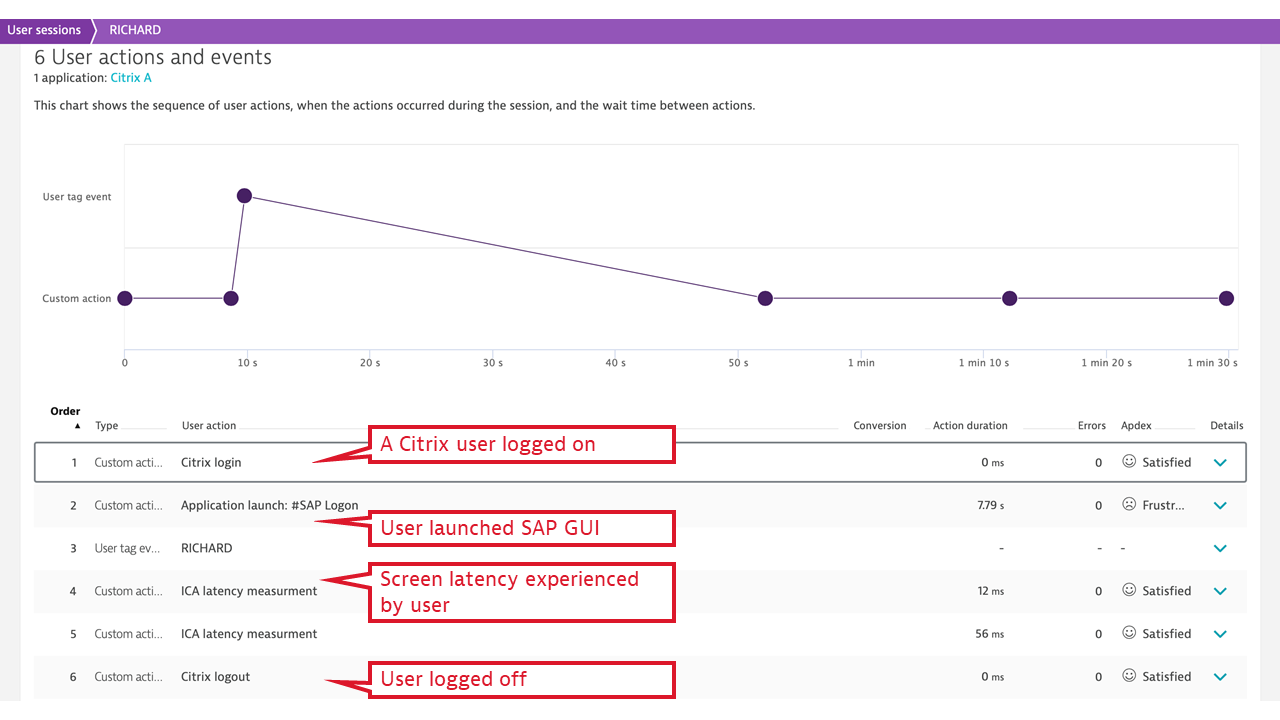
Dynatrace makes use of these internal Citrix events and counters and expresses application launch time and screen latency measured individually per user in the simple, universally understood terms of Apdex. This helps in understanding the client location in relation to user experience. So the Citrix monitoring plugin extends OneAgent to collect the Citrix real user monitoring-specific metrics and, with the help of OpenKit, reports Citrix application launches and latency measurements at the individual user and individual application launch level, using simplified Dynatrace real user monitoring workflows.
With the Citrix monitoring extension, you specifically get insights into:
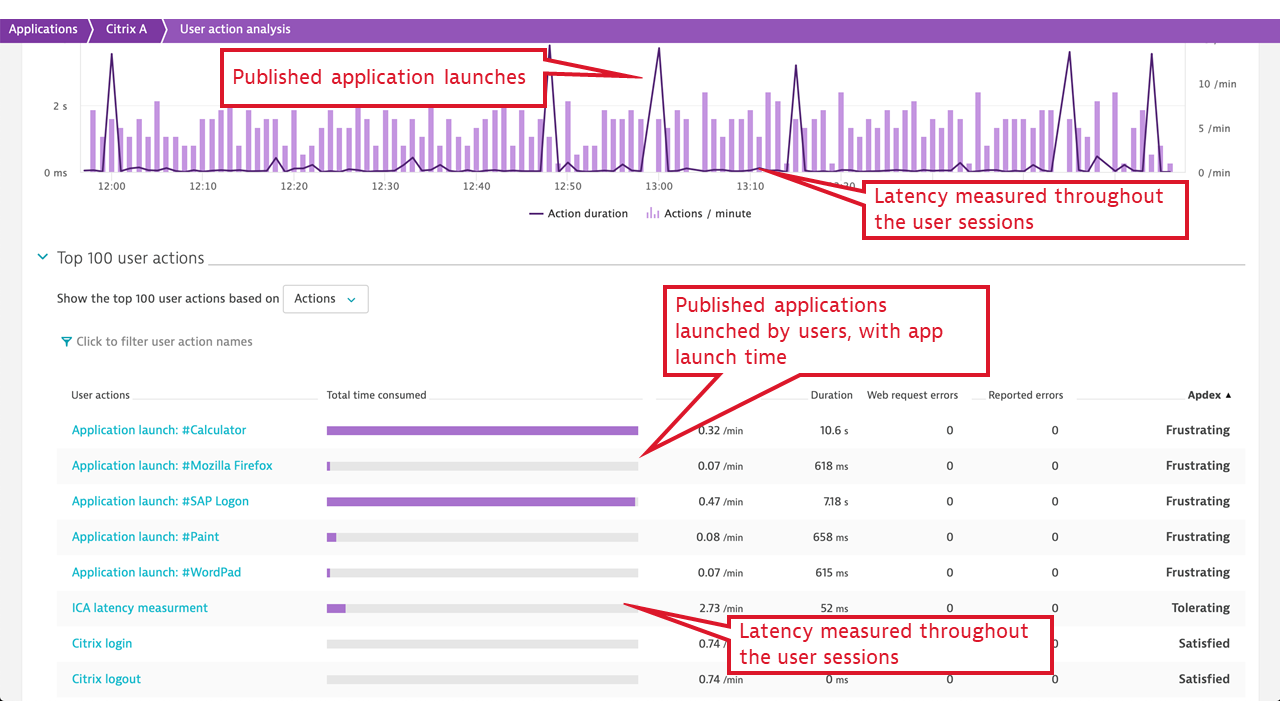
- Published application launch time, including a breakdown of all vital activities that Citrix must undertake to make the application available to the user. These include user authentication, license check, session lookup and setup (if no previous session exists), and more. When the application launch takes a significant amount of time, Dynatrace immediately provides guidance on the fault domains.
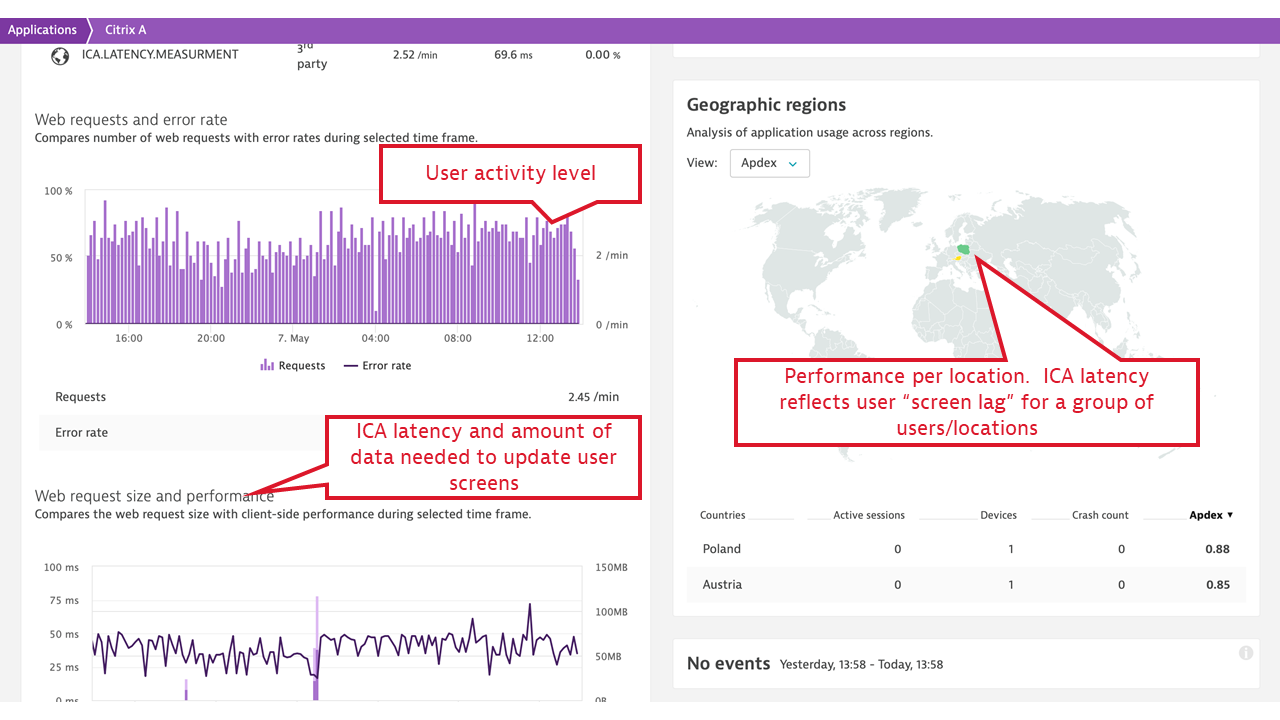
- ICA latency. This measurement synthesizes what Citrix users experience as “screen lag.” ICA latency is constantly measured by every Citrix client (receiver) and is reported back to the server. The measurement includes the total time required to refresh the terminal screen upon user action (including whole message trip through the network and the Citrix server stack, but not through the application). Therefore, ICA latency is one of the most important end-user experience measurements in the Citrix world. It’s the ultimate indicator of whether “Citrix is slow.”
- Login user name and terminal address, which is mapped to the client location. This is picked up for every individual Citrix session, user name, and terminal IP address, and allows for Citrix client groupings by location and further reporting on location-specific performance, represented by ICA latency and Apdex rating per location.
How to start monitoring Citrix with Dynatrace
The delivery approach that we’ve taken for this extension differs slightly from that of other Dynatrace features: the extension is installed using a Windows MSI package. While it’s independent of OneAgent, it should be installed on top of the OneAgent. In the other words, first deploy OneAgent to your Citrix VDAs, then deploy the extension MSI.
1. Deploy Dynatrace OneAgent
Deploy OneAgent on Citrix VDAs in order to monitor the infrastructure performance, compute and disk resources, and infrastructure dependencies. This is part of an infrastructure-monitoring only OneAgent setup.
2. Deploy Dynatrace extension for Citrix
Obtain the extension by contacting your Dynatrace ONE specialist via chat (upper-right corner of the Dynatrace menu bar). Installation procedure is comprehensively described in the Dynatrace documentation.
3. Using NetScaler? Extend Citrix infrastructure monitoring to NetScaler as well!
The NetScaler application delivery controller is often the initial interface for Citrix infrastructures. Dynatrace provides a dedicated extension for monitoring NetScaler. This extra infrastructure monitoring component completes Citrix application delivery channel monitoring with Dynatrace.
Will Dynatrace replace my Citrix monitoring solution (such as Citrix Director)?
We don’t aim to deliver a complete Citrix management solution. Your Citrix deep-dive performance management tools will still be needed. Likewise, your Citrix lifecycle management solution will be needed. The power of Dynatrace comes from its straightforward, yet holistic, view of the entire application delivery chain and infrastructure stack, including Citrix context where it’s applicable. We aim to help you track Citrix performance incidents to specific infrastructure bottlenecks and to clearly delineate application performance from application delivery performance.
Interested in extending Dynatrace to monitor Citrix?
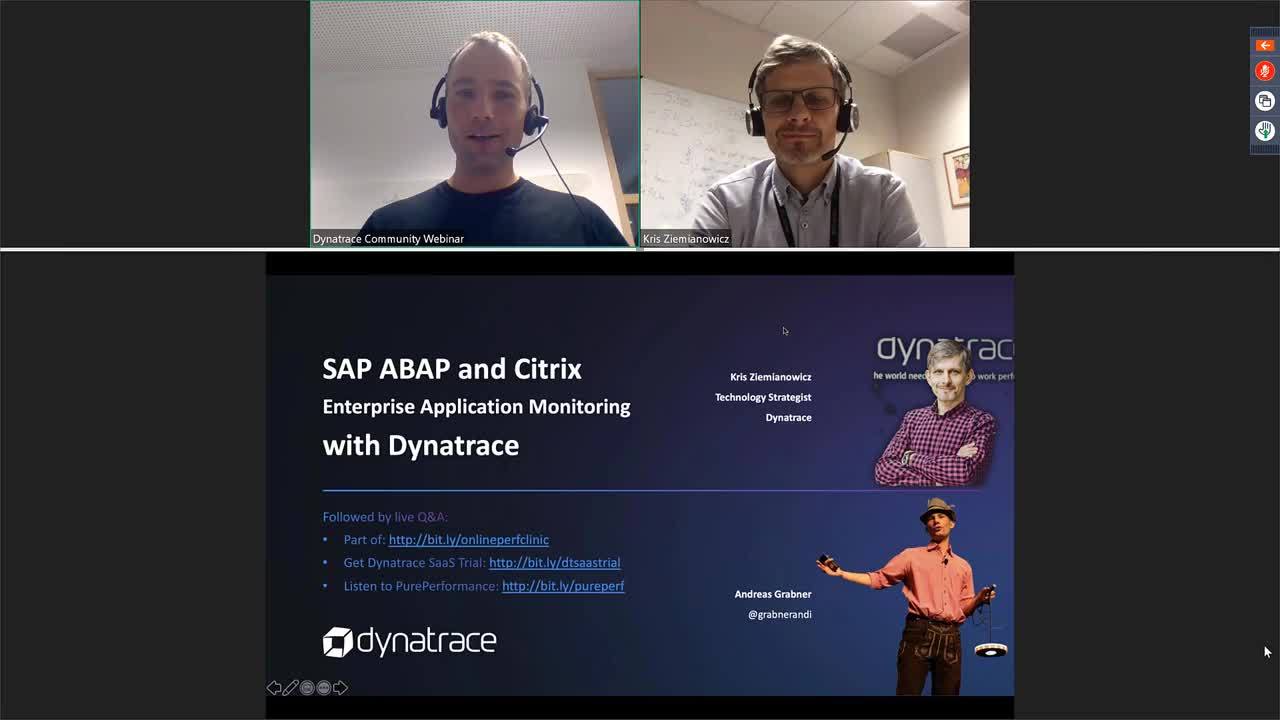
The quickest way to get started is by contacting a Dynatrace ONE product specialist. Just select the chat button in the upper-right corner of the Dynatrace menu bar. Also, make sure you watch this Performance Clinic webinar to learn more and start your Citrix platform and user experience monitoring with Dynatrace today!
Start a free trial!
Dynatrace is free to use for 15 days! The trial stops automatically; no credit card is required. Just enter your email address, choose your cloud location and install our agent.


Looking for answers?
Start a new discussion or ask for help in our Q&A forum.
Go to forum