Delivering software efficiently and reliably is a cornerstone of many organizations' business success today. Dynatrace fulfills a crucial role by aiding platform engineers with insights into the delivery processes to reveal performance bottlenecks, track pipeline improvements, and optimize resource consumption. To unlock pipeline observability for streamlining your software delivery processes, Dynatrace drives the standardization of software development lifecycle events as the foundation for analytics and automation use cases.
Today, development teams suffer from a lack of automation for time-consuming tasks, the absence of standardization due to an overabundance of tool options, and insufficiently mature DevSecOps processes. This leads to frustrating bottlenecks for developers attempting to build and deliver software. For multinational enterprises, the cost of all that toil, complexity, and frustration multiplies exponentially due to the size of those organizations. In such contexts, platform engineering offers a compelling solution to enable business competitiveness in a manner that significantly enhances the developer experience. A central element of platform engineering teams is a robust Internal Developer Platform (IDP), which encompasses a set of tools, services, and infrastructure that enables developers to build, test, and deploy software applications.
Treating an Internal Developer Platform (IDP) as a product is an emerging paradigm within platform engineering communities. Similar to the observability desired for a request being processed by your digital services, it’s necessary to comprehend the metrics, traces, logs, and events associated with a code change from development through to production. The end-to-end observability of the engineering process becomes essential when building software under product safety legislation, such as medical devices. It’s nearly as crucial as the final product itself when high-frequency releases are critical to the business.
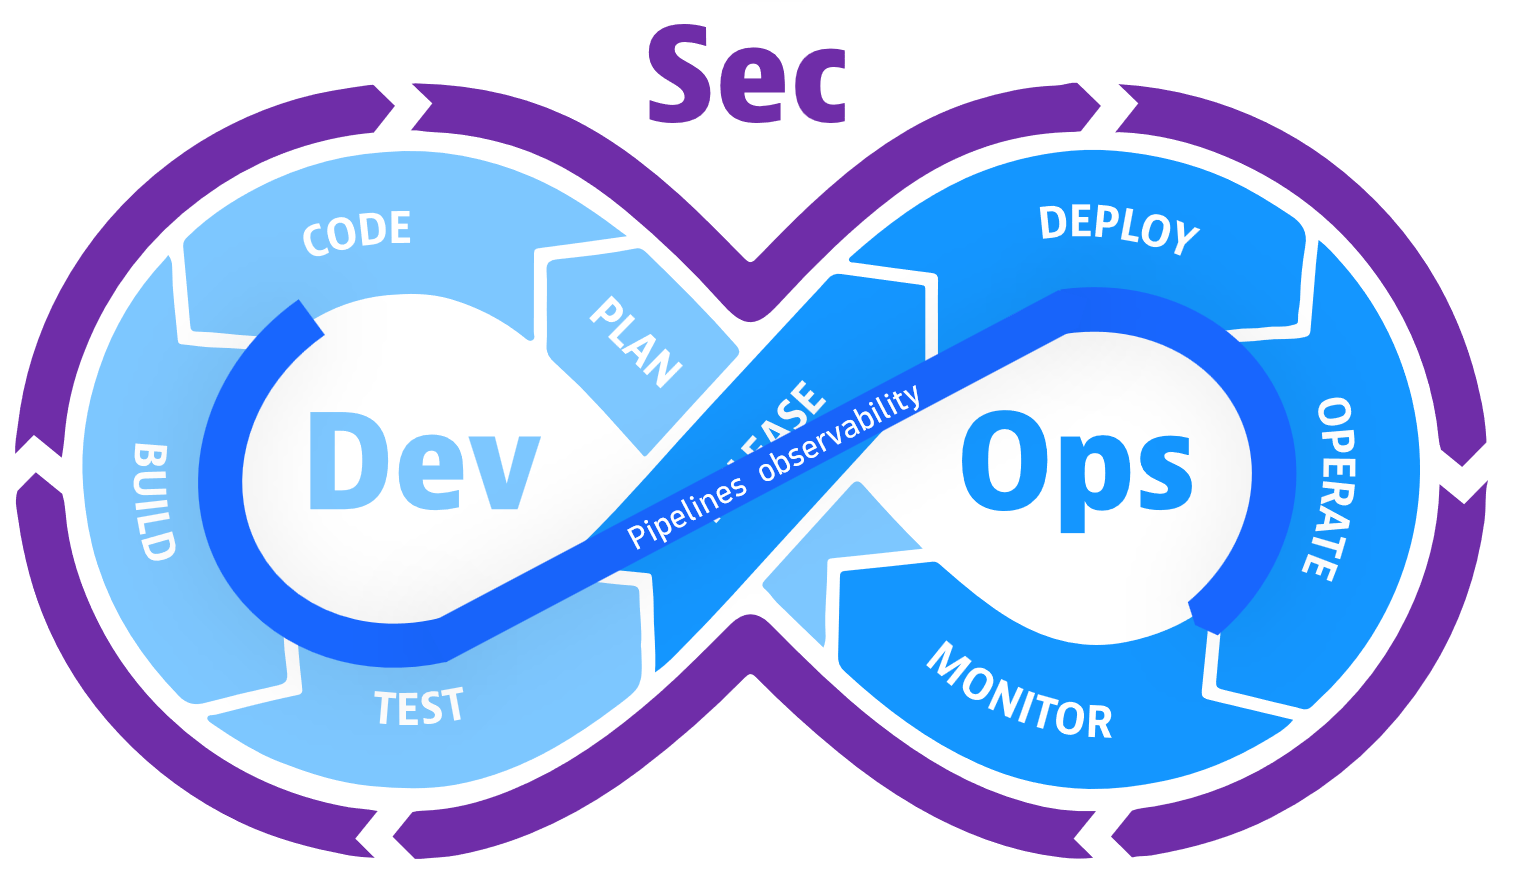
This blog post focuses on pipeline observability as a method for monitoring the software delivery capabilities of an organization’s IDP. This process begins when the developer merges a code change and ends when it is running in a production environment. In other words, pipeline observability encompasses Continuous Integration (CI) and includes Continuous Delivery (CD), as depicted in the following image.

Unlocked use cases
Gaining insights into your pipelines and applying the power of Dynatrace analytics and automation unlocks numerous use cases:
- Make data-driven improvements: Invest in those software delivery capabilities that provide the most significant payoff. To make the right decision, pipeline KPIs can reveal areas for improvement, protect your long-term investment in development, and present stakeholders with the benefits of sustained funding.
- Automate delivery processes: Ideally, an improvement entails introducing automation to eliminate manual tasks, foster collaboration, or speed up processes.
- Ensure pipeline compliance/governance: By obtaining an end-to-end view of the pipeline activities that a code change progresses through, you can identify blind spots that require monitoring and ensure compliance across the entire organization.
Software Development Lifecycle (SDLC) events
The Software Development Lifecycle (SDLC) is similar to the DevSecOps loop as it outlines the various phases a product idea undergoes before it is released into production. These phases must be aligned with security best practices, as discussed in A Beginner`s Guide to DevOps. While the lifecycle starts with a ticket specifying a new product idea, an actual code change often triggers various automated tasks kicking off the next phase. These automation tasks process the code change to build a deployable and create new artifacts accompanying the change throughout the delivery process.
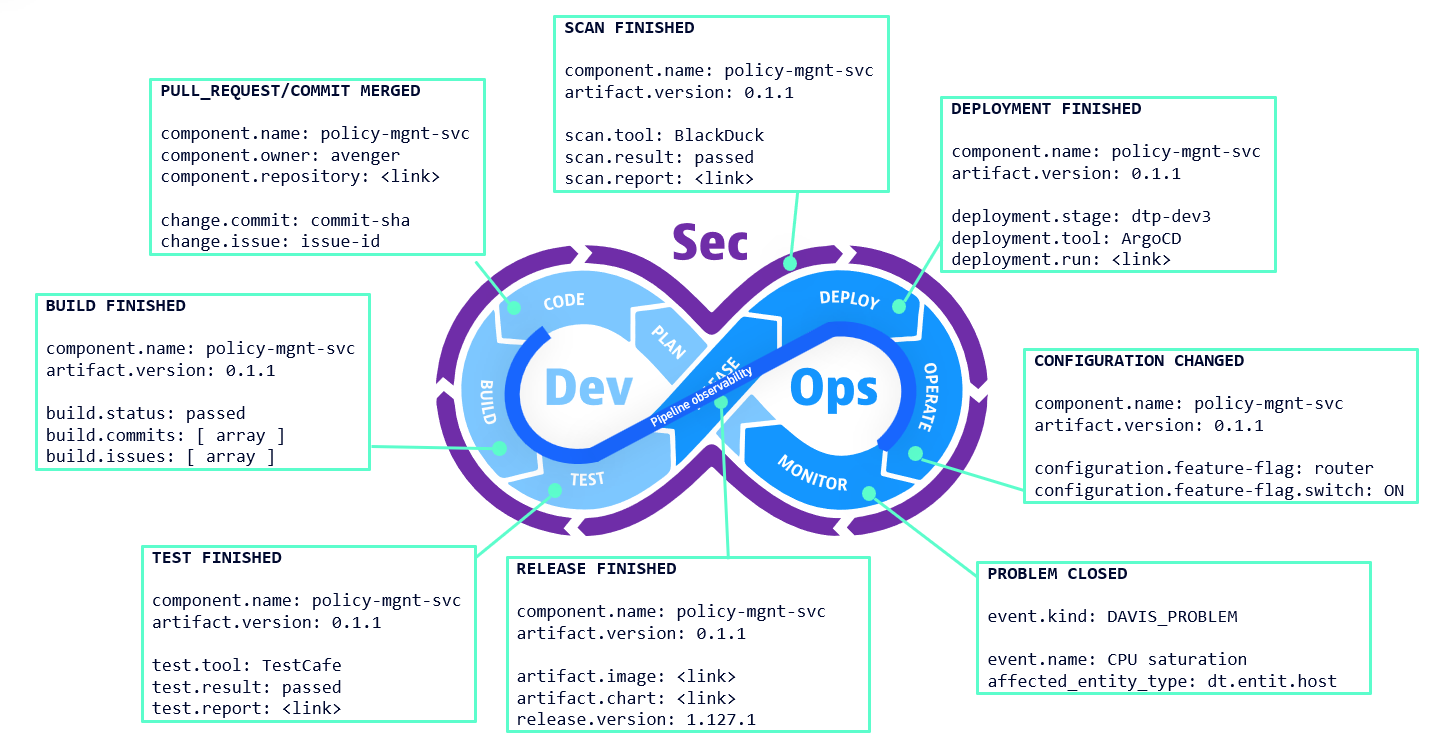
In Dynatrace, examples of such tasks and resulting artifacts include the following, visualized in the below diagram:
- Plan: A ticket for enhancing a platform service is created in Jira.
- Code: The branch for the new feature in a GitHub repository is merged into the main branch.
- Build: GitHub builds the code changes and creates a deployable image.
- Test: Playwright executes end-to-end tests.
- Release:
- The image is published on Harbor, and the Helm Chart is updated.
- BlackDuck performs a security and vulnerability check, returning a scan result.
- Deploy:
- ArgoCD deploys the Helm Chart in a development environment.
- Synthetic HTTP monitors are executed in the hardening stage.
- An automation updates a GitOps repository to roll out the artifact to production
- Operate: FlagD switches a feature flag from OFF to ON.

Given these examples, which are a subset of many others, crucial information about a software change and the related component is generated before monitoring begins. Consequently, Dynatrace defines the semantics of essential data points and stores them in a normalized manner. For instance, the Git commit, ticket ID, artifact version, release version, deployment stage, etc., are data points that require special attention. When the semantics of this metadata are well-defined, you can build insightful analytics and robust automation.
The specification defines the new event type SDLC_EVENT, which covers the event category for pipeline and task events. A pipeline can be the parent of multiple tasks to group the resulting events logically. A task event, however, represents the state of a single lifecycle activity like a build, test, deployment, scan, etc. Dynatrace Documentation maintains a list of events, which will grow as we unlock new use cases.
Defining an event standard succeeds through adoption within the ecosystem. This is why we’re aligned with open source initiatives and compatible with the CI/CD specification in OpenTelemetry driven by the CD Foundation. Consequently, your efforts into OpenTelemetry for pipeline observability will be natively supported by Dynatrace.
Generic SDLC event ingest endpoint
Dynatrace introduced a generic SDLC event ingest endpoint that enables data ingestion directly from any third-party CI/CD tool. While this endpoint accepts any JSON payload and adds default properties of the SDLC specification, OpenPipeline™ is leveraged to process vendor-specific data and extract those properties defined by the specification. GitHub and ArgoCD are the first two tools to receive an OpenPipeline configuration.
The endpoint, together with OpenPipeline, opens a range of use cases, such as:
- Pipeline anomaly visualization on custom dashboards tailored within Dynatrace.
- In-depth analysis of delivery tasks using tools like Notebooks.
- Automated release validation using Dynatrace Site Reliability Guardian.
- Contextualization of third-party CI/CD activities with Dynatrace monitored entities.
Stay tuned
Currently, the API allows for the configuration of an event processing pipeline. Support for managing configuration in the OpenPipline app is a high priority. This will be accompanied by the above-mentioned GitHub and ArgoCD configurations and others to follow.
In some cases, a CI/CD tool’s log line contains important data points that, on their own, eliminate the need to additionally send an event to Dynatrace. Therefore, we’re working on a log processor to automatically extract relevant metadata and generate SDLC events from log lines.
Lastly, we’re working on a ready-made dashboard for the DORA metrics based on GitHub and ArgoCD metadata.
What’s next
- Explore: See the analytics sample in our documentation, which is executable in the playground environment.
- Adopt: Identify your most critical pipelines and make them visible. In other words, leverage the available event ingest endpoint and send pipeline activities to Dynatrace. In many cases, this is possible by leveraging webhook capabilities.
- Fine-tune: Perform data normalization by creating an OpenPipeline configuration that extracts properties according to the SDLC specification.


Looking for answers?
Start a new discussion or ask for help in our Q&A forum.
Go to forum