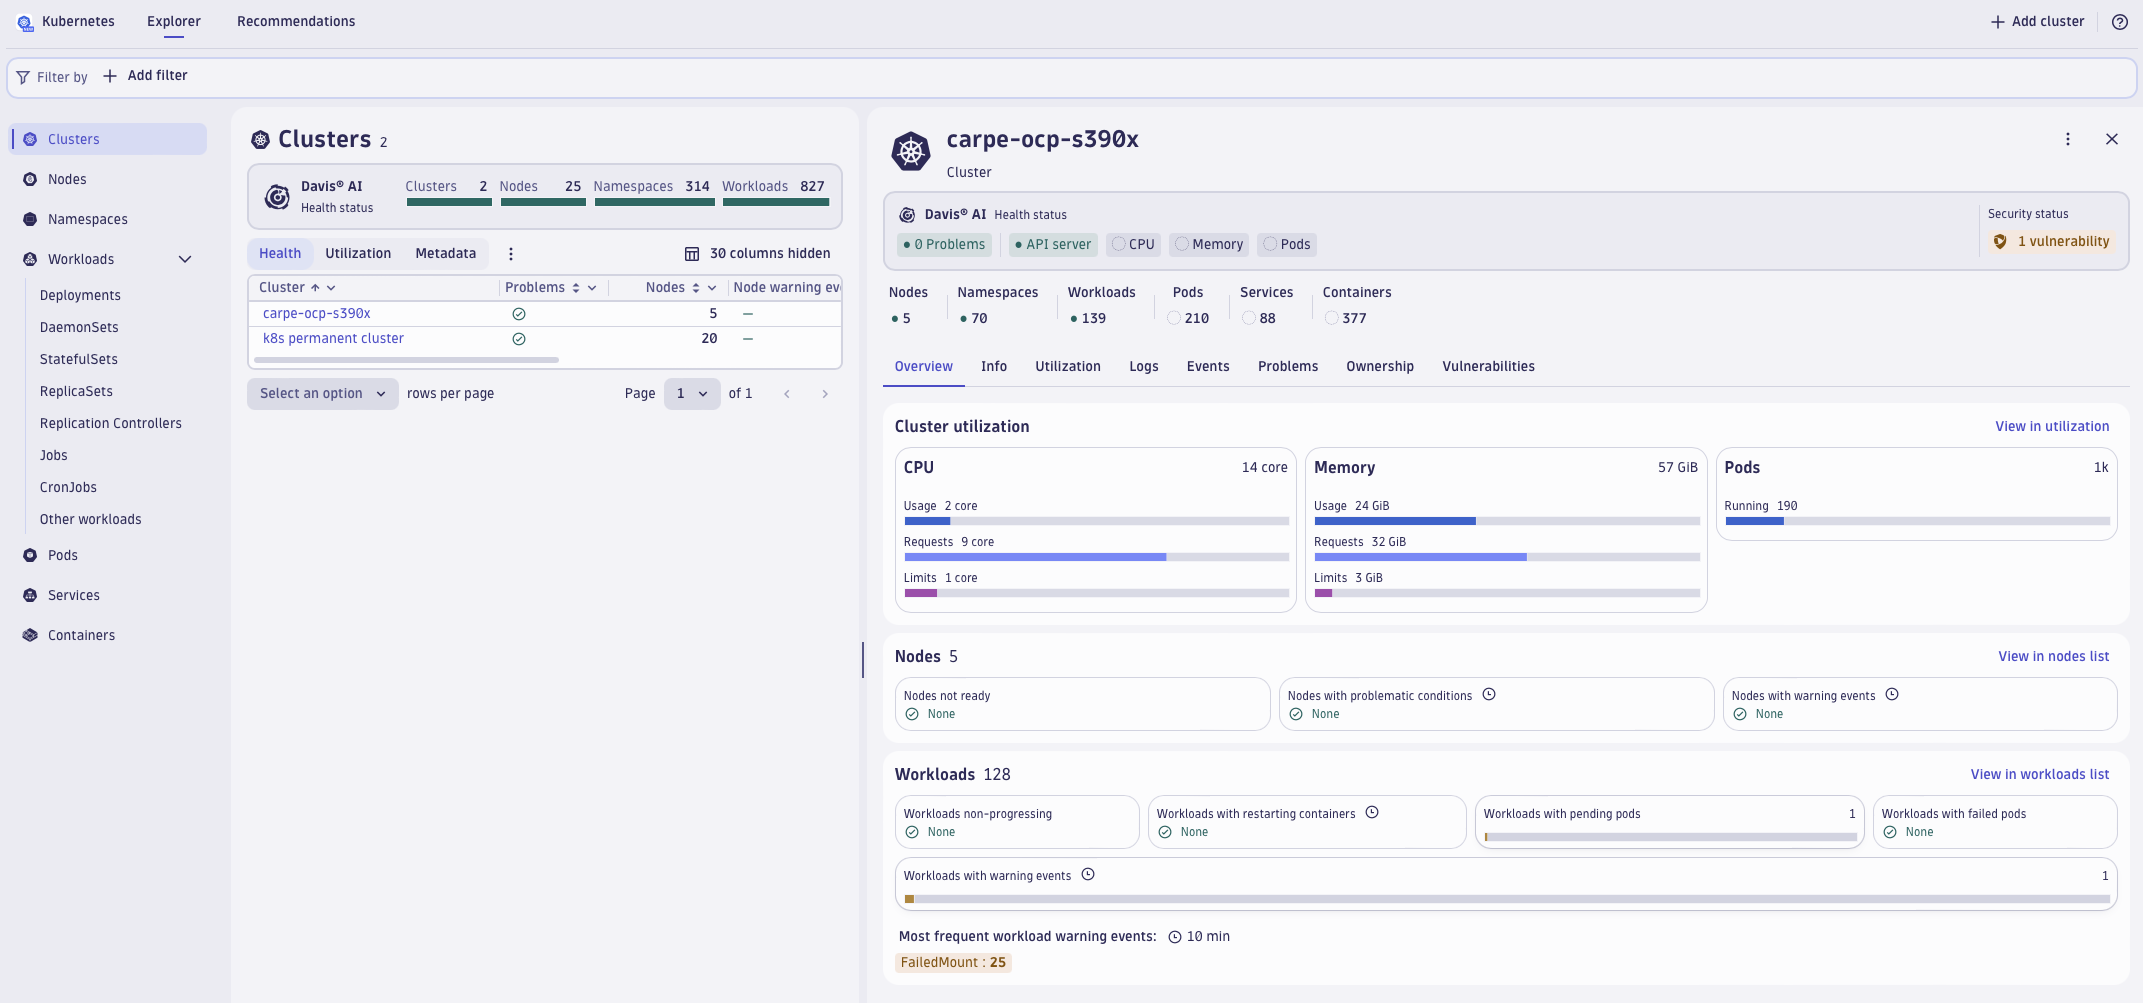
Observability is fundamental when working with hybrid workloads. It serves as the foundation for informed decision-making and efficient operations. Observability provides valuable insights into system performance, resource utilization, and application health. However, achieving the end-to-end observability required to ensure the smooth operation of your systems and applications and, thus, business continuity, is challenging.
As we did with IBM Power, we’re delighted to share that IBM and Dynatrace have joined forces to bring the Dynatrace Operator, along with the comprehensive capabilities of the Dynatrace platform, to Red Hat OpenShift on the IBM Z and LinuxONE architecture (s390x). IBM Z and LinuxONE mainframes running the Linux operating system enable you to respond faster to business demands, protect data from core to cloud, and streamline insights and automation. By leveraging Dynatrace observability on Red Hat OpenShift running on Linux, you can accelerate modernization to hybrid cloud and increase operational efficiencies with greater visibility across the full stack from hardware through application processes.
Dynatrace full stack observability for Red Hat OpenShift
Dynatrace enhances software quality and operational efficiency, which drives innovation by unifying application, operation, and platform engineering teams on a single platform. Dynatrace with Red Hat OpenShift monitoring stands out for the following reasons:
- With infrastructure health monitoring and optimization, you can assess the status of your infrastructure at a glance to understand resource consumption and thus optimize resource allocation for cost efficiency.
- Full stack observability gives you comprehensive observability across your entire stack, including Kubernetes clusters, logs, and more. Telemetry data, such as traces and metrics, allow you to analyze the end-to-end performance of your deployed applications. You also benefit from enhanced monitoring capabilities with seamless Dynatrace integrations with cloud-native technologies and services like Istio and Prometheus.
- Dynatrace Smartscape® technology provides all data in context to simplify analytics and problem detection by semantically mapping metrics, traces, logs, and real user data to specific Kubernetes objects, including containers, pods, nodes, and services.
- You can automatically detect and analyze performance issues across your entire tech stack with Davis® AI. This lets you quickly troubleshoot issues by identifying problematic components or configurations and providing insights into the root cause.
- Dynatrace is designed to scale easily across the entire Kubernetes stack. Its support of GitOps practices allows for handling large-scale deployments with thousands of nodes and containers, making it the best option for enterprise-grade Red Hat OpenShift monitoring.
The new Dynatrace Kubernetes experience also marks a groundbreaking advancement for platform engineering teams by enabling you to pull critical observability and security information into a centralized Kubernetes management console. In particular, it allows you to explore cluster health, resource utilization, security, and the performance of applications built and deployed on a Kubernetes-centric platform. This is significant when coupled with the OpenShift platform.

Dynatrace Operator for OneAgent, API monitoring, routing, and more
Dynatrace Operator leverages Kubernetes’ native capabilities to automate the rollout, configuration, and lifecycle management of Dynatrace components within Kubernetes environments. It simplifies setting up and maintaining Dynatrace observability by encapsulating the necessary configuration and operational logic into a single entity.
Dynatrace Operator acts as an intelligent controller that understands the desired state of your Dynatrace monitoring environment and takes actions to achieve it. It automates tasks such as provisioning and scaling Dynatrace monitoring components, updating configurations, and ensuring the health and availability of your monitoring infrastructure.
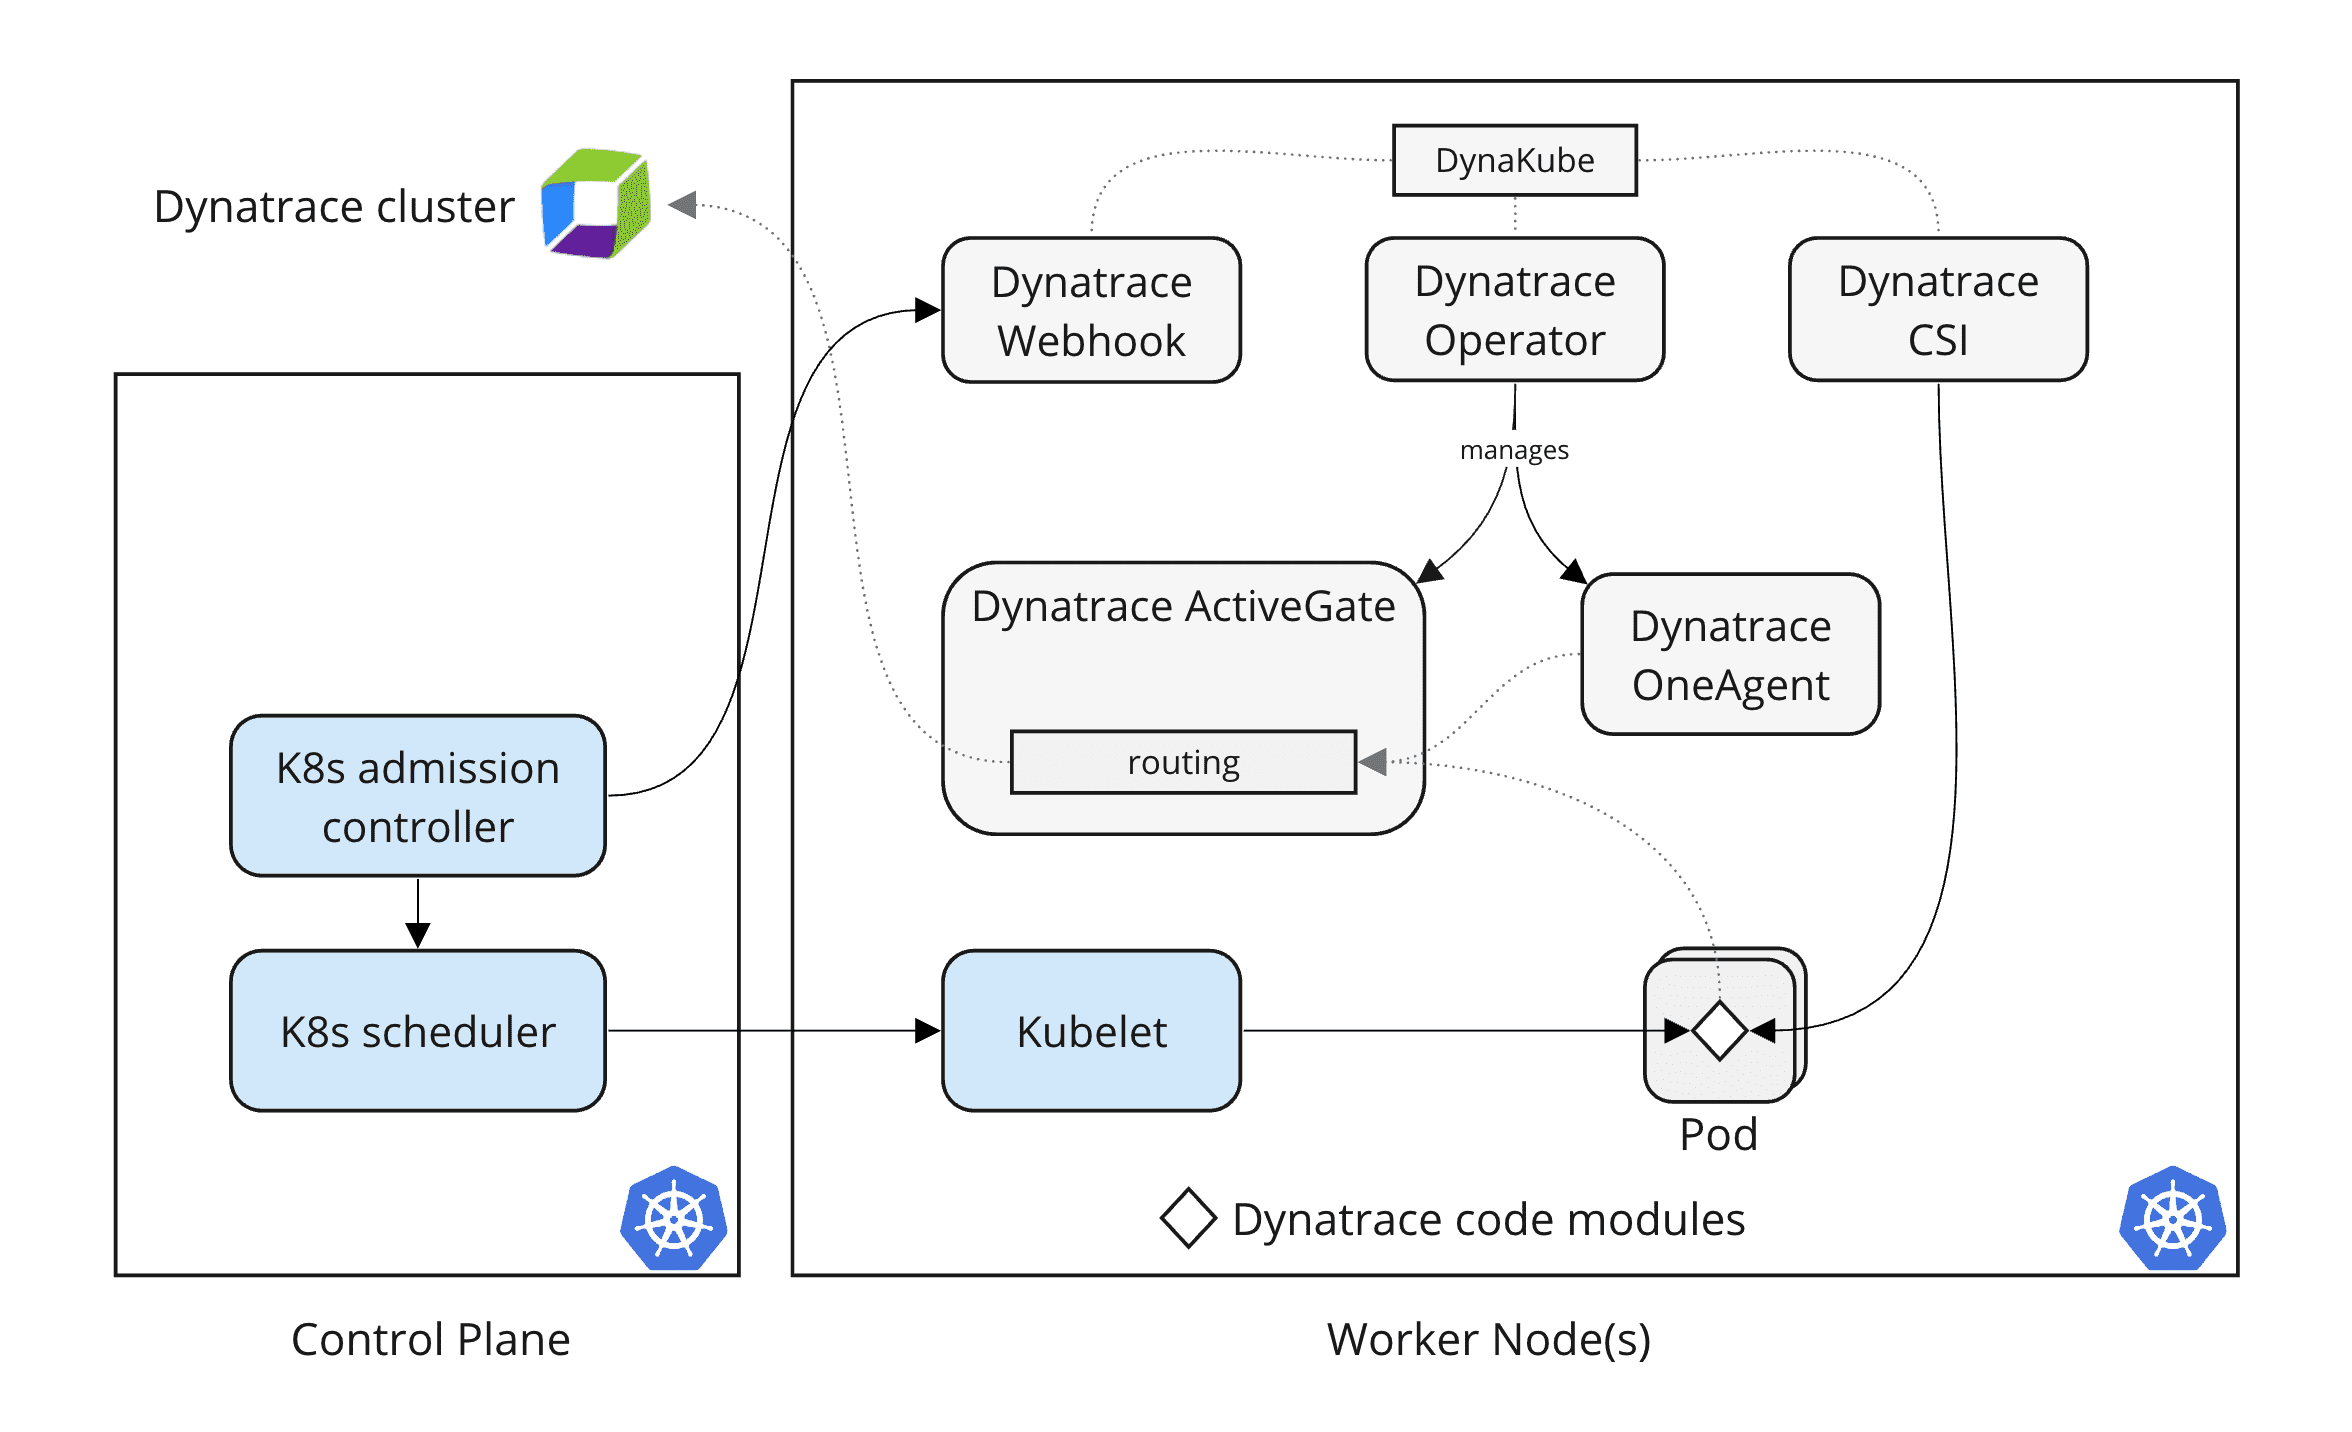
Dynatrace Operator consumes DynaKubes with cloud-native full-stack configuration and deploys the following resources:
- Dynatrace OneAgent, deployed as a DaemonSet, collects host metrics from Kubernetes nodes.
- Dynatrace code modules, enabled via Dynatrace webhook, provide distributed tracing and code-level visibility for applications deployed on Kubernetes.
- Dynatrace ActiveGate is used for routing and monitoring Kubernetes objects by collecting data (metrics, events, status) from the Kubernetes API.

With this approach:
- Red Hat OpenShift infrastructure (control plane and worker nodes) and workloads are instrumented automatically without manual code change.
- The scope of automatic workload instrumentation is user-configurable, for example, by namespace.
- Lifecycle management of Dynatrace components (for example, ActiveGate and OneAgent) is automatic and secure.
Get started monitoring Red Hat OpenShift on IBM Z and LinuxONE
- New to Dynatrace? Sign up for a fully functional Dynatrace free trial.
- Learn more about the new Kubernetes Experience for Platform Engineering.
- Dynatrace observability is available for Red Hat OpenShift on IBM Power.


Looking for answers?
Start a new discussion or ask for help in our Q&A forum.
Go to forum