Batch jobs are the backbone of automated, scheduled processes that execute tasks in bulk, such as data processing, system maintenance, or report generation. These jobs, which typically run in the background without user interaction, are critical and indispensable for handling large-scale operations efficiently.
As batch jobs run without user interactions, failure or delays in processing them can result in disruptions to critical operations, missed deadlines, and an accumulation of unprocessed tasks, significantly impacting overall system efficiency and business outcomes. The urgency of monitoring these batch jobs can’t be overstated.
Monitor batch jobs
Monitoring is critical for batch jobs because it ensures that essential tasks, such as data processing and system maintenance, are completed on time and without errors. Failures, delays, or resource issues can lead to operational disruptions, financial losses, or compliance risks. Continuous monitoring enables early detection of problems, allowing quick remediation and maintaining business continuity.
Most jobs provide detailed information about job execution, including status, errors, and processing times in logs. The first step in monitoring batch jobs is to ingest these logs into Dynatrace. This is achieved by identifying the log files generated by the batch job program.
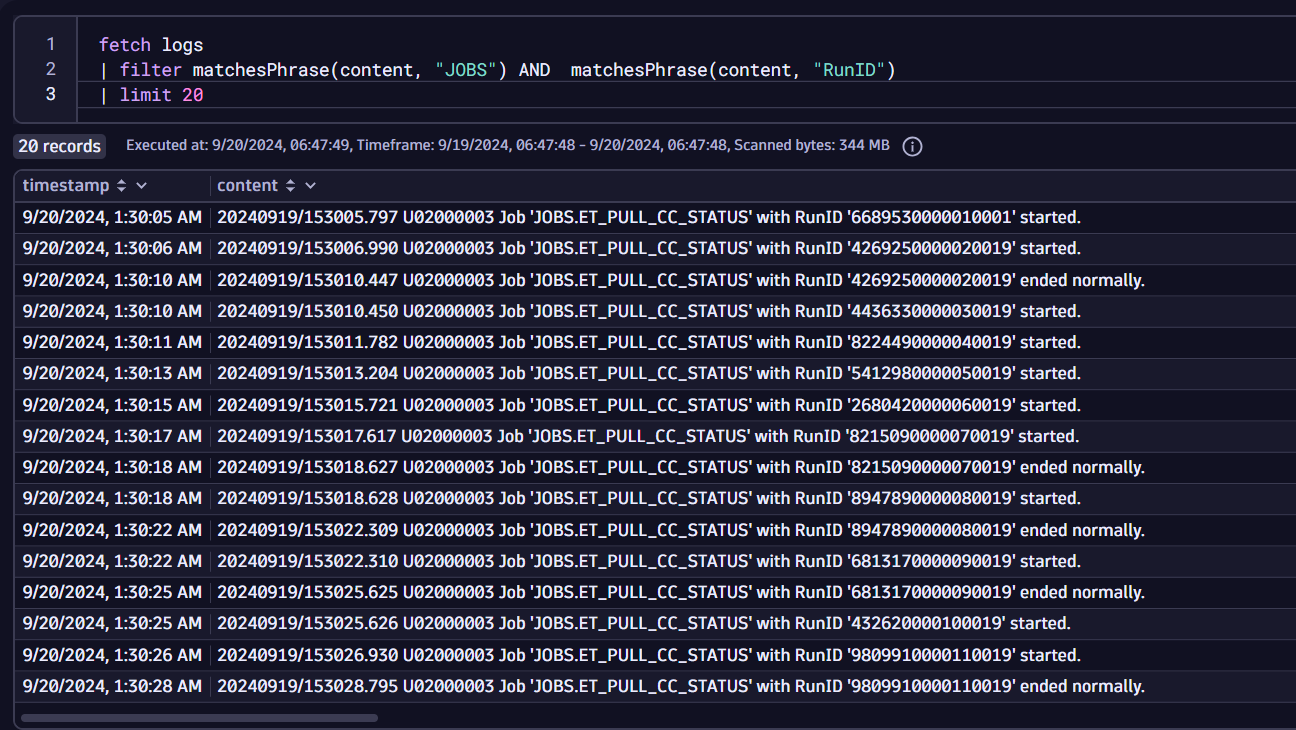
In this case, batch job statuses are constantly written from the deployment name get-cc-status-*. Thus we can create a rule in Dynatrace to ingest these logs via OneAgent without making any changes to the container, cluster, or host. Logs can also be ingested from various sources, including OpenTelemetry and Fluentbit.
A great reference is our blog post, Leverage edge IoT data with OpenTelemetry and Dynatrace, in which we documented the required steps to parse and ingest a single JSON log file into Dynatrace via OpenTelemetry.
Once logs are ingested, parsing the key messages is crucial. Below is a sample query that demonstrates how batch jobs can be parsed to extract important fields:
fetch logs
| filter matchesPhrase(content, "JOBS") AND matchesPhrase(content, "RunID")
| filter matchesValue(dt.entity.host, "HOST-HOSTID12345678")
| parse content , "
LD 'JOBS.' WORD:Job
LD 'RunID ' STRING:RunId
LD:status"
| fields timestamp, Job, status, content, RunId
| filterOut status == "."
| fieldsAdd start_time=if(contains(content,"started."),timestamp)
| fieldsAdd end_time=if(contains(content,"ended normally."),timestamp)
| fields timestamp, content, Job, status, RunId,start_time,end_time
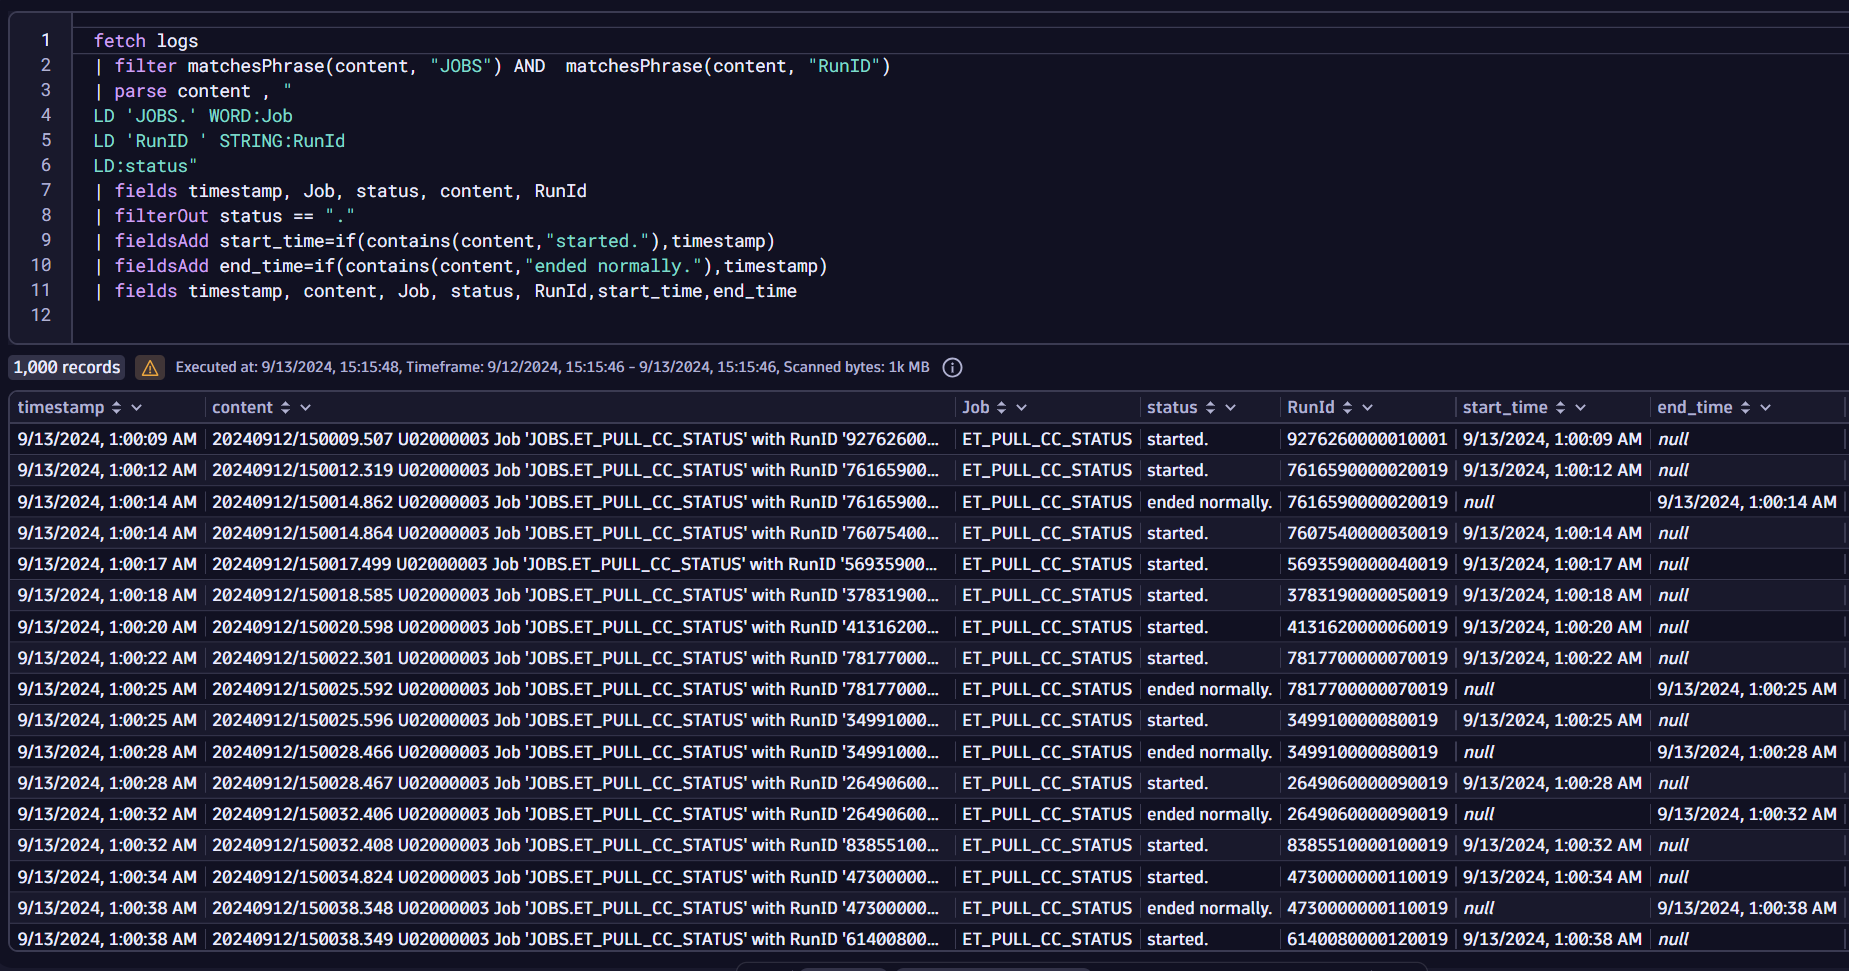
Now that we can parse critical information, we can make informed decisions. However, it’s important to know if a job that started has ended within the expected timeframe. When a batch job exceeds its allotted time, the issue must be quickly identified and remediated.
Capture the time difference between two log entities
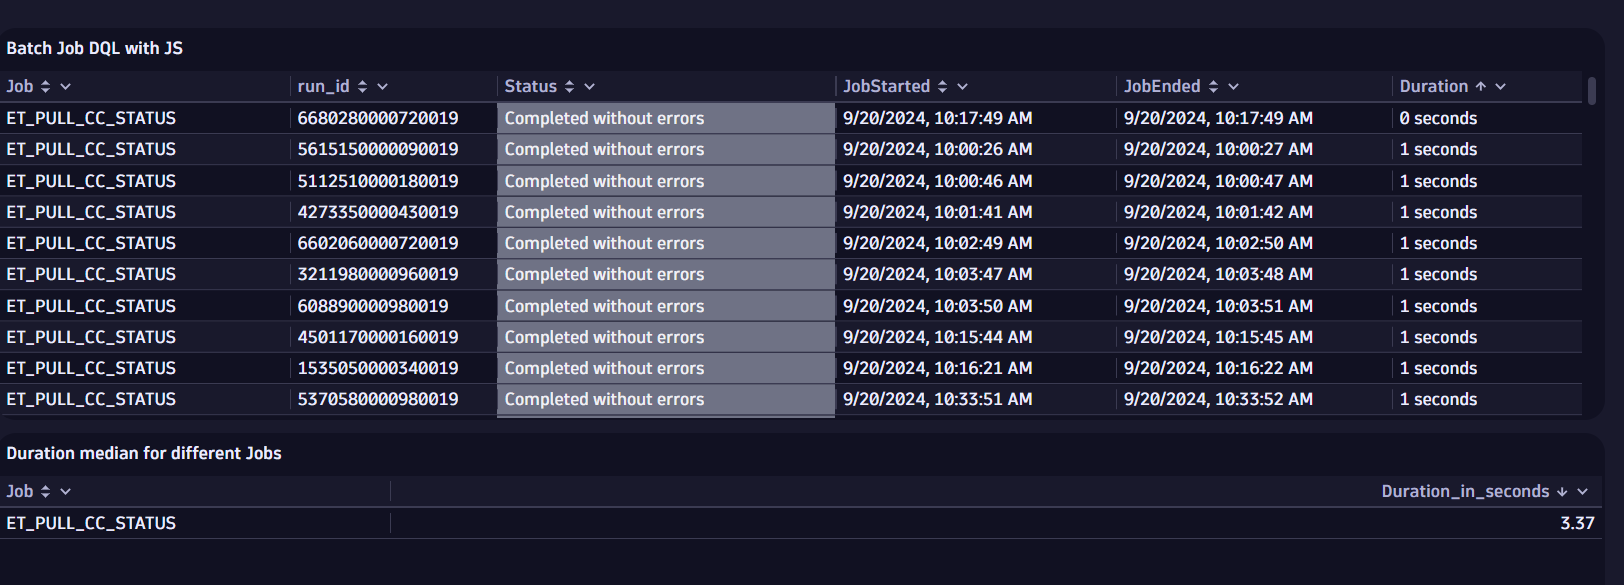
We use JavaScript within Dynatrace Dashboards to determine whether a previously started job was successfully completed. This three-level approach helps track how long a job took to complete and identifies any stuck jobs.
- Identify the unique property of each job and initialize its structure.
const batch = {}; /* Reiterate through each record and populate the data-structure*/ for (const record of recordSet) { const runId = record['RunId']; if (!batch[runId]) { batch[runId] = { Job: record["Job"], run_id: runId, Status: "", JobStarted: null, JobEnded: null, Duration: "NA" }; } } - Process each job’s start time, end time, and status from the DQL parsed output.
if (record["start_time"]) batch[runId].JobStarted = utcToLocal(record["start_time"]); if (record["end_time"]) batch[runId].JobEnded = utcToLocal(record["end_time"]); if (!statusLocked[runId]) { let status = record["status"]?.trim() || ""; if (status.toLowerCase().includes("ended with return code")) { batch[runId].Status = "Failed"; statusLocked[runId] = true; } else if (status == "started.") { batch[runId].Status = "Running"; } else if (status == "ended normally.") { batch[runId].Status = "Completed without errors"; statusLocked[runId] = true; } else { batch[runId].Status = status; } } - Update the job status based on specific conditions (
running, failed, completed)./* Leverage pre-populated data to identify duration for the completed jobs*/ for (const runId in batch) { const job = batch[runId]; if (job.JobStarted && job.JobEnded) { const startTime = new Date(job.JobStarted); const endTime = new Date(job.JobEnded); const duration = endTime - startTime; job.Duration = `${duration / 1000} seconds`; } }
Resources for the dashboard and workflow mentioned above can be found in this GitHub repository.

Correlate the impact of batch jobs with the application
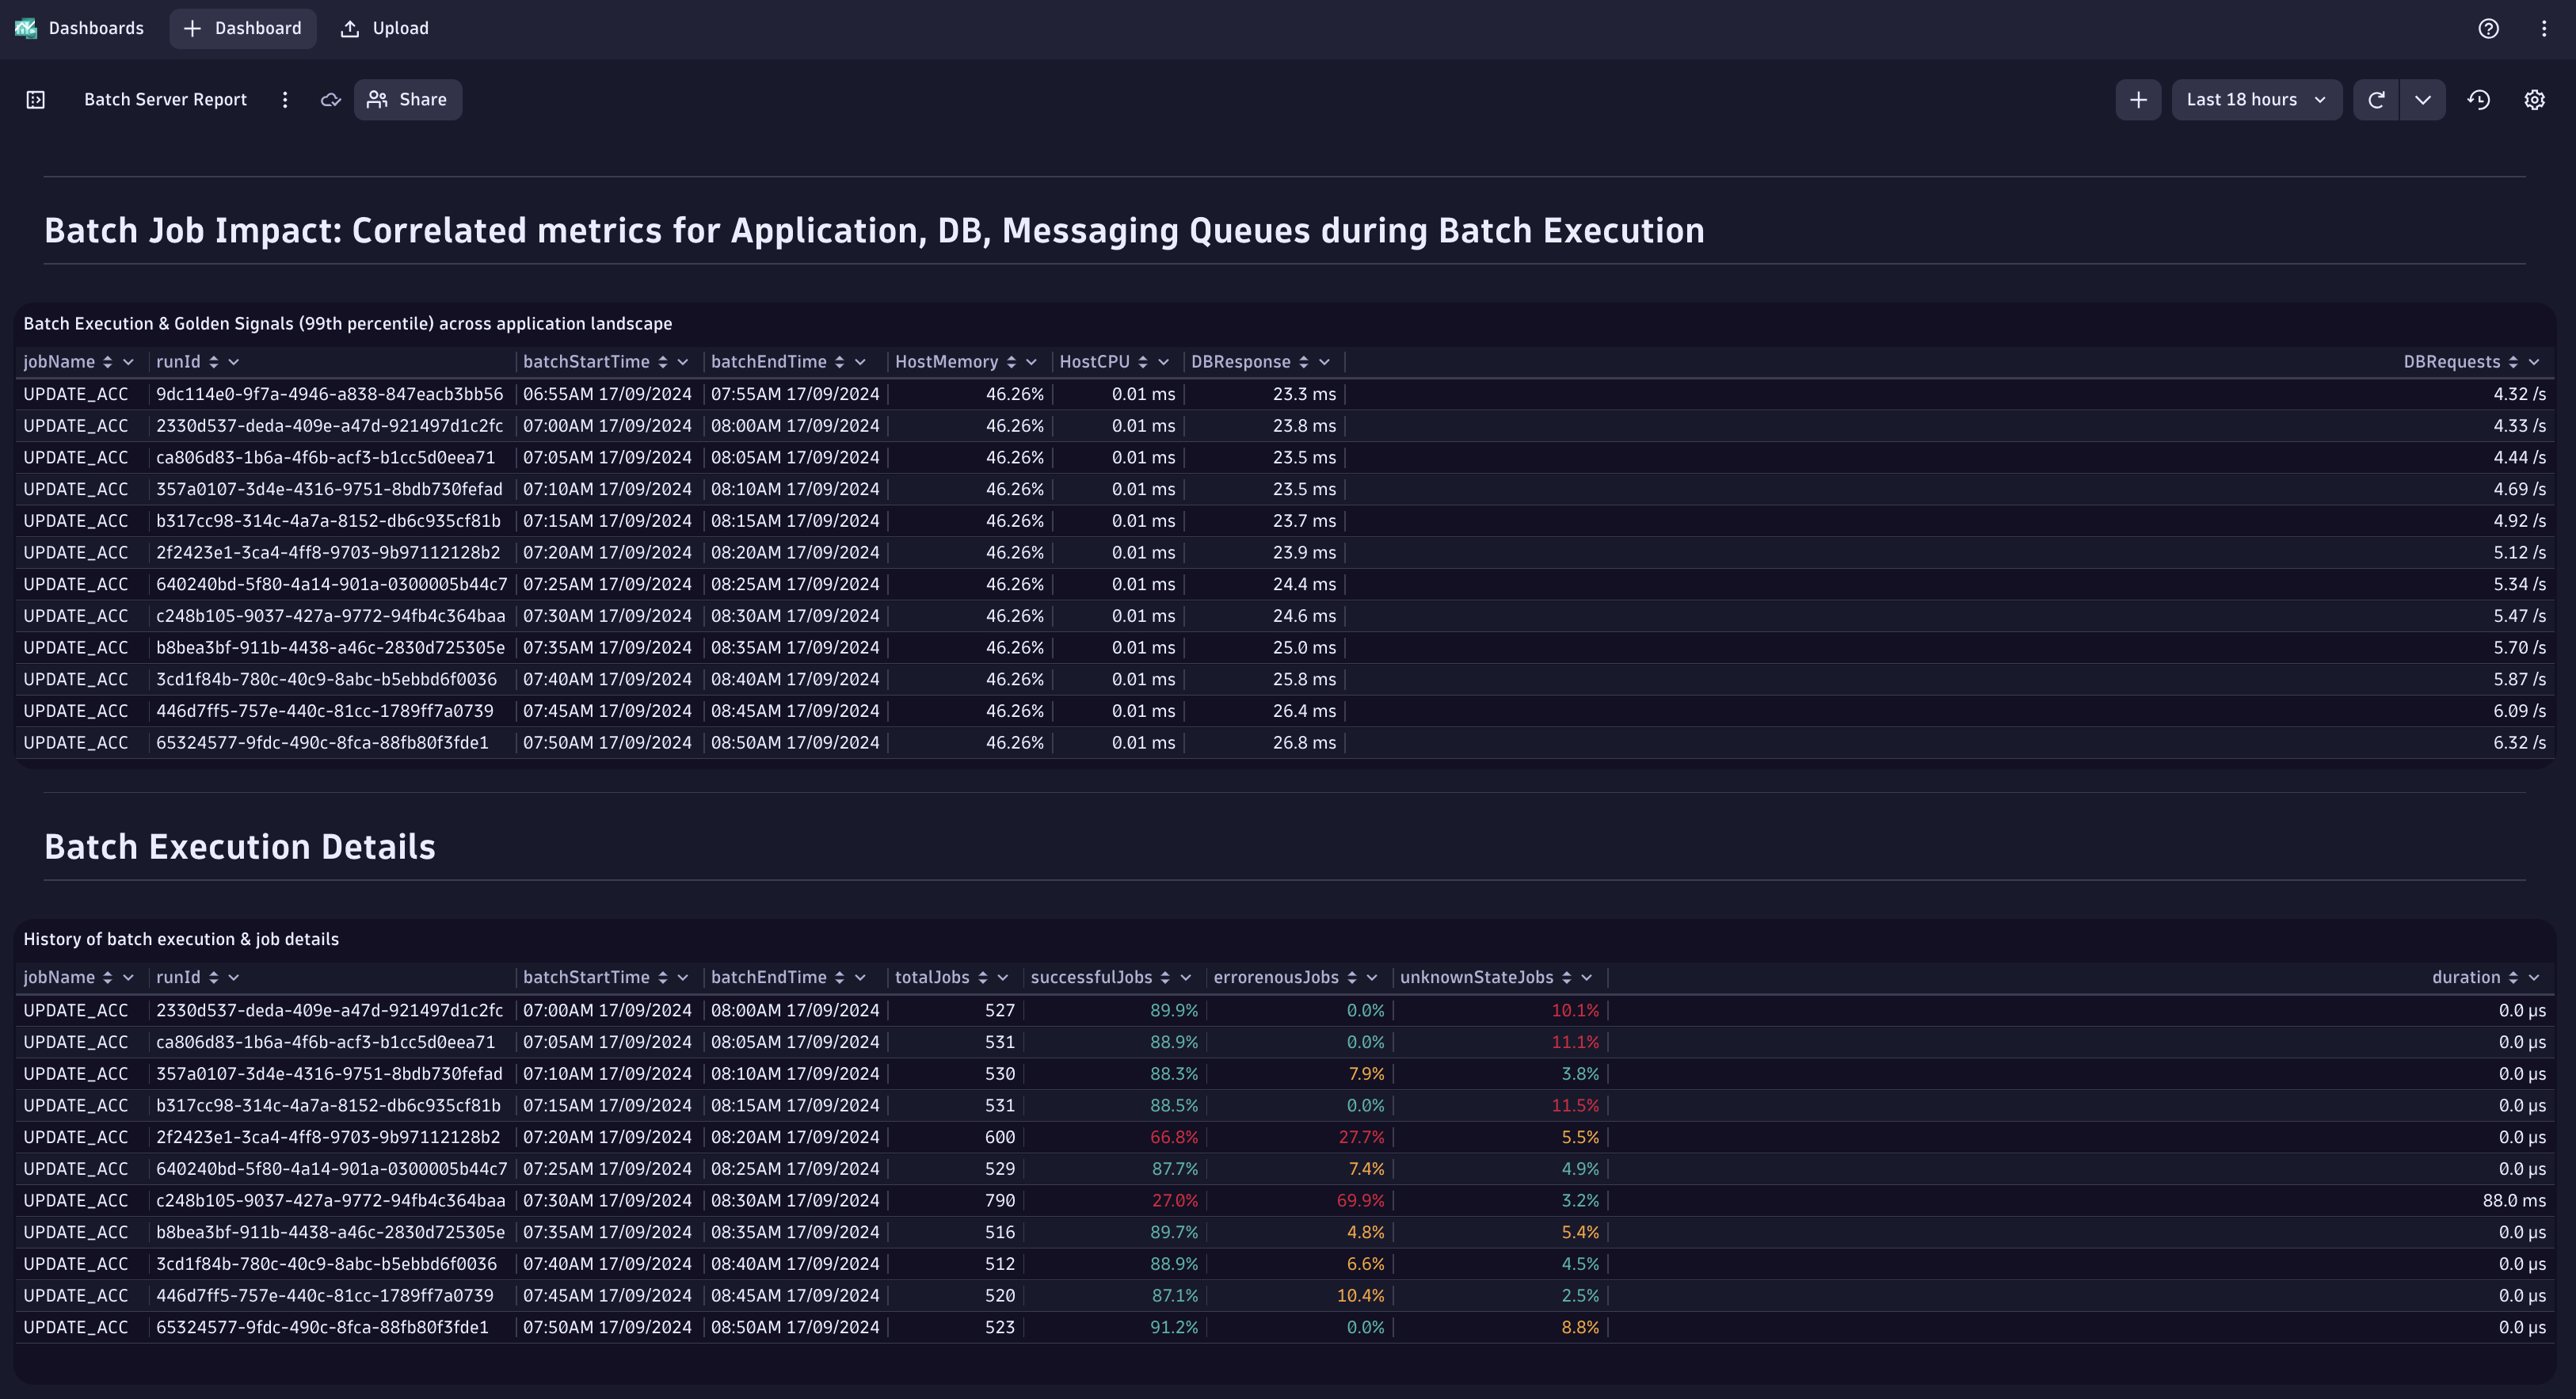
Batch jobs should not impact applications because they run in the background. While they consume resources, they shouldn’t impact resource usage or client-facing applications. We can use Dynatrace Grail™ data lakehouse for unified observability data.
Adjust log parsing to account for varying log patterns
No two batch jobs are the same, and the log patterns you encounter might differ from what you see here. You can achieve the same results by parsing the logs. Parsing logs, as shown above, can be done using DPL Architect.
DPL Architect is a handy tool, accessible through the Notebooks app, that helps you quickly extract fields from records. It helps create patterns, provides instant feedback, and allows you to save and reuse DPL patterns, for faster access to data analytics use cases. This blog post offers further details about DPL architect.
Alerting for long-running or failed batch jobs
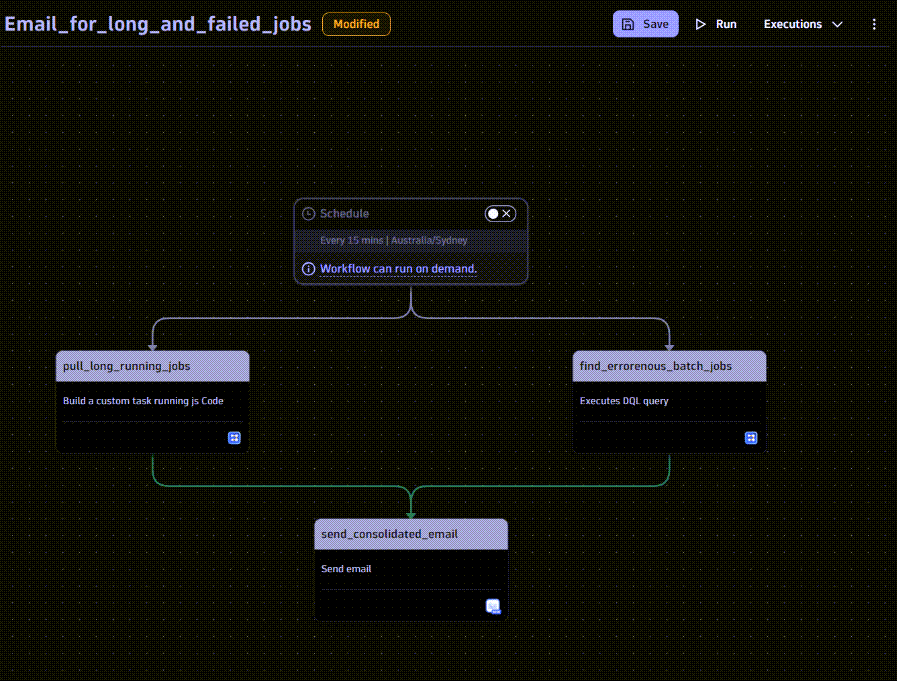
Constantly monitoring a dashboard isn’t practical, so you need automated alerting. Dynatrace workflows can check the status of batch jobs every 15 minutes and send alerts for failures or long-running jobs. These alerts can trigger actions or notifications sent via Slack, Teams, or as a ticket in your IT service management tool. In this example, the notifications are sent via email.
Conclusion
Monitoring batch jobs is essential to ensure they run smoothly and within expected timeframes. We can effectively identify issues such as long-running or failed jobs by ingesting logs into Dynatrace, parsing critical job information, and using custom logic to track job completion times. Implementing automated alerts triggering actions and notifications ensures proactive management, allowing teams to quickly resolve problems and maintain operational efficiency. With these tools in place, organizations can improve the reliability and performance of their batch-processing systems.
Use the approach detailed in this blog post to implement advanced batch job monitoring in your environment. Download the dashboards and Notebooks from this GitHub repository and start your automation journey today.
What’s next
In a future blog post, we’ll show how batch job management can be efficiently orchestrated using workflows and predictive analysis to schedule and run jobs optimally. With Davis® AI identifying root causes, workflows can be used to stop erroneous batch executions.
Additionally, Davis® AI prediction analysis, in conjunction with workflows, can reschedule or pause jobs to ensure optimal resource utilization, preventing any negative impact on the application landscape.
Download the Dashboards and Notebooks used in this blog post from our GitHub repository.


Looking for answers?
Start a new discussion or ask for help in our Q&A forum.
Go to forum