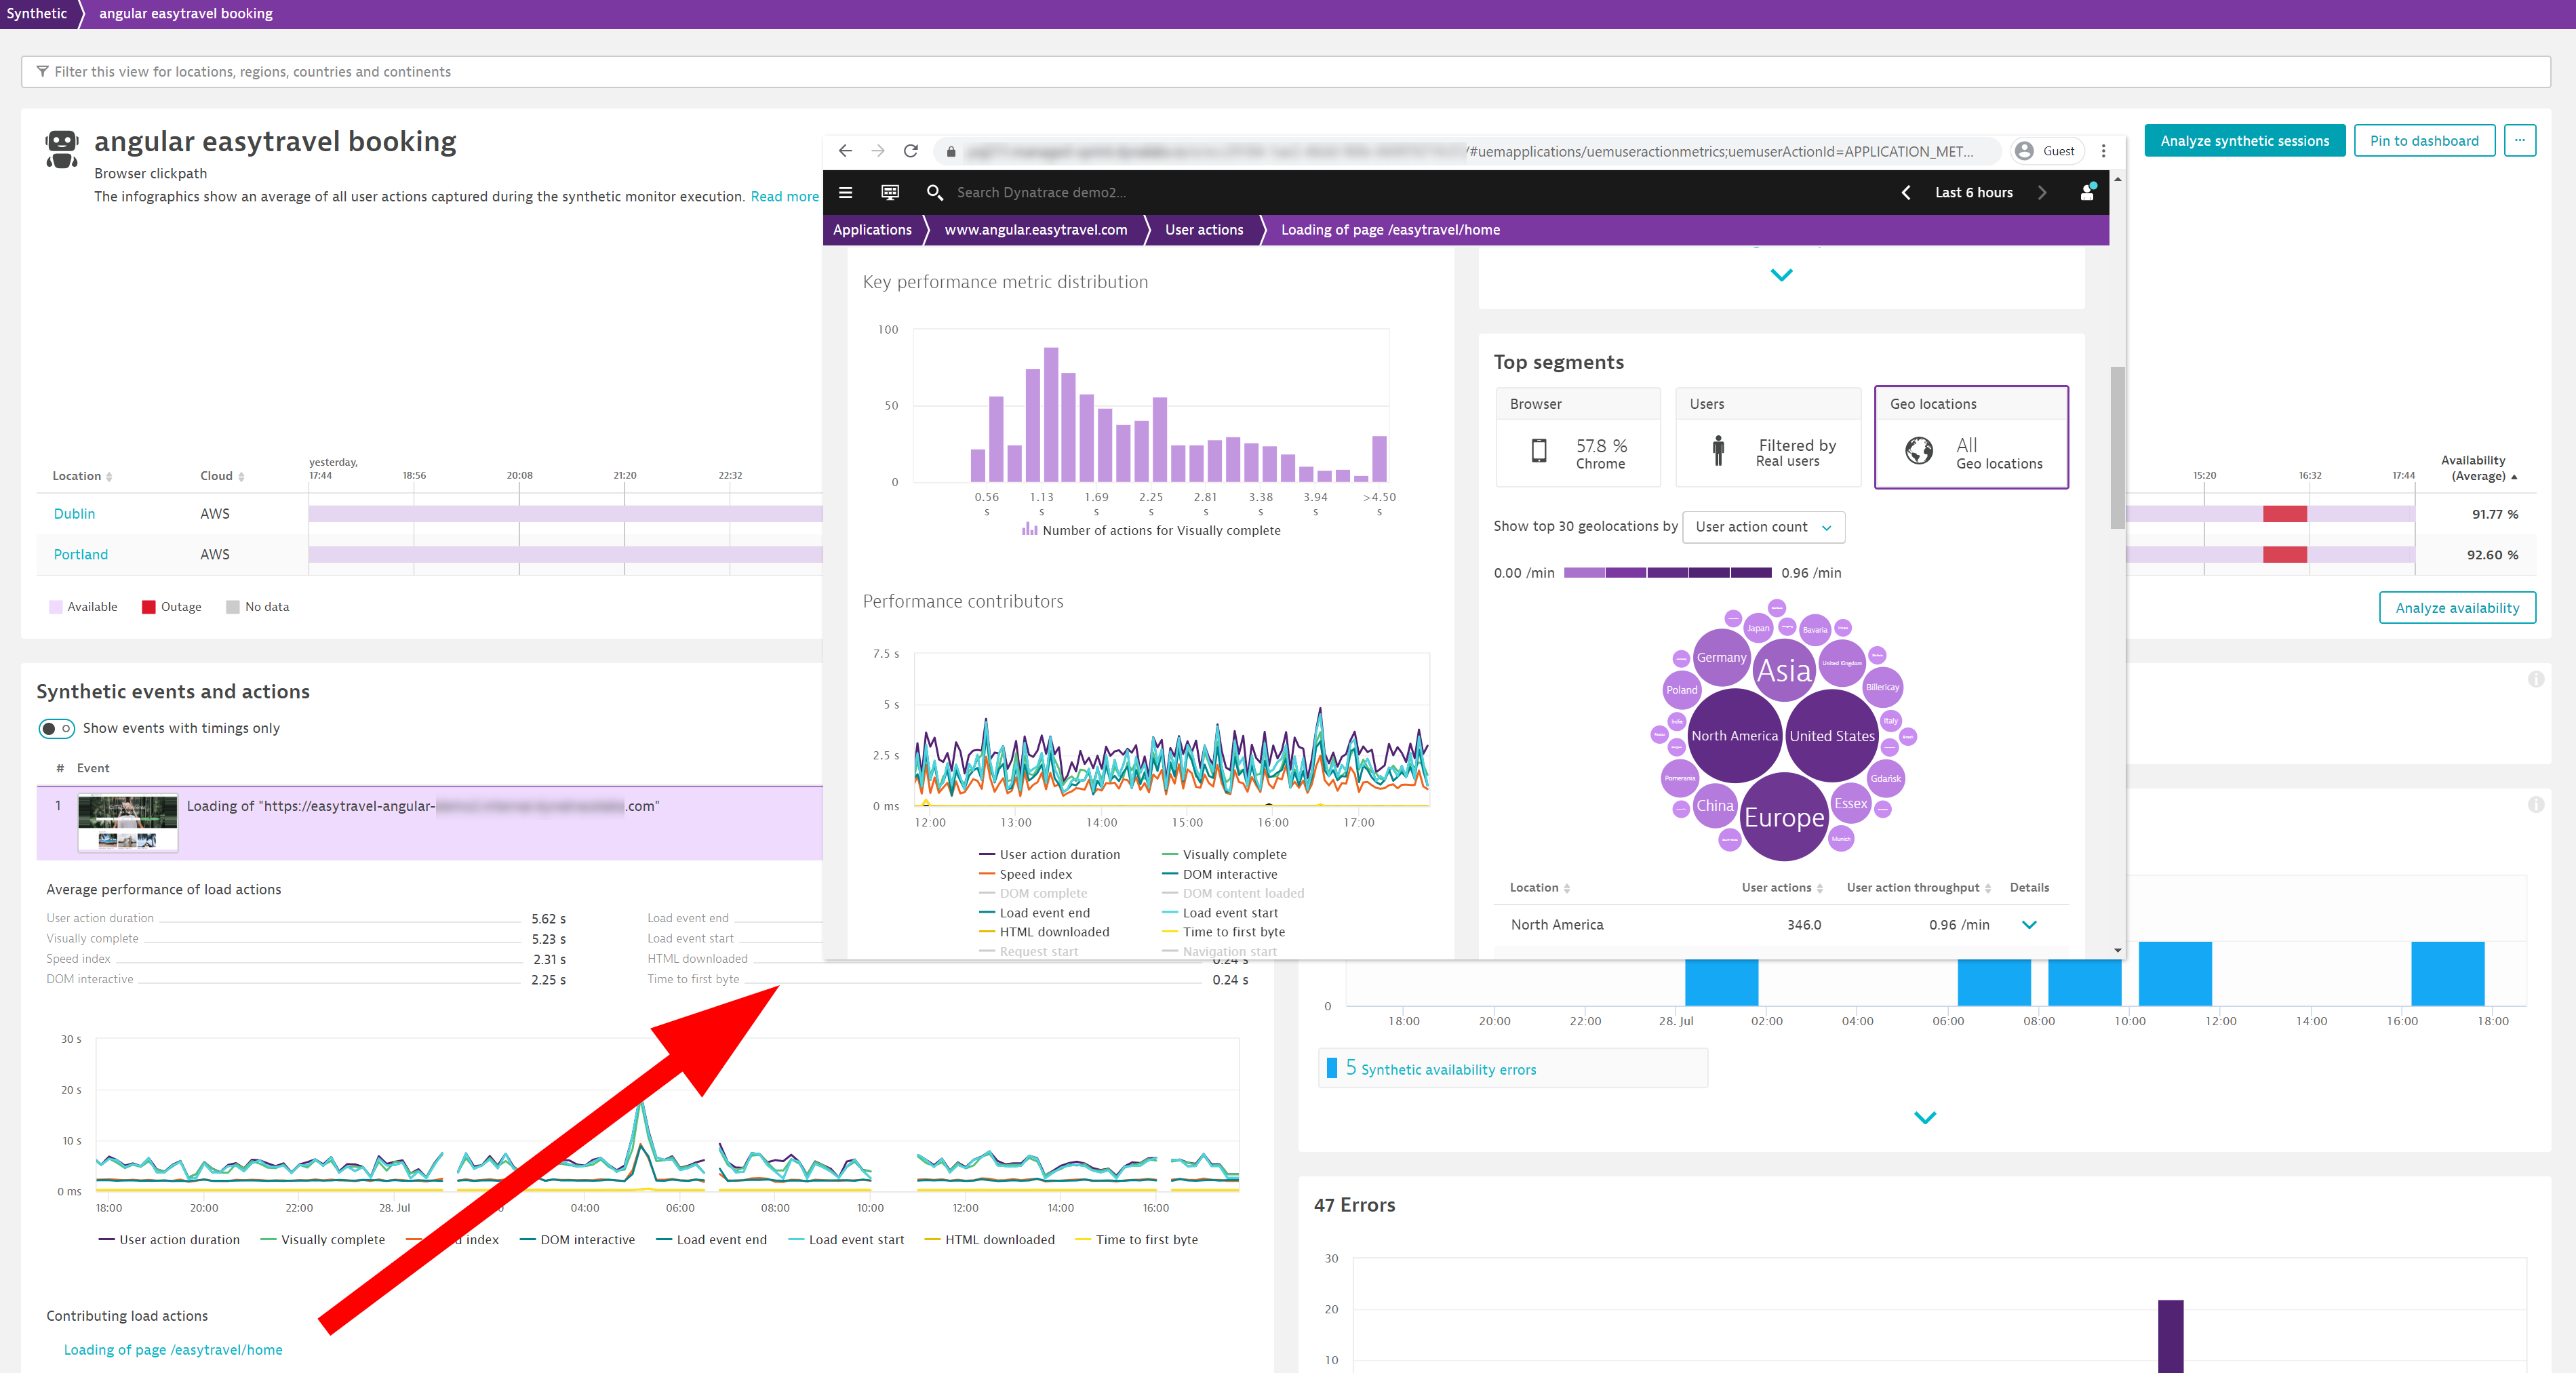
Dynatrace Synthetic Monitoring allows you to proactively monitor the availability of your public as well as your internal web applications and API endpoints from locations around the globe or important internal locations such as branch offices. Synthetic monitors help you find issues before they affect your customers.
Synthetic monitors are also the perfect tool to monitor performance baselines. For a given synthetic monitor, every execution takes place with exactly the same configuration and under the same conditions. This clean-room, lab-like environment allows you to react to slight changes in performance. It also gives you the first indication of whether a new deployment of your application or API leads to a performance improvement or, perhaps, a regression. With Dynatrace, you can also validate your findings against Real User Monitoring data or even drill down to the code level to pinpoint the root cause of a change in performance.
Recently introduced improvements to Visually complete and new web performance metrics for Real User Monitoring are now available for Synthetic Monitoring as well.
Ensure better user experience with paint-focused performance metrics
With Dynatrace version 1.199, we’ve introduced three additional metrics that focus on when a browser renders content. These metrics are tightly connected to the perceived load speed of your application. Monitoring and improving and validating these metrics will ultimately lead to better user experience.
- First paint: The time spent from navigation to when the browser renders the first non-default background element
- First contentful paint: The time spent from navigation to when the browser renders the first bit of content (for example, text, images)
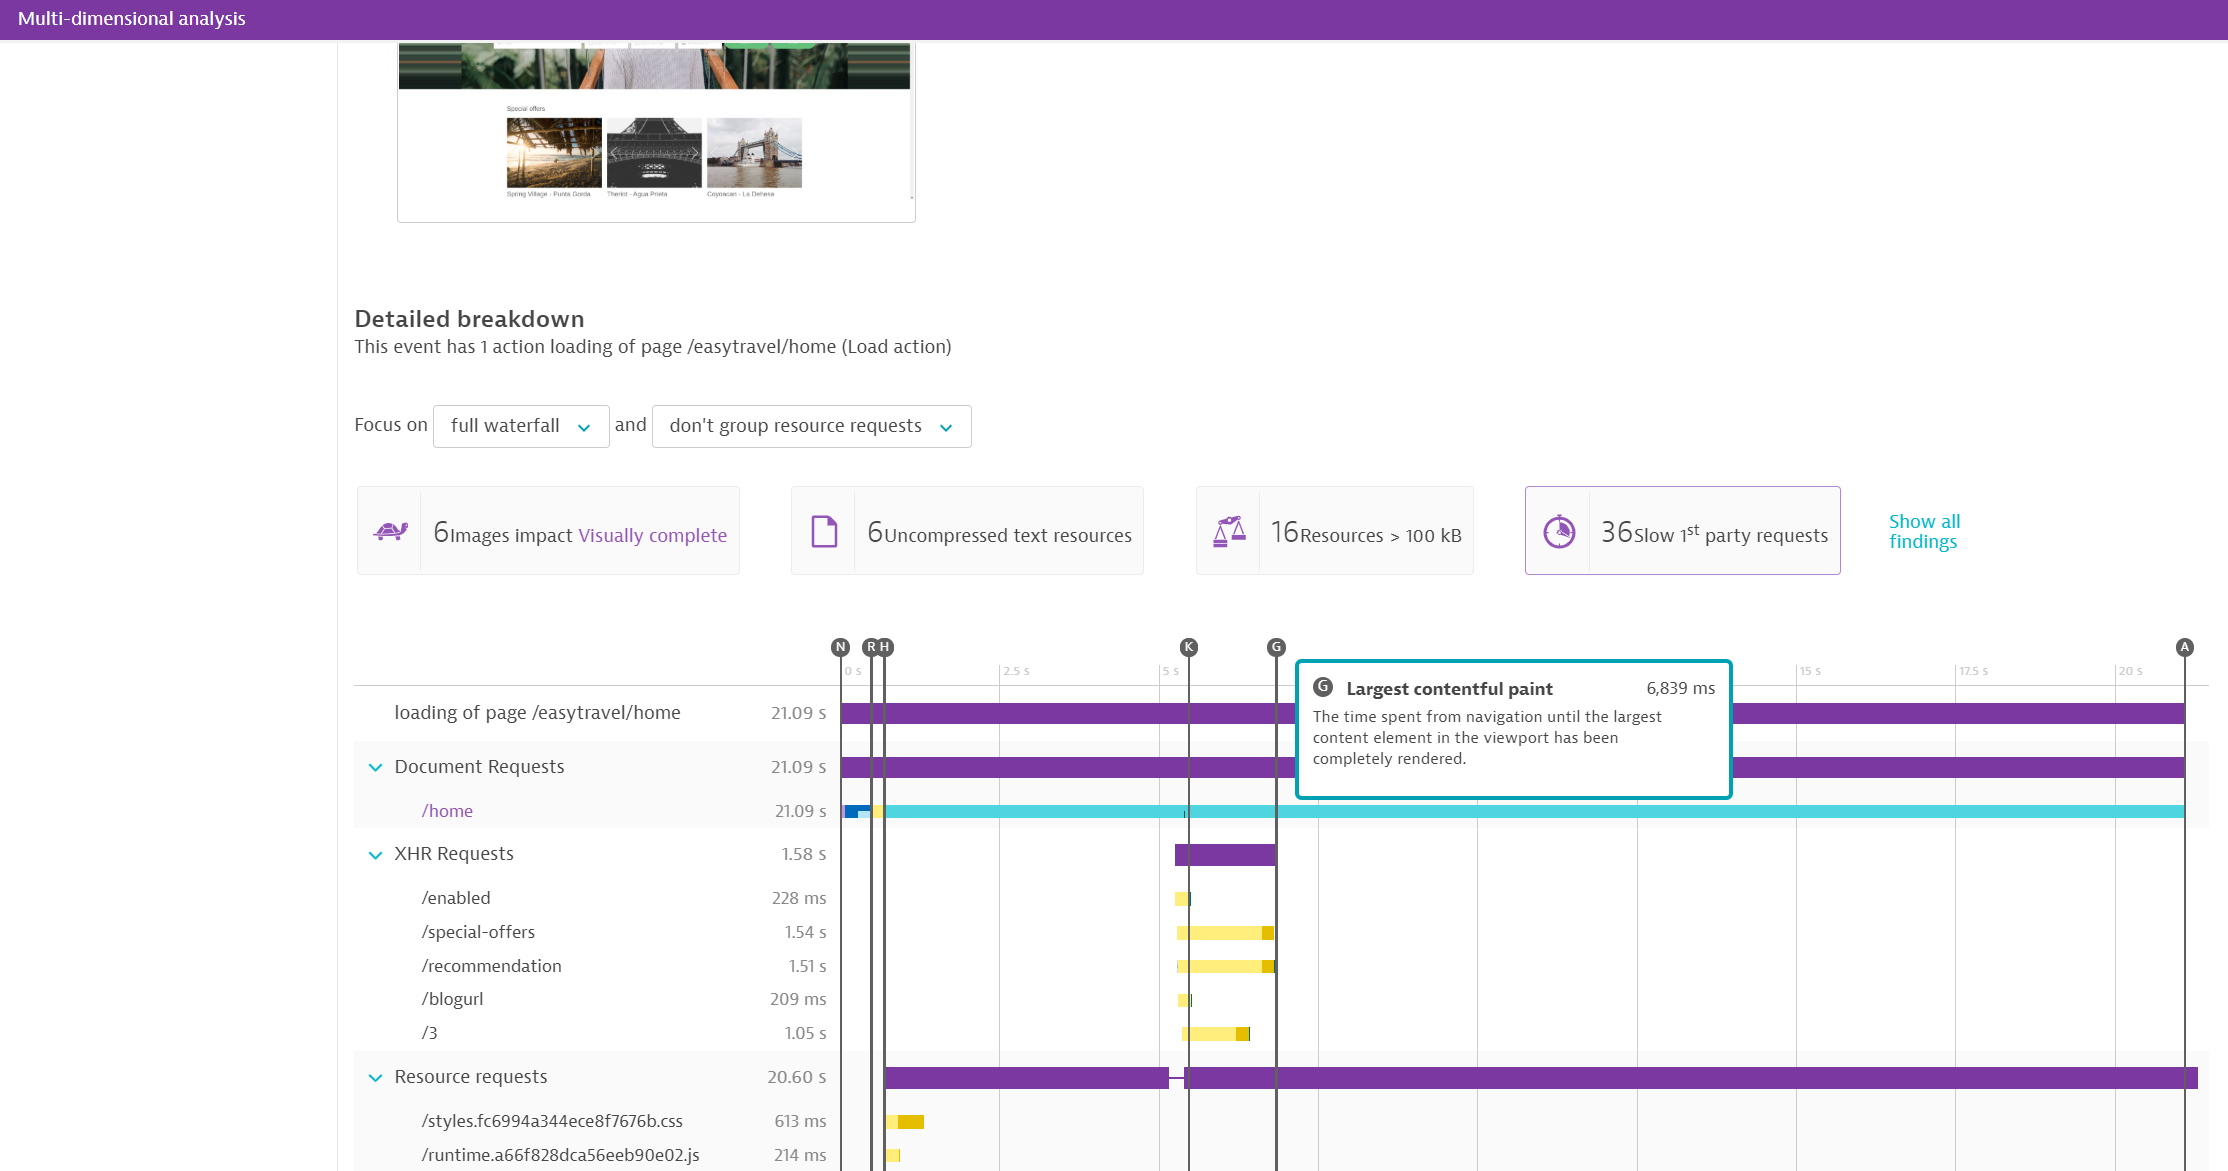
- Largest contentful paint: The time spent from navigation until the largest content element in the viewport is completely rendered
Largest contentful paint (LCP) was also selected as one of the three Core Web Vitals by Google. Google considers an LCP of less than 2.5 seconds to be good user experience. This is definitely a great starting benchmark against which to optimize your application.
The new metrics are shown in the waterfall chart and can be analyzed on demand via multidimensional analysis.
Track specific performance metrics over a long term
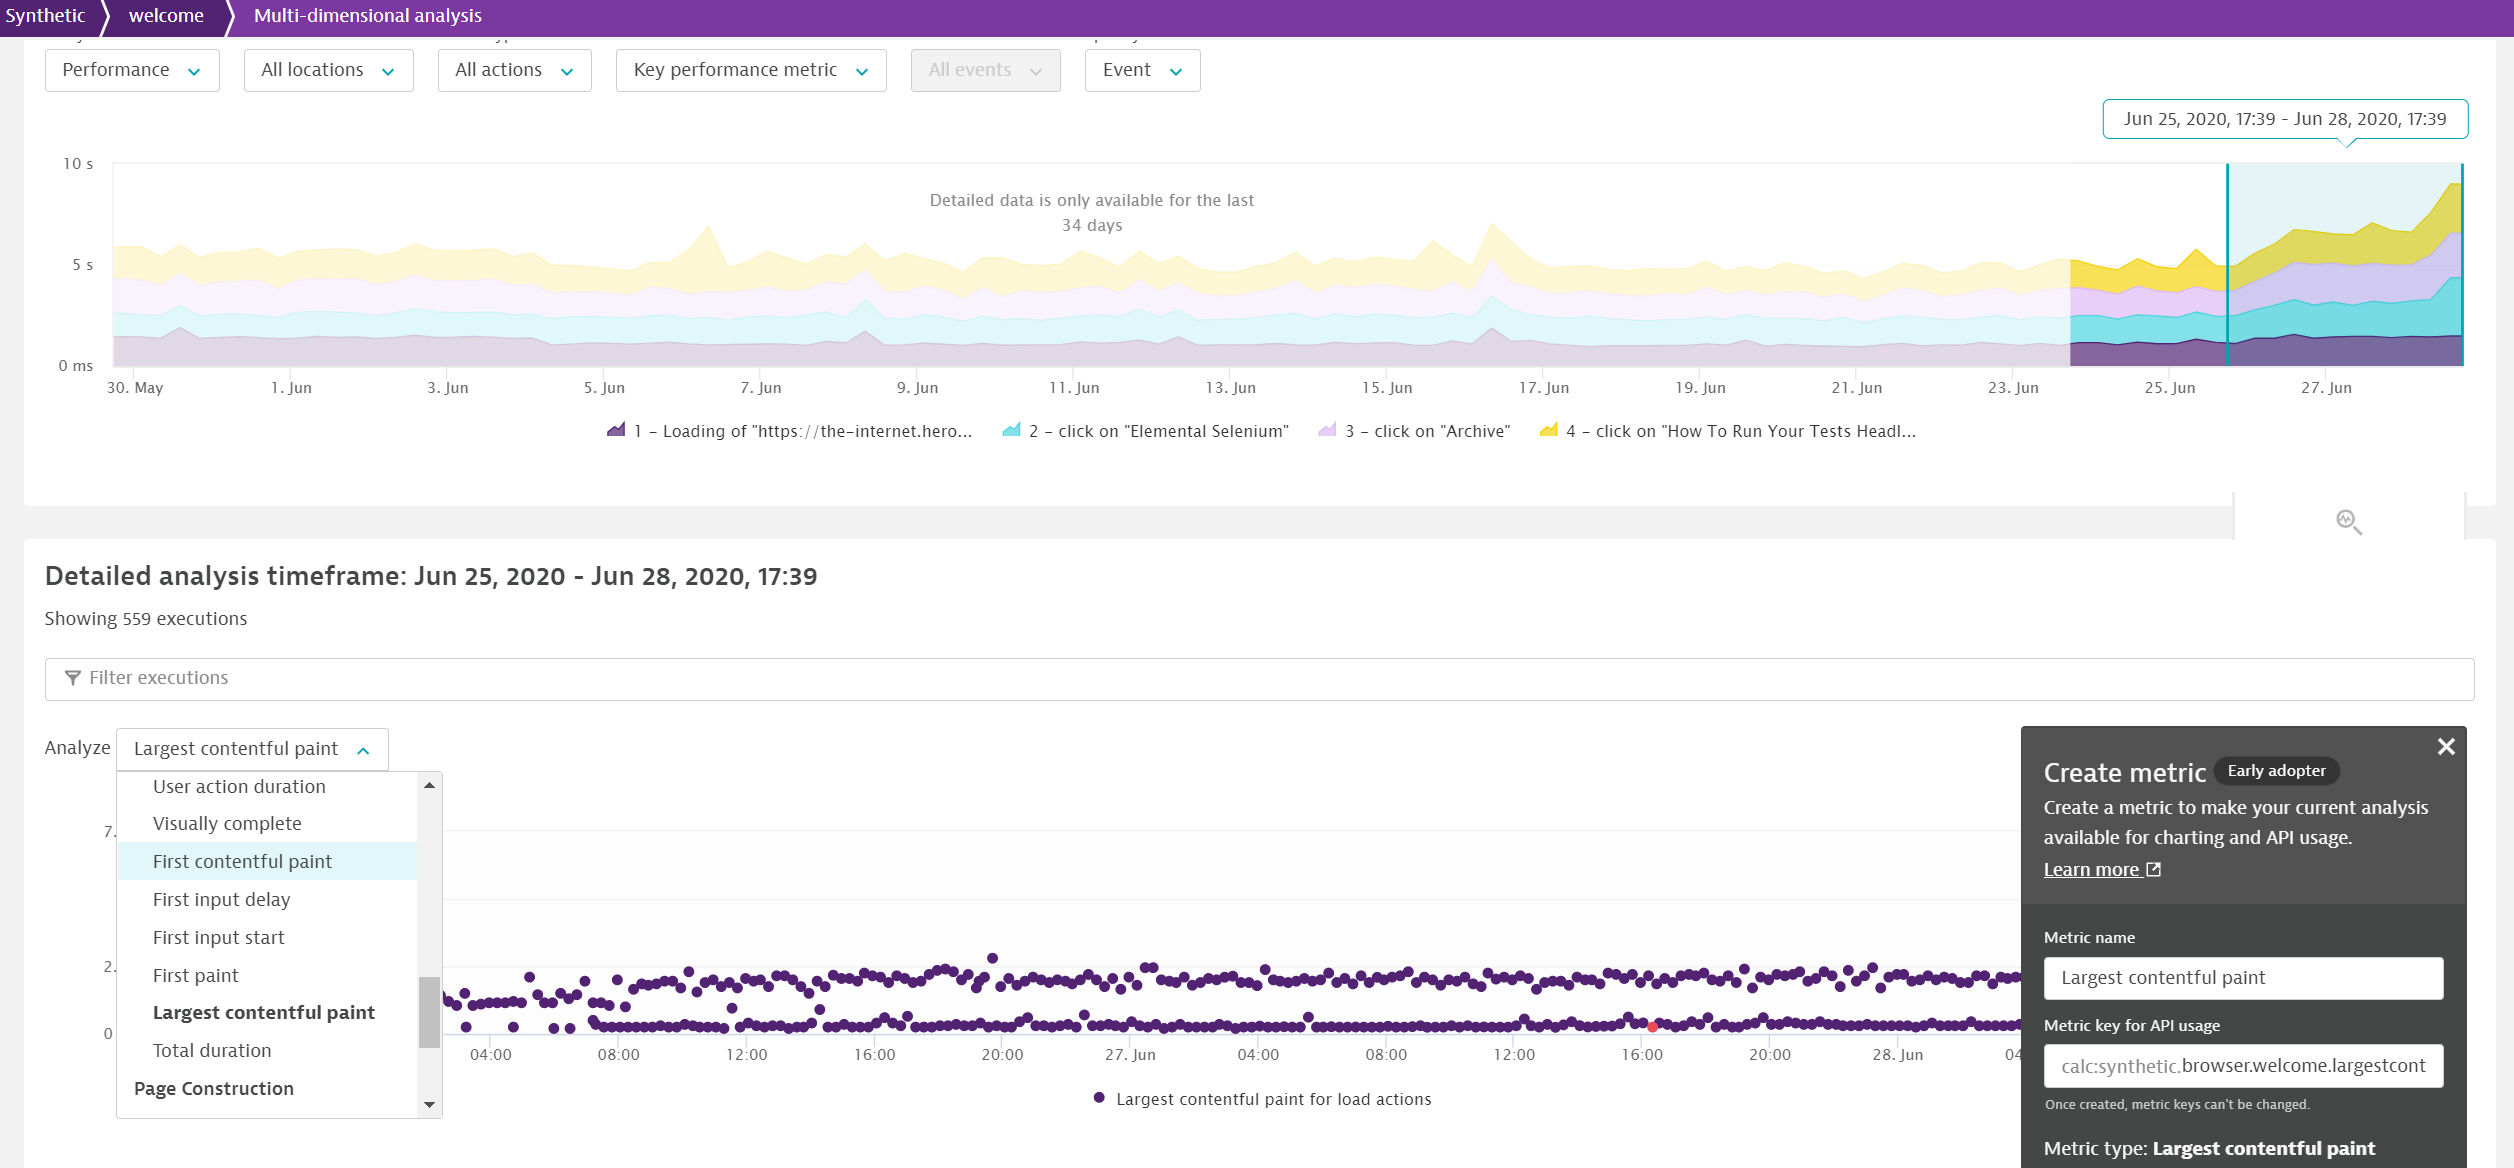
The new web performance metrics are not yet available as key performance metrics. However, it’s still possible to track them long-term in a straightforward way. From your browser monitor’s details page, navigate to the Multidimensional analysis view by selecting Analyze availability or Analyze performance.
In the Detailed analysis section, select your preferred metric, for example, Largest contentful paint, from the Analyze drop-down list. Select Create metric to create a calculated metric that stores long-term data. You can also add a calculated metric to a dashboard, chart it via the custom charting functionally, and pull its data via API.
Additionally, you can also filter data points for specific locations or specific synthetic events if you’re interested in specific pages of a clickpath.
Validate synthetic results with real user data
Synthetic Monitoring is the perfect tool to measure and improve your performance baseline. On the other hand, it’s just as important to validate these improvements against a broad spectrum of real users. Compared to the clean-room environment synthetic data is based on, real user data is a lot more diverse, reflecting different devices, connection types, browsers, and the different data characteristics of your application.
As Dynatrace uses exactly the same technology to capture real user and synthetic data, you can validate your improvements easily. On the Synthetic details page for a browser monitor, simply expand a synthetic event and select a Contributing load action—Dynatrace automatically shows the corresponding real user action. So after checking out improved synthetic metrics, jump over to the application to validate these metric results against your real user data.

Visually complete improvements
Dynatrace made the decision when we first introduced Visually complete three years ago to base our calculations on changes to the DOM rather than measure Visually complete based on a video capture of the page load. This approach has the huge advantage of enabling us to measure Visually complete for synthetic monitors as well as real users. However, the downside of calculating Visually complete based on DOM changes is that it’s definitely a lot more complex.
During the last few years, we’ve made several improvements to Visually complete. With this release, we’ve introduced some of the biggest improvements and changes to Visually complete since it was first released.
- Major changes provide more accurate Visually complete calculation for XHR actions (in an approach that is now more consistent with load actions).
- Sub-elements of mutations are now also taken into account for Visually complete calculation.
- Options are now available for you to fine-tune Visually complete calculation: You can now control various thresholds and timeouts as well as exclude specific elements from the calculation—see our Help page for details on configuration settings. For synthetic monitors, you can set these properties in browser monitor settings: Advanced setup tab > Enable custom JavaScript settings > Custom configuration properties.
Note: The changes and improvements to Visually complete can potentially impact your Visually complete, Speed index, and User action duration baselines. Depending upon your configuration, you may also need to adapt your performance thresholds.
How to enable the new performance metrics and improved Visually complete
You can enable the new web performance metrics and enhanced Visually complete from a dedicated card on the Synthetic monitors page as well as the Synthetic details page for individual browser monitors. Simply select Enable for all browser monitors.
After you enable these metrics, you’ll see a visual indicator in your Visually complete graphs on the Synthetic details page showing exactly when you enabled them.
By when do I need to switch?
Support for the earlier version of Visually complete will end with JavaScript tag version 1.211 for RUM and Syntethic version 1.212.
What’s next
We’re looking forward to your feedback on these new metrics as well as improvements to Visually complete for Synthetic Monitoring. In general, there’s a lot that keeps us busy upgrading Synthetic Monitoring. Here are some recent and upcoming changes:
- Private Synthetic locations are supported for Red Hat 8, Ubuntu 18, and CentOS 8.
- Managing Synthetic credentials is now easier than ever. Additionally, we’re working on better support for NTLM, Digest, and Negotiate authentication.
- Want to synthetically monitor something other than HTTP such as a DNS lookup, a simple ping, or a port check? Take a look at Michael Lundstrom’s latest blog post on synthetic infrastructure monitoring.


Looking for answers?
Start a new discussion or ask for help in our Q&A forum.
Go to forum